

Our Verdict
Introduction, Drive Specifications, Pricing and Availability
In terms of pricing, Patriot has positioned their new Hellfire M.2 NVMe SSD right between upper tier NVMe SSDs and top performing SATA SSDs. We feel this is a good position for the Hellfire. The Hellfire is less expensive than upper tier NVMe SSDs and justifiably more expensive than many lower-performing SATA-based SSDs. Based on most benchmarks, the Hellfire is a mid-level performing NVMe SSD. However, benchmarks alone do not tell the whole story. In the end, the user experience is what matters most. We will tell you up front that the Hellfire delivers a user experience that rivals that of Samsung's 950 Pro.
Patriot's Hellfire is one of the first Phison PS5007-E7-based M.2 NVMe SSDs to hit retail channels. The Hellfire features Phison's latest firmware version 2.1. This is good news because Phison's newest firmware revision is a vast improvement over earlier revisions. With the newest revision, we have seen a substantial increase in moderate workload performance. We feel that moderate workload performance is the best indicator of how well a drive will perform for the majority of users, the majority of the time.
The Hellfire pairs Phison's potent E7 NVMe controller with Toshiba 15nm MLC flash and an LPDDR3 cache. The Hellfire is appealing not only because of the premium components utilized but also because of its M.2 form factor. No power or data cables - just a tiny gum stick-sized SSD that delivers a ton of performance. The tiny Hellfire is powerful, outperforming Intel's 750 Series NVMe SSDs on two of our three moderate workload tests, and more importantly, the Hellfire delivers a noticeably superior user experience.
Intel, Samsung, and OCZ have developed proprietary NVMe drivers that are designed to improve performance and compatibility with their NVMe offerings. Phison has no such plans. Phison feels that their NVMe SSDs perform well enough that a proprietary driver is not necessary. While we would like to see Phison develop a dedicated NVMe driver, we also understand that this can become extremely complicated for them to do because Phison SSDs are branded and sold my many different vendors.
Let's take a close look at the Patriot Hellfire.
Specifications

Patriot's Hellfire M.2 x 2280 NVMe SSD is available in two capacities: 240GB and 480GB. The 480GB model we have on the bench sports the following factory specifications:
- Sequential Read (ATTO): up to 3,000 MB/s
- Sequential Write (ATTO): up to 2,400 MB/s
- Sequential Read (CDM): up to 2,700 MB/s
- Sequential Write (CDM): up to 1,260 MB/s
- Max 4K Random Read Speed: up to 170,000 IOPS
- Max 4K Random Write Speed: up to 210,000 IOPS
- Endurance: 230 TBW
- MTBF: 2 Million Hours
- Warranty: 3-Year Limited Warranty
- SMART
- TRIM
- Garbage Collection
- Software: Patriot PCIe Tool Box
The 480GB Patriot Hellfire is currently selling at Amazon for $279.99.
Our Latest SSD Review Coverage
- Micron 3610 2TB SSD Review - DRAMless QLC at 11,000 MB/s
- SK hynix Platinum P51 2TB SSD Review - A Powerful Gen5 Alternative
- Biwin Black Opal X570 Pro 8TB SSD Review - Massive Capacity with Elite Performance
- Samsung 9100 PRO 1TB SSD Review - Lab Champion at 1TB
- Biwin Black Opal X570 Pro 2TB SSD Review - Powerful and efficient single-sided goodness
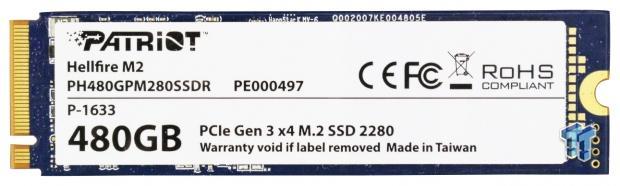
Drive Details
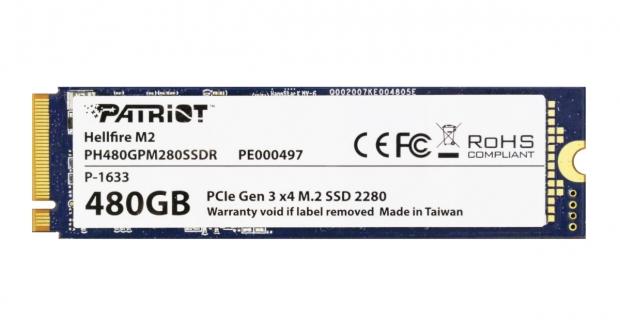
Patriot Hellfire 480GB M.2 NVMe SSD
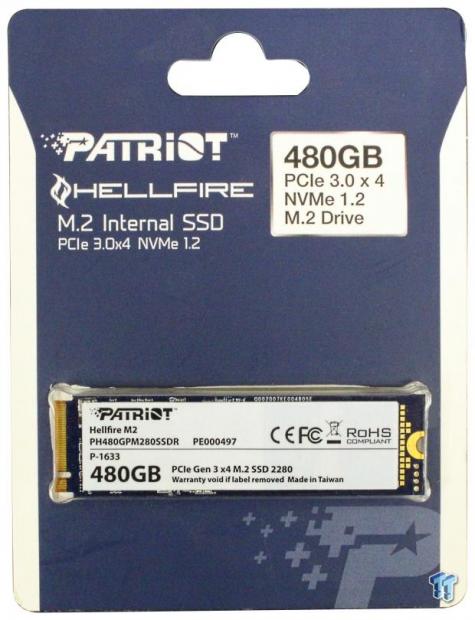
The Hellfire ships in a simple blister pack. The drive is visible through the clear portion of the packaging. The front of the package advertises the drive's capacity, interface, and form factor.
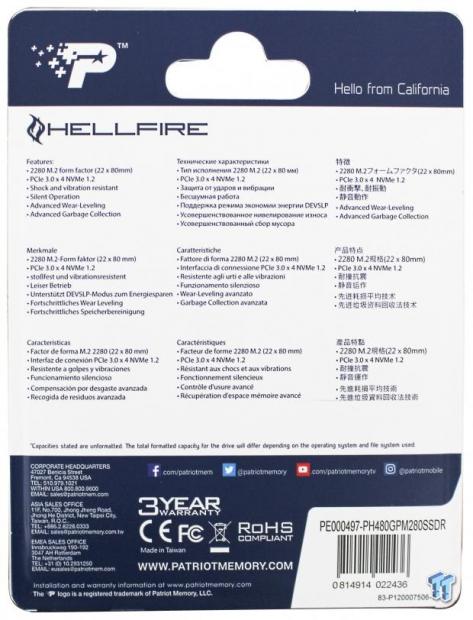
The rear of the packaging advertises the drive's three-year warranty and feature set.
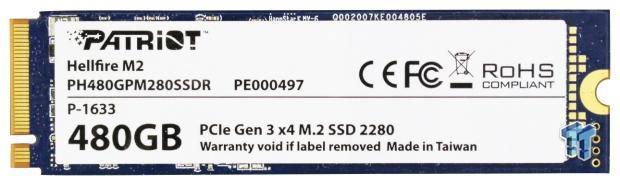
The back of the PCB is covered with a manufacturer label.
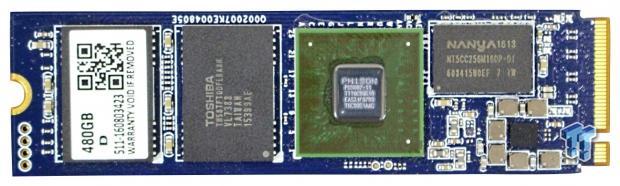
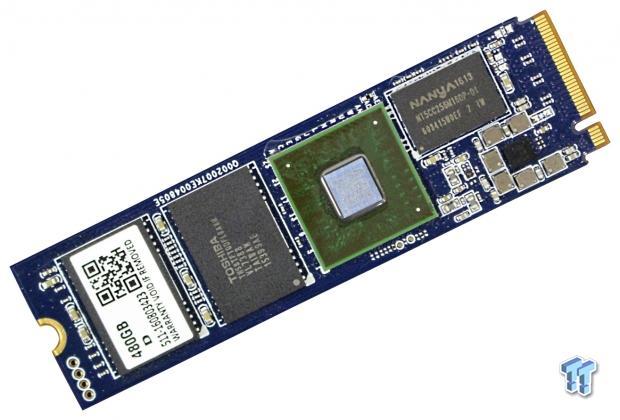
This side of the PBC houses the drive's Phison E7 eight-channel quad-core controller, two 128GB 15nm Toshiba MLC flash packages, and a 512MB DRAM cache package.
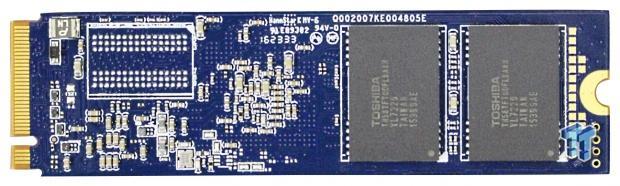
With the label removed, we can see two more 128GB flash packages.
Test System Setup, Drive Properties & Patriot PCIe Tool Box Utility
Jon's Consumer PCIe SSD Review Test System Specifications
- Motherboard: ASRock OC Formula Z170 - Buy from Amazon / Read our review
- CPU: Intel Core i7 6700K @ 4.7GHz - Buy from Amazon / Read our review
- Cooler: Swiftech H2O-320 Edge - Buy from Amazon / Read our review
- Memory: Corsair Vengeance LPX DDR4 16GB 3200MHz - Buy from Amazon
- Video Card: Onboard Video
- Case: IN WIN X-Frame - Buy from Amazon / Read our review
- Power Supply: Seasonic Platinum 1000 Watt Modular - Buy from Amazon / Read our review
- OS: Microsoft Windows 10 Professional 64-bit - Buy from Amazon
- Drivers: Intel RAID option ROM version 14.6.0.1029 and Windows 10 NVMe driver
We would like to thank ASRock, Crucial, Intel, Corsair, RamCity, IN WIN, and Seasonic for making our test system possible.
Drive Properties
Patriot Hellfire 480GB OS Disk 75% Full
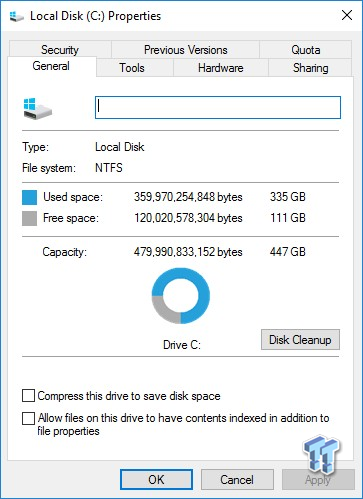
The majority of our testing is performed with our test drive as our boot volume. Our boot volume is 75% full for all OS Disk "C" drive testing to replicate a typical consumer OS volume implementation. We feel that most of you will be utilizing your SSDs for your boot volume and that presenting you with results from an OS volume is more relevant than presenting you with empty secondary volume results.
System settings: Cstates and Speed stepping are both disabled in our systems BIOS. Windows High-Performance power plan is enabled. Windows write caching is enabled, and Windows buffer flushing is disabled. We are utilizing Windows 10 Pro 64-bit OS (Build 14393) for all of our testing except for our MOP (Maxed-Out Performance) benchmarks where we switch to Windows Server 2008 R2 64-bit. Empty Windows 10 benchmark screenshots will also be shown on our MOP page.
Patriot PCIe Tool Box V1.00
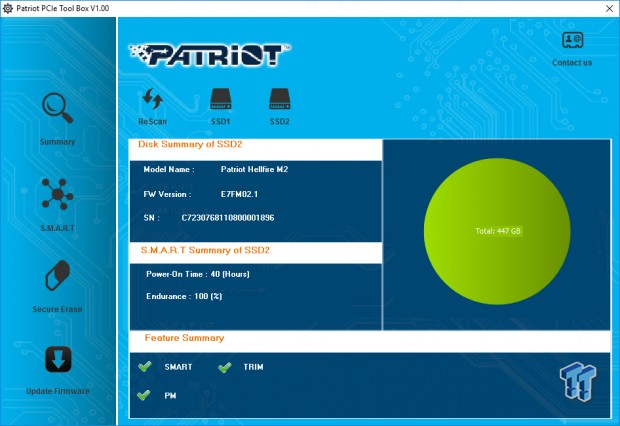
The summary page lists the drive model, firmware revision, serial number, power on time, endurance remaining, and active features.
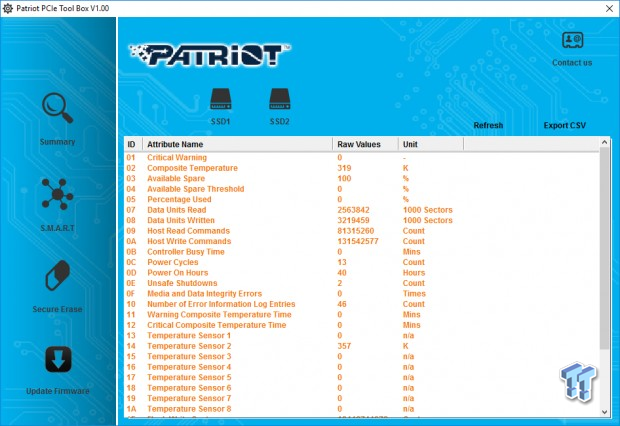
The S.M.A.R.T page lists the monitored attributes of the SSD.
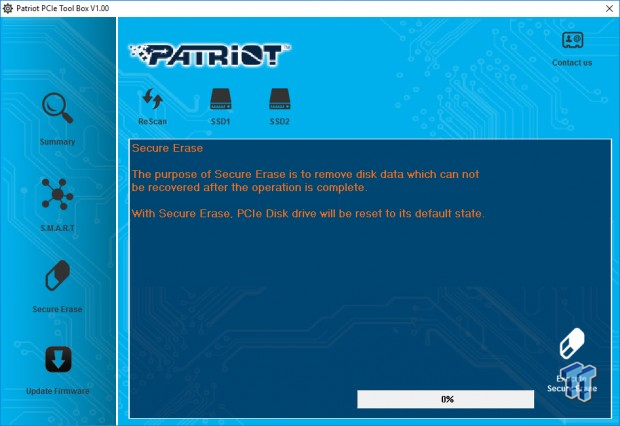
The Secure Erase page allows you to easily secure erase the Hellfire inside of Windows.
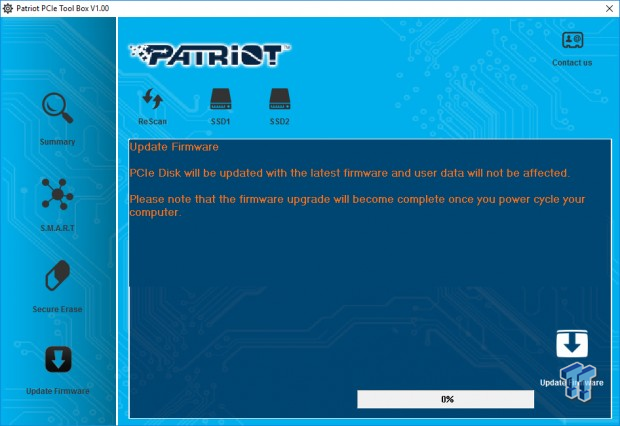
The Update Firmware page makes updating firmware a simple task.
Synthetic Benchmarks - ATTO & Anvil Storage Utilities
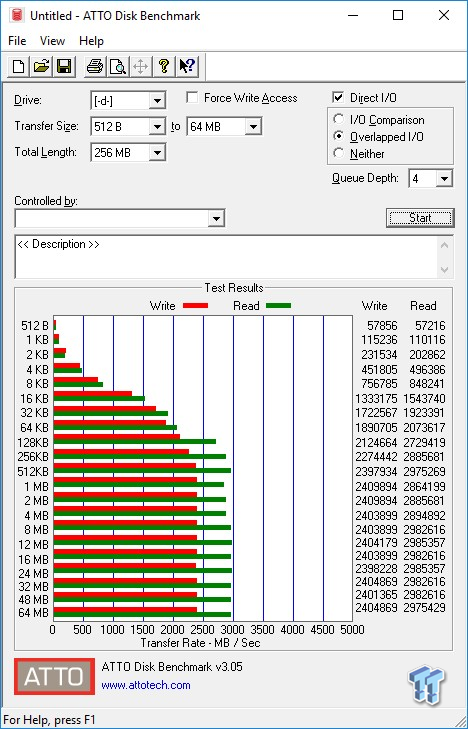
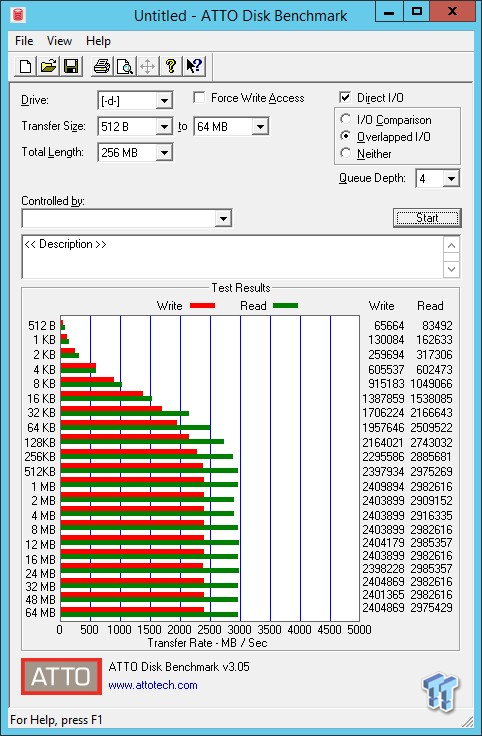
ATTO
Version and / or Patch Used: 2.47
ATTO is a timeless benchmark used to provide manufacturers with data used for marketing storage products.
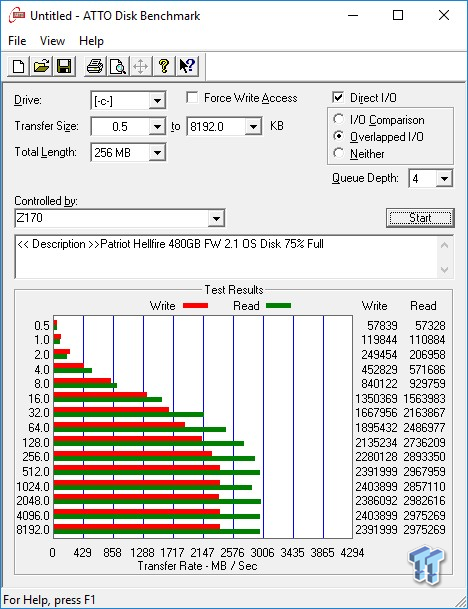
Sequential read/write transfers max out at an impressive 2,982/2,403 MB/s. Keep in mind this is our OS volume, and it is filled to 75% of its total capacity. The highest sequential read performance is achieved at 2MB transfers. The highest sequential write performance is achieved at 1MB transfers. The way Phison controlled SSDs handle compressible data is much different than incompressible data, which is why the Hellfire achieves such massive transfer rates in this test.
Sequential Write
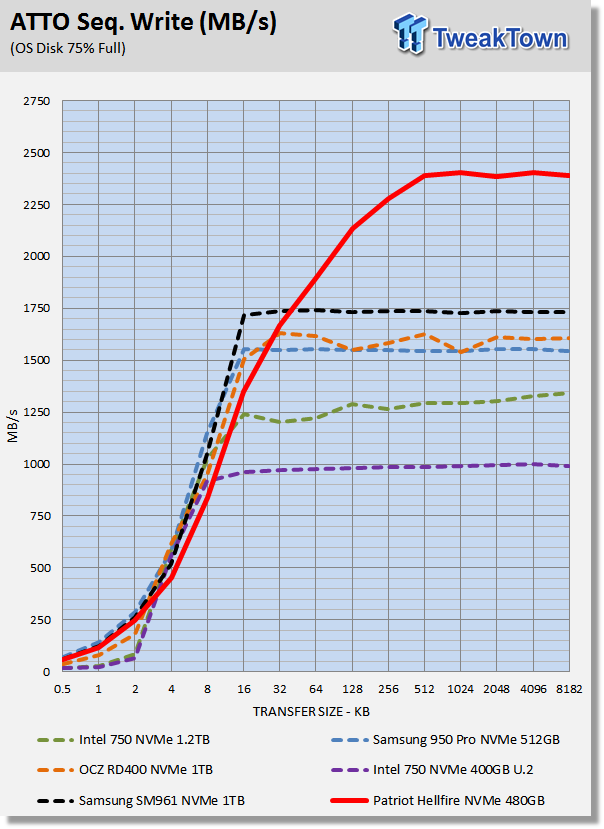
At 64KB transfers, the Hellfire takes a massive lead over the competing drive's in our test pool. The Hellfire is only capable of this kind of performance when the data transfer is fully compressible.
Sequential Read
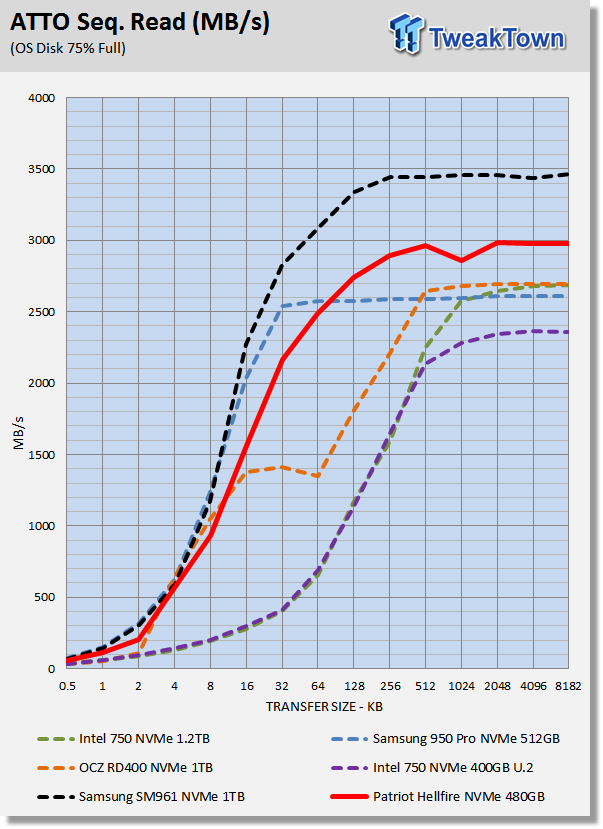
The Hellfire delivers the goods when reading sequential data. Of the drives in our test pool, only Samsung's SM961 can outperform the Hellfire from start to finish.
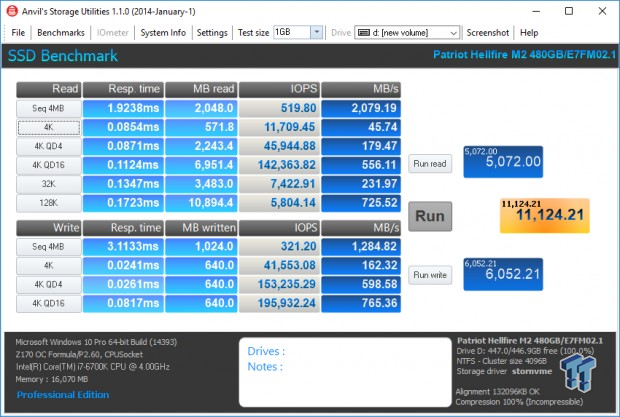
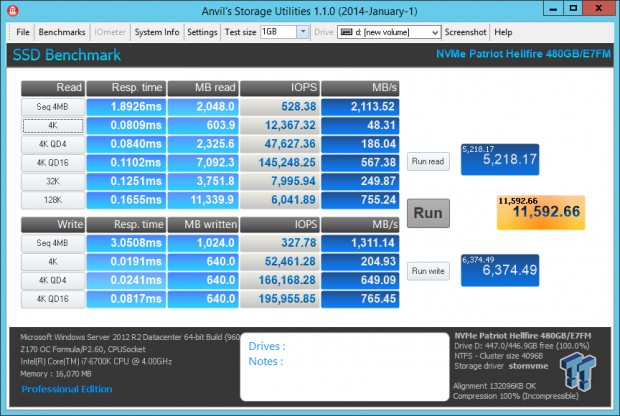
Anvil Storage Utilities
Version and / or Patch Used: 1.1.0
Anvil's Storage Utilities is a storage benchmark designed to measure the storage performance of SSDs. The Standard Storage Benchmark performs a series of tests; you can run a full test or just the read or write test, or you can run a single test, i.e. 4K QD16.
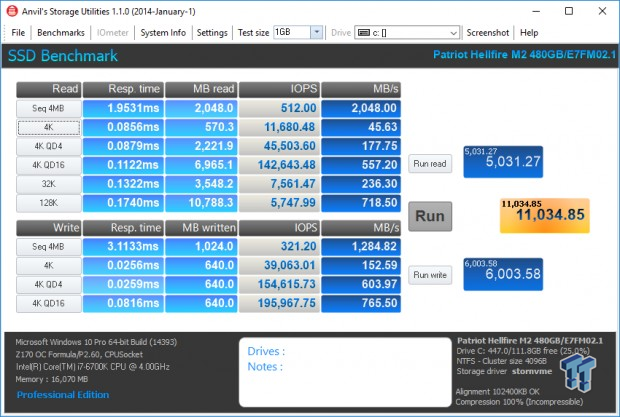
Scoring
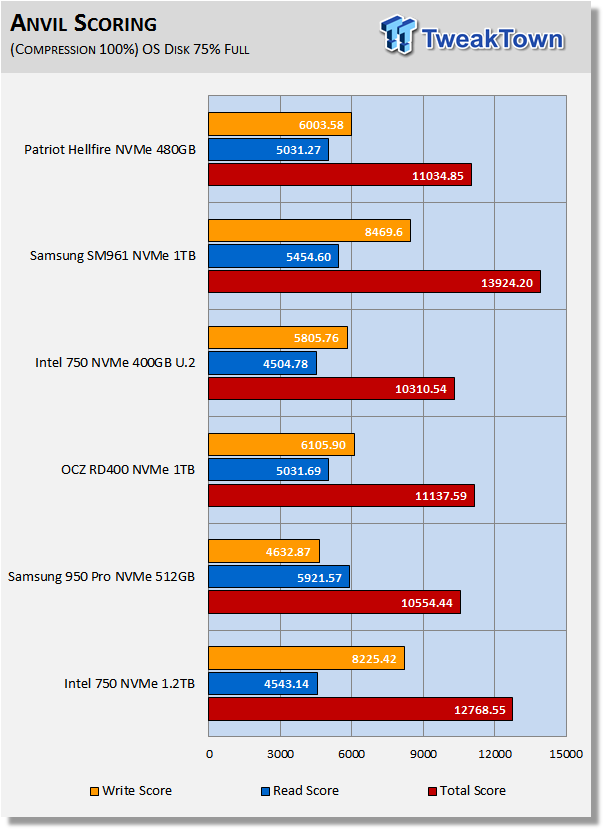
Anvil's scoring gives a good indication of a drive's overall performance. In terms of overall scoring, Patriot's Hellfire lands in the middle of our test pool. The Hellfire manages to outscore Samsung's 950 Pro and Intel's 400GB 750 Series NVMe SSD.
(Anvil) Read IOPS through Queue Depth Scale
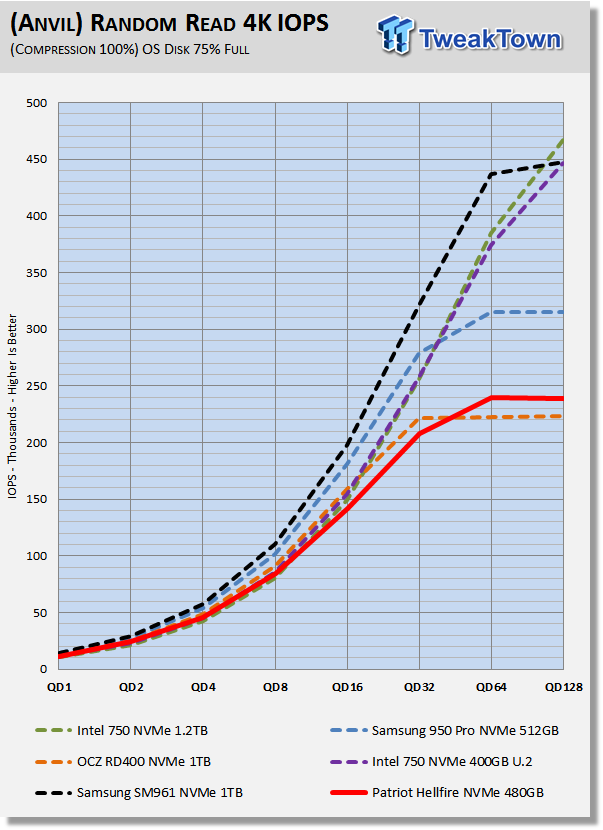
The Hellfire hangs in there with the Intel 750's up to QD8. The Hellfire manages to overtake OCZ's RD400 at QD64, however, overall, the Hellfire is outperformed by the competition.
(Anvil) Write IOPS through Queue Scale
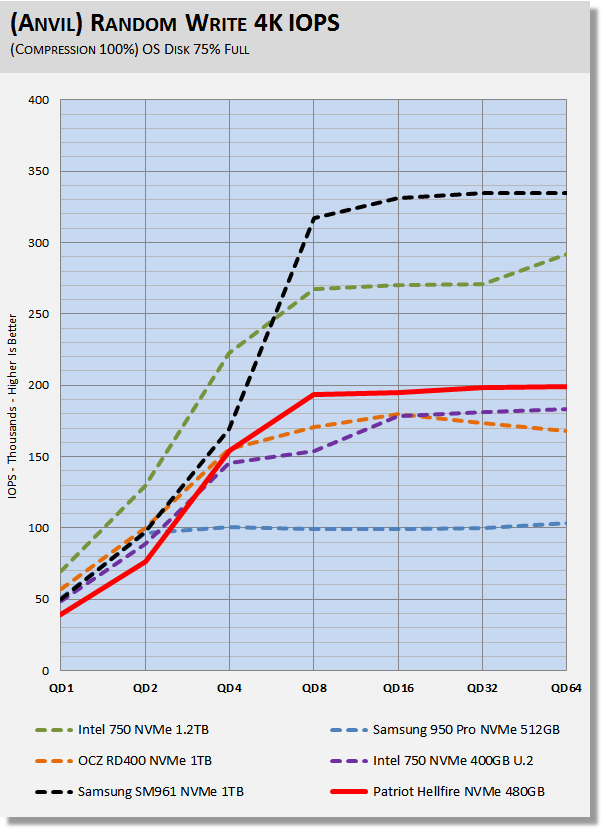
Patriot's Hellfire is a write centric SSD as evidenced by this chart. Overall, the Hellfire outperforms the 950 Pro, RD400, and 400GB Intel 750. We would like to see better QD1-2 performance, but the Hellfire doesn't kick into high gear until we hit QD4. The Intel 750 1.2TB delivers the best low queue depth performance, and the SM961 the best high queue depth performance.
Synthetic Benchmarks – CrystalDiskMark & AS SSD
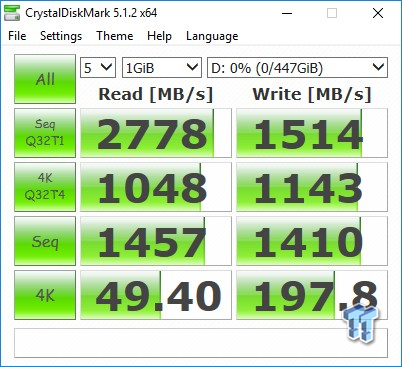
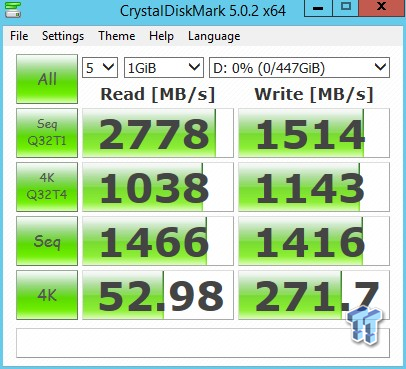
CrystalDiskMark
Version and / or Patch Used: 3.0 Technical Preview
CrystalDiskMark is disk benchmark software that allows us to benchmark 4k and 4k queue depths with accuracy. Note: Crystal Disk Mark 3.0 Technical Preview was used for these tests since it offers the ability to measure native command queuing at QD4.
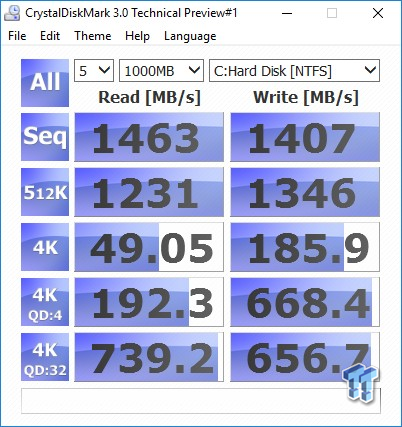
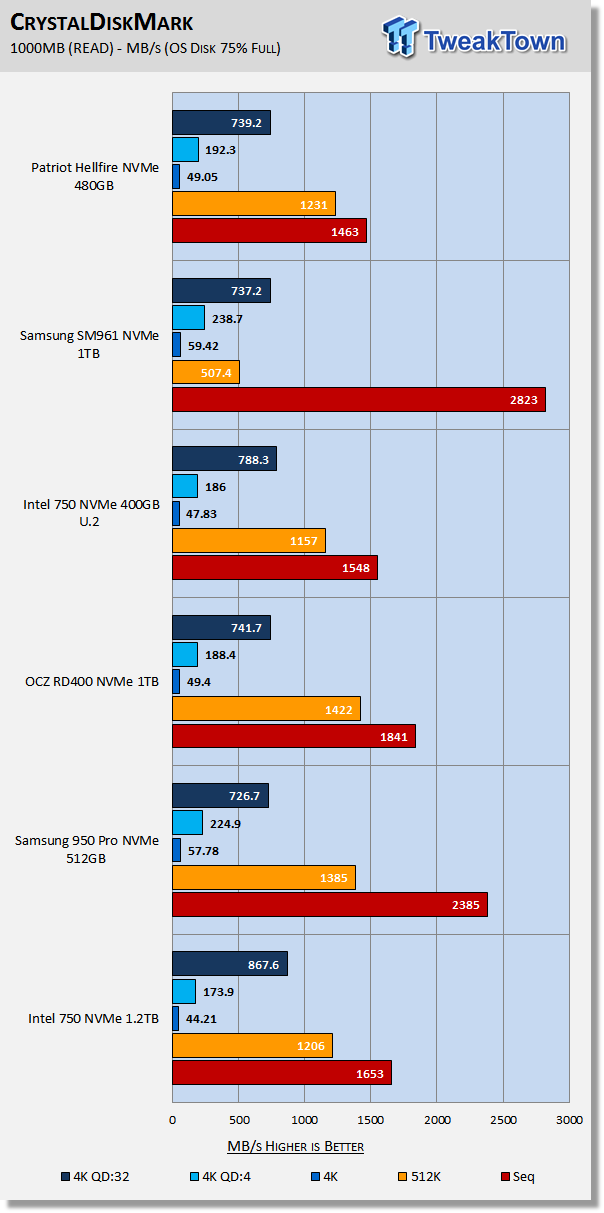
With this version of CDM, sequential performance is measured at QD1 which is the reason sequential rates are lower than Patriot's quoted numbers. Look to our Windows 10 MOP results for CDM results that are measured as quoted by Patriot. With CDM, we like to focus in on 4K random performance. At 4K QD1, the Hellfire is running ahead of the Intel drives and about equal with OCZ's RD400. At 4K QD4, the Hellfire leads all but Samsung's 950 Pro. At 4K QD32, the Hellfire takes the lead over Samsung's 950 Pro and SM961.
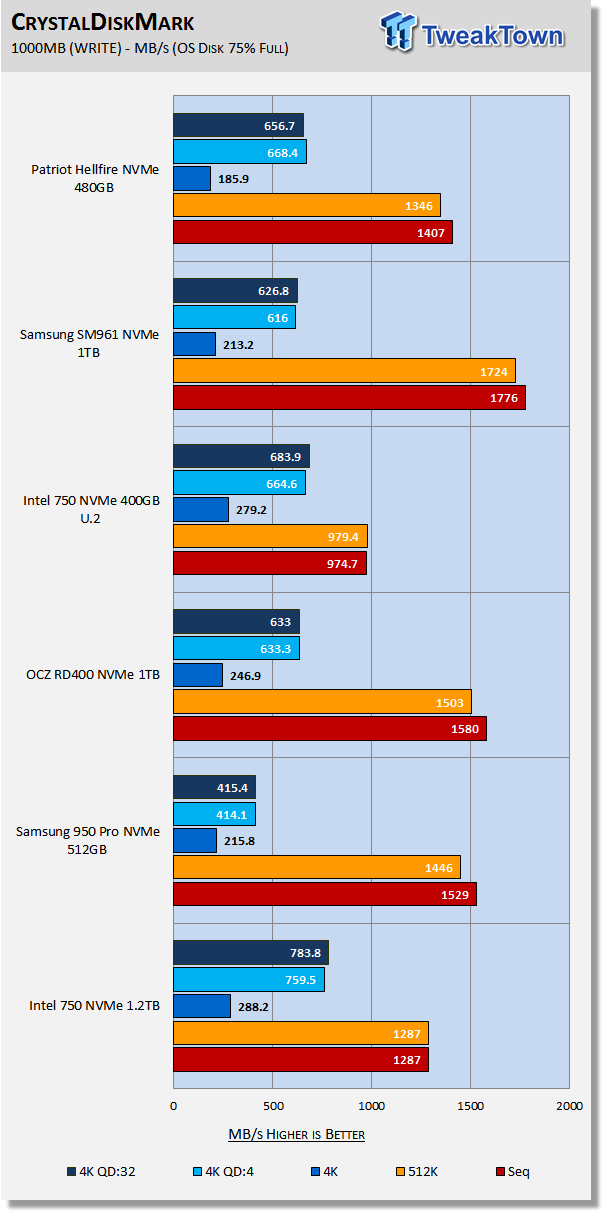
The Hellfire outperforms the Intel drives sequentially, however, the Hellfire is outperformed by the 750's in 4K random performance. At 4K QD4 and 4K QD32, the Hellfire delivers middle of the road performance, defeating the 950 Pro, SM961, and RD400.
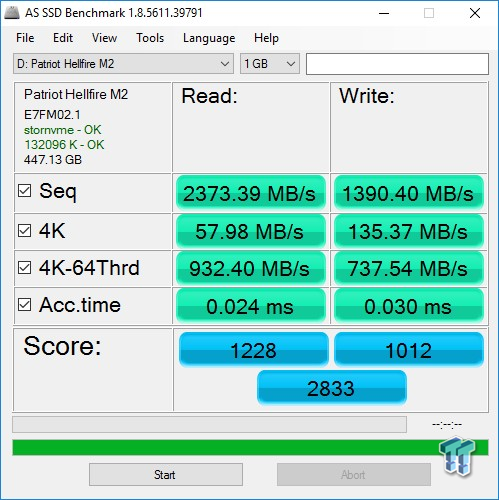
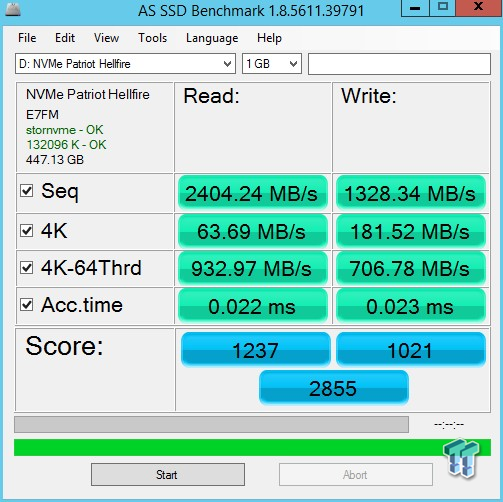
AS SSD
Version and / or Patch Used: 1.7.4739.38088
AS SSD determines the performance of SSDs. The tool contains four synthetic as well as three practice tests. The synthetic tests are to determine the sequential and random read and write performance of the SSD.
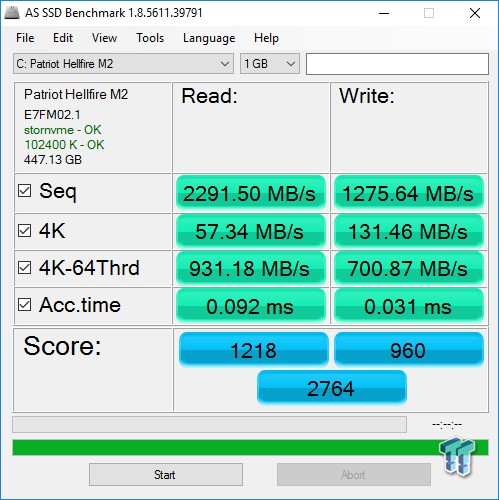
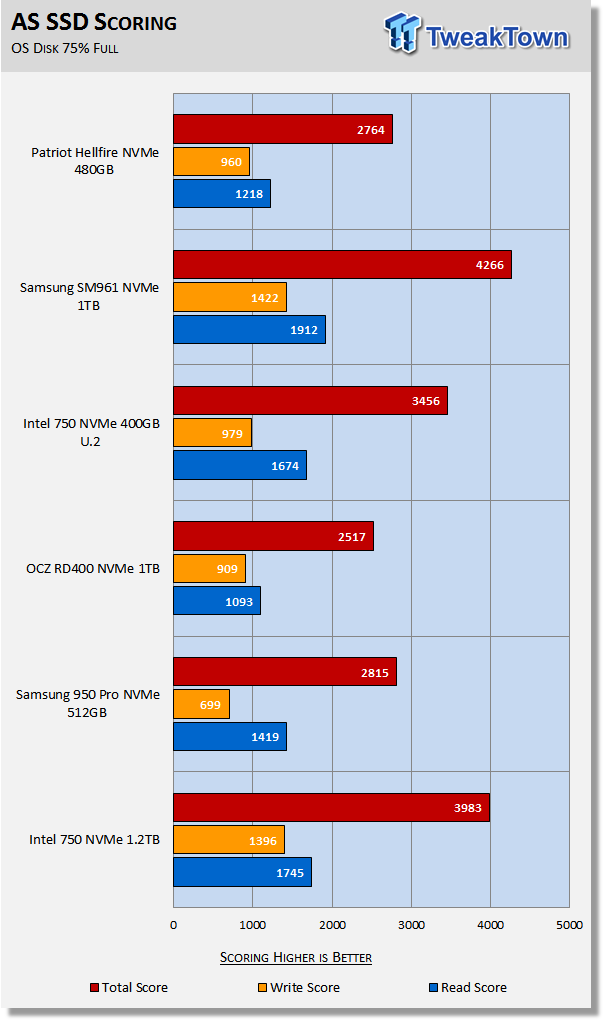
AS SSD is a demanding test, and the Hellfire delivers more than acceptable performance. This test is greatly impacted in a negative way when data is on the disk, as you will see when we get to our MOP testing, which is run without data on the disk.
The Hellfire, like all E7-powered SSDs, delivers astounding 4K QD1 read performance, while conversely getting hammered by 4K QD1 write. We want to see a minimum score of 2,500 coming from any NVMe SSD, and in that respect, the Hellfire delivers the goods in a more than acceptable fashion.
Benchmarks (OS) - PCMark Vantage, PCMark 7 & PCMark 8
Moderate Workload Model
We categorize these tests as indicative of a moderate workload environment.
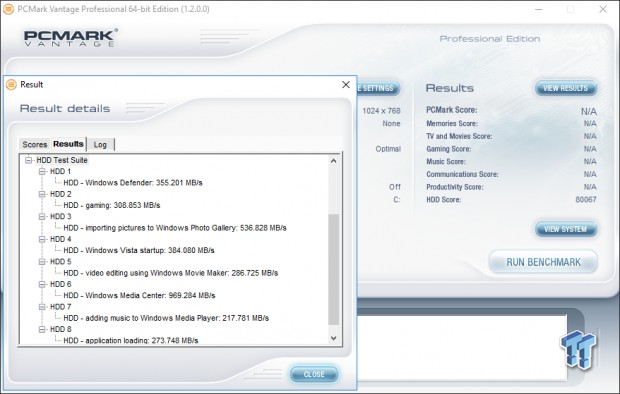
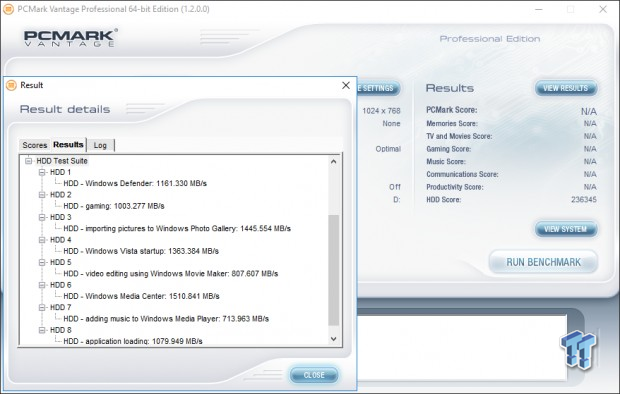
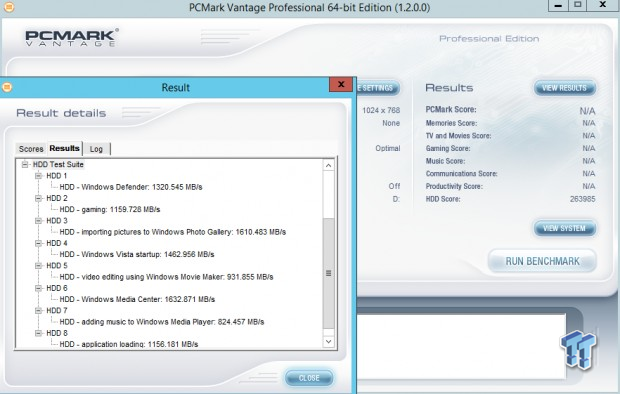
PCMark Vantage - Hard Disk Tests
Version and / or Patch Used: 1.2.0.0
The reason we like PCMark Vantage is because the recorded traces are played back without system stops. What we see is the raw performance of the drive. This allows us to see a marked difference between scoring that other trace-based benchmarks do not exhibit. An example of a marked difference in scoring on the same drive would be empty vs. filled vs. steady state.
We run Vantage three ways. The first run is with the OS drive 75% full to simulate a lightly used OS volume filled with data to an amount we feel is common for most users. The second run is with the OS volume written into a "Steady State" utilizing SNIA's consumer guidelines. Steady state testing simulates a drive's performance similar to that of a drive that been subjected to consumer workloads for extensive amounts of time. The third run is a Vantage HDD test with the test drive attached as an empty, lightly used secondary device.
OS Volume 75% Full - Lightly Used

OS Volume 75% Full - Steady State
Secondary Volume Empty - FOB
There's a big difference between an empty drive, one that's 75% full/used, and one that's in a steady state.

The important scores to pay attention to are "OS Volume Steady State" and "OS Volume 75% full." These two categories are most important because they are indicative of typical of consumer user states. When a drive is in a steady state, it means garbage collection is running at the same time it's reading/writing. This is exactly why we focus on steady state performance.
What we can take away from this test is that the Hellfire suffers a bit more than the others when written into a steady state. In a lightly used 75% full state, the Hellfire outperforms three of the six drives in our test pool. In a steady state, the Hellfire only outperforms the 400GB Intel 750.
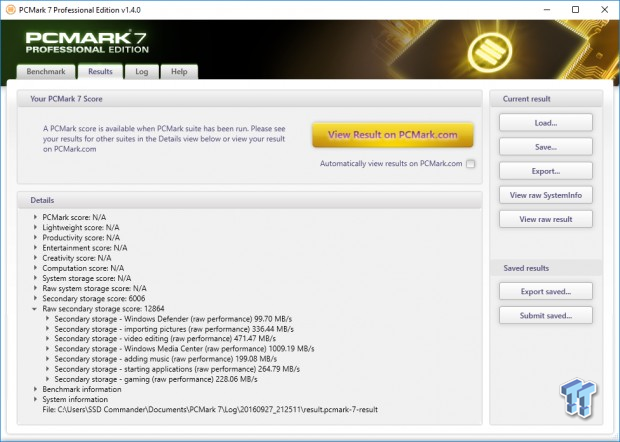
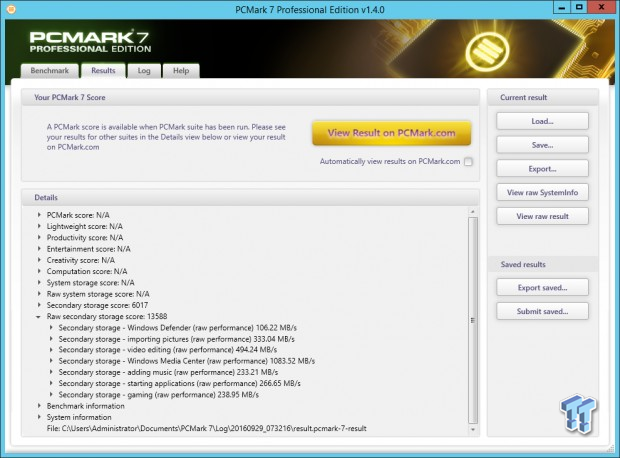
PCMark 7 - System Storage
Version and / or Patch Used: 1.4.0
We will look to Raw System Storage scoring for evaluation because it's done without system stops and, therefore, allows us to see significant scoring differences between drives.
OS Volume 75% Full - Lightly Used
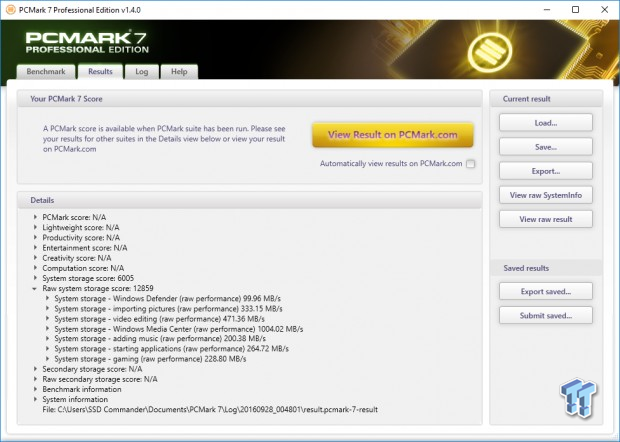
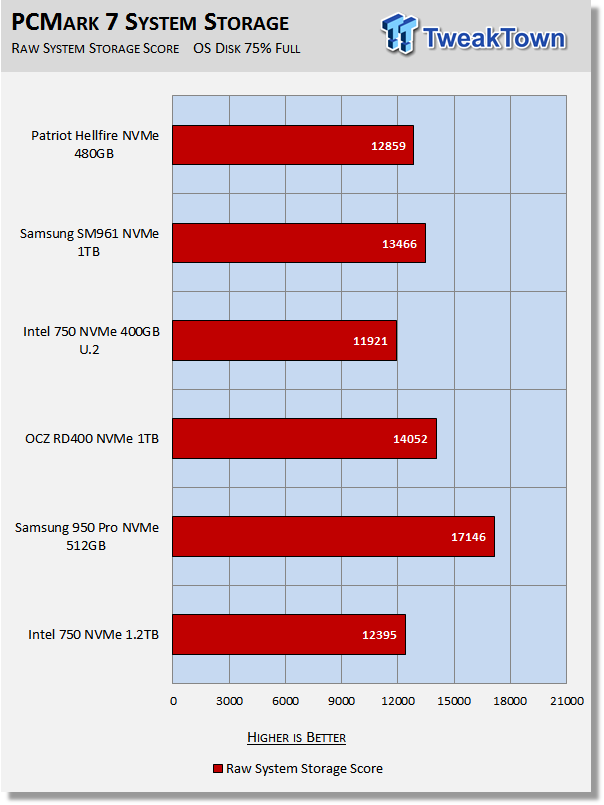
Here again, we see the Hellfire delivering better performance than Intel's 750 Series SSDs. This is where a dedicated NVMe driver would pay dividends for Phison. With NVMe SSDs, moderate workload performance greatly benefits from a dedicated NVMe driver. With a dedicated NVMe driver, we suspect the Hellfire would give the RD400 a run for its money.
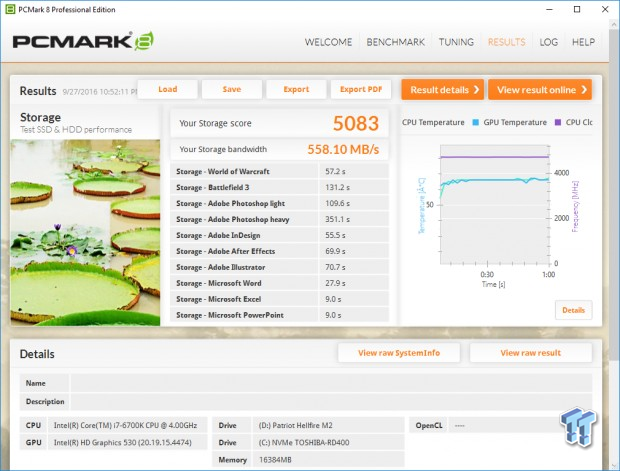
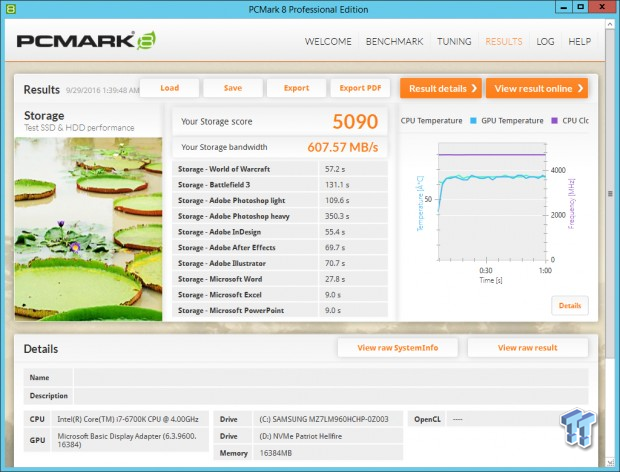
PCMark 8 - Storage Bandwidth
Version and / or Patch Used: 2.4.304
We use PCMark 8 Storage benchmark to test the performance of SSDs, HDDs, and hybrid drives with traces recorded from Adobe Creative Suite, Microsoft Office, and a selection of popular games. You can test the system drive or any other recognized storage device, including local external drives. Unlike synthetic storage tests, the PCMark 8 Storage benchmark highlights real-world performance differences between storage devices.
OS Volume 75% Full - Lightly Used
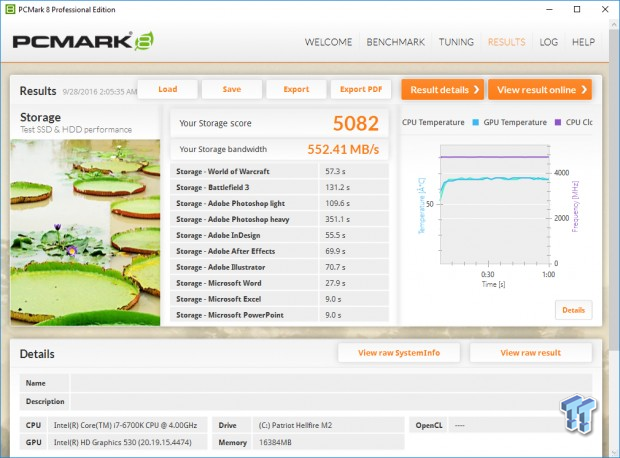
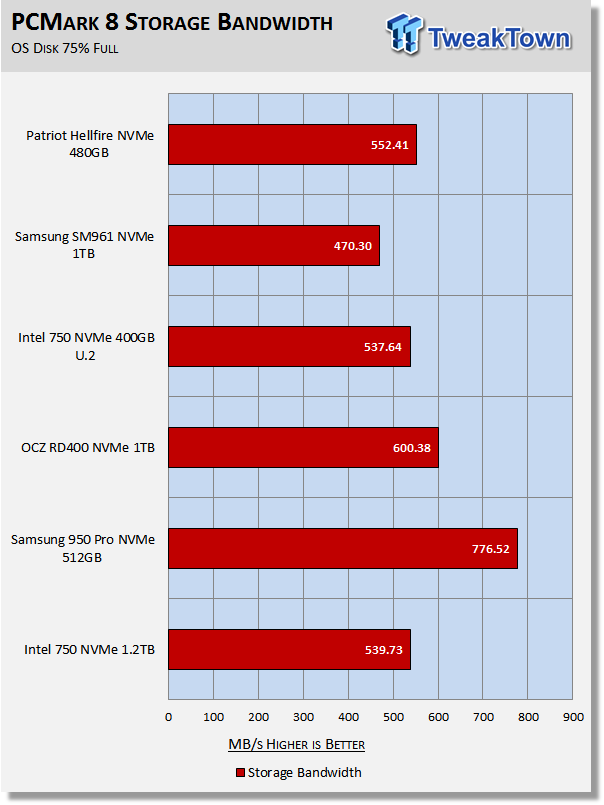
PCMark 8 is the most intensive moderate workload simulation we run. With respect to moderate consumer type workloads, this test is what we consider the best indicator of a drive's performance.
The Hellfire delivers very respectable performance, especially when you consider the Hellfire is doing this without the benefit of a dedicated NVMe driver. Additionally, this is with the Microsoft Windows 10 NVMe driver, which is absolutely horrendous.
If we run the Hellfire on Windows 8.1, it will deliver over 600 MB/s in storage bandwidth. Again, the Hellfire outperforms Intel's 750 Series SSDs with moderate workloads. Samsung's SM961 is the only other SSD in our test pool that doesn't have a dedicated driver, and the Hellfire outperforms it in this test.
Benchmarks (Secondary) - IOPS, Response & Transfer Rate
Iometer – Maximum IOPS
Version and / or Patch Used: Iometer 2014
We use Iometer to measure high queue depth performance. (No Partition)
Max IOPS Read
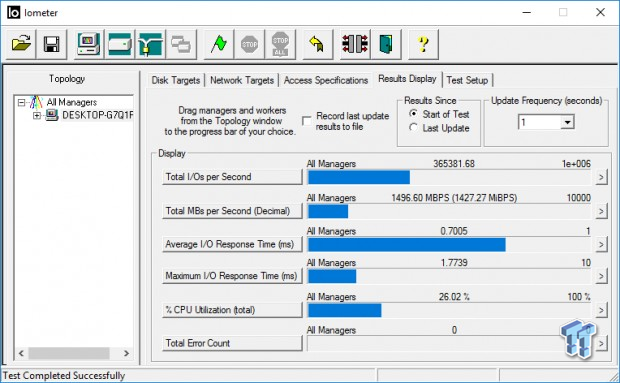
Max IOPS Write
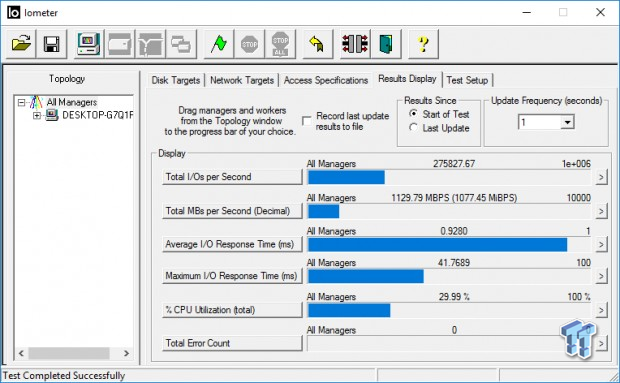
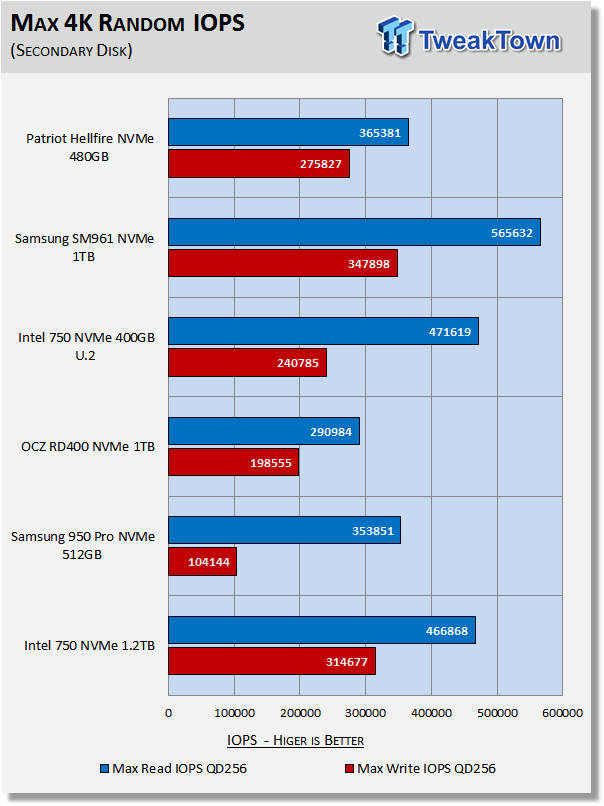
Patriot's Hellfire is capable of hitting 365K 4K read IOPS and 275K write IOPS at a queue depth of 256. This is better than both the RD400 and 950 Pro. These figures are both well above those specified by Patriot on their Hellfire product sheet.
Iometer – Disk Response
Version and / or Patch Used: Iometer 2014
We use Iometer to measure disk response times. Disk response times are measured at an industry accepted standard of 4K QD1 for both write and read. Each test runs twice for 30 seconds consecutively, with a 5-second ramp-up before each test. We partition the drive/array as a secondary device for this testing.
Avg. Write Response
Avg. Read Response
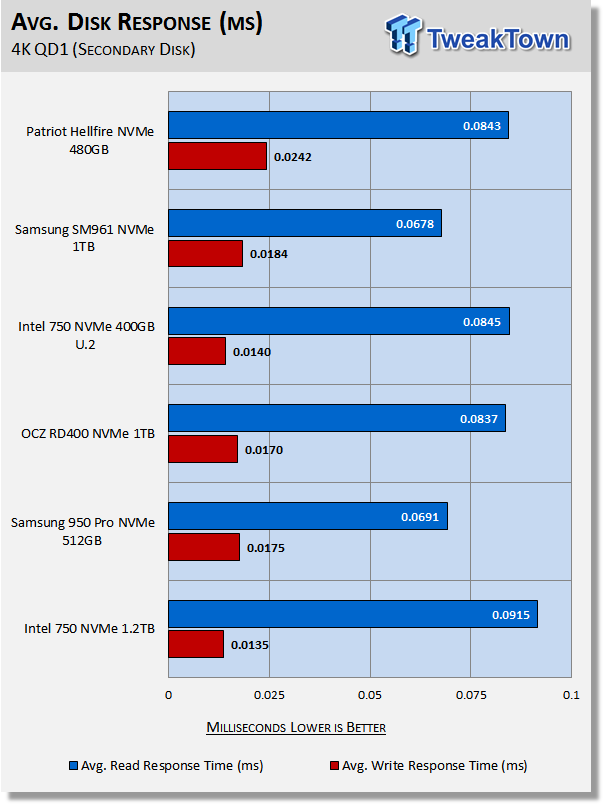
The Hellfire delivers better QD1 read response than the Intel 750's, but loses across the board otherwise. The Hellfire's QD1 write response is the highest (worst) of the drives in our test pool.
DiskBench – Transfer Rate
Version and / or Patch Used: 2.6.2.0
We use DiskBench to time a 28.6GB block (9,882 files in 1,247 folders) composed primarily of incompressible sequential and random data as it's transferred from our Toshiba RD400 1TB NVME SSD to our test drive. We then read from a 6GB zip file that's part of our 28.6GB data block to determine the test drive's read transfer rate. Our system is restarted prior to the read test to clear any cached data, ensuring an accurate test result.
Write Transfer Rate
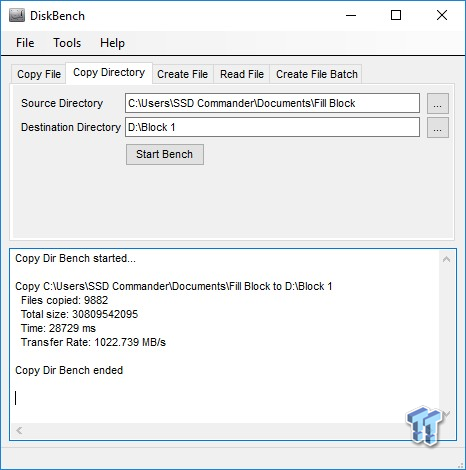
Read Transfer Rate
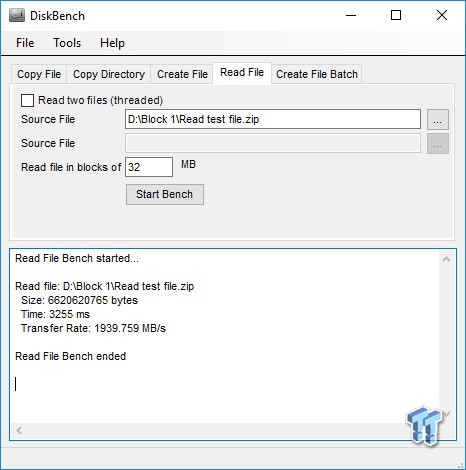
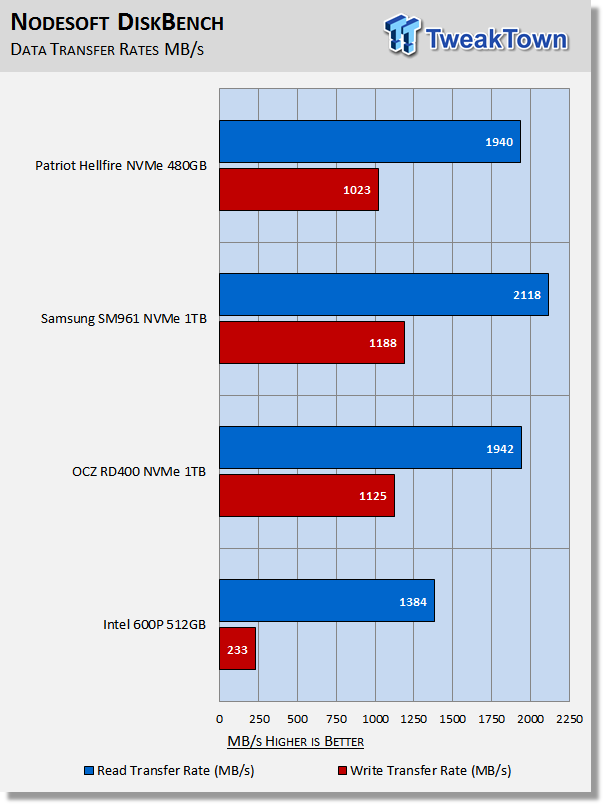
We recently upgraded our test system to Windows 10 build 14393. With that upgrade, write transfer rates almost doubled. The reason for this, as far as we know, is that CPU power switching modes have been relaxed on the latest version of Windows 10. We included the NVMe drives we've tested to date on this build of Windows 10. If you needed a good reason to upgrade to Windows 10 build 14393 this is a good reason.
The Hellfire reads as fast as OCZ's RD400 and writes almost as fast.
Benchmarks (Secondary Volume) – PCMark 8 Extended
Futuremark PCMark 8 Extended
Heavy Workload Model
PCMark 8's consistency test simulates an extended duration heavy workload environment. PCMark 8 has built-in, command line executed storage testing. The PCMark 8 Consistency test measures the performance consistency and the degradation tendency of a storage system.
The Storage test workloads are repeated. Between each repetition, the storage system is bombarded with a usage that causes degraded drive performance. In the first part of the test, the cycle continues until a steady degraded level of performance has been reached. (Steady State)
In the second part, the recovery of the system is tested by allowing the system to idle and measuring the performance after 5-minute long intervals. (Internal drive maintenance: Garbage Collection (GC)) The test reports the performance level at the start, the degraded steady-state, and the recovered state, as well as the number of iterations required to reach the degraded state and the recovered state.
We feel Futuremark's Consistency Test is the best test ever devised to show the true performance of solid state storage in an extended duration heavy workload environment. This test takes on average 13 to 17 hours to complete and writes somewhere between 450GB and 14,000GB of test data depending on the drive. If you want to know what an SSDs steady state performance is going to look like during a heavy workload, this test will show you.
Here's a breakdown of Futuremark's Consistency Test:
Precondition phase:
1. Write to the drive sequentially through up to the reported capacity with random data.
2. Write the drive through a second time (to take care of overprovisioning).
Degradation phase:
1. Run writes of random size between 8*512 and 2048*512 bytes on random offsets for 10 minutes.
2. Run performance test (one pass only).
3. Repeat 1 and 2 for 8 times, and on each pass increase the duration of random writes by 5 minutes.
Steady state phase:
1. Run writes of random size between 8*512 and 2048*512 bytes on random offsets for 50 minutes.
2. Run performance test (one pass only).
3. Repeat 1 and 2 for 5 times.
Recovery phase:
1. Idle for 5 minutes.
2. Run performance test (one pass only).
3. Repeat 1 and 2 for 5 times.
Storage Bandwidth
PCMark 8's Consistency test provides a ton of data output that we use to judge a drive's performance.
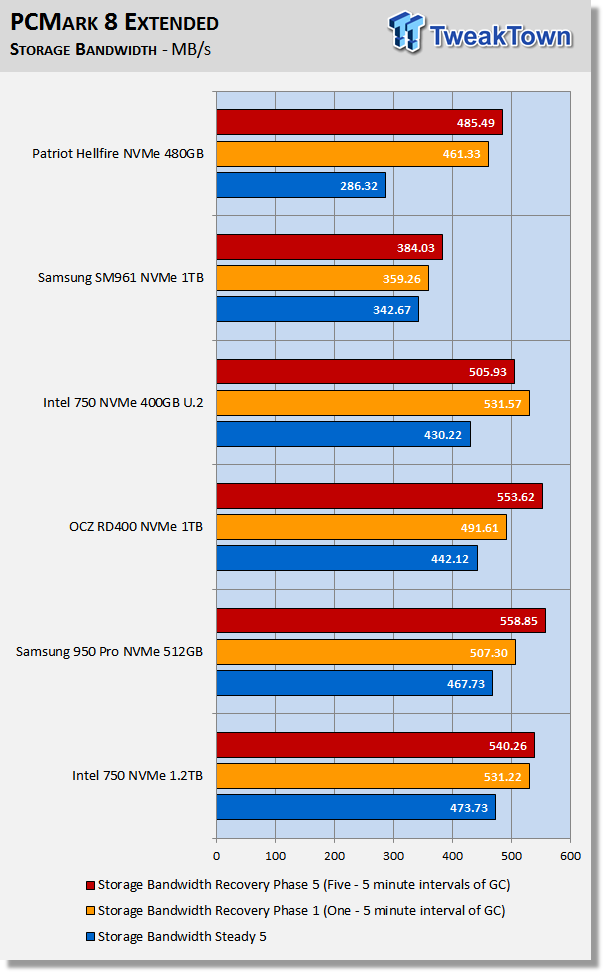
We consider steady state bandwidth (the blue bar) our test that carries the most weight in ranking a drive/arrays heavy workload performance. Performance after Garbage Collection (GC) (the orange and red bars) is what we consider the second most important consideration when ranking a drive's heavy workload performance.
Like we saw with our Vantage steady-state testing, the Hellfire struggles when in a steady-state. The Hellfire does recover nicely after a bit of idle time. The vast majority of users will never hit a steady-state. So, for them, recovery performance is much more indicative of what to expect when running heavy workloads on the Hellfire.
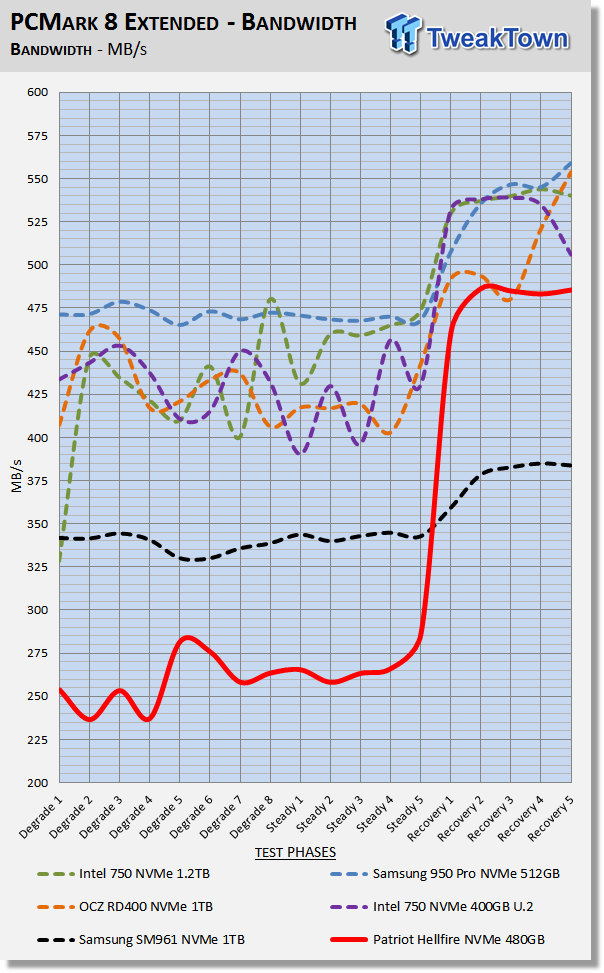
We chart our test subject's storage bandwidth as reported at each of the test's 18 trace iterations. This gives us a good visual perspective of how our test subjects perform as testing progresses. This chart sheds more light on how the drives perform as they progress through the testing phases.
Total Access Time (Latency)
We chart the total time the disk is accessed as reported at each of the test's 18 trace iterations. This helps shed some light on how the drive performs at each of the 18 phases of this test.
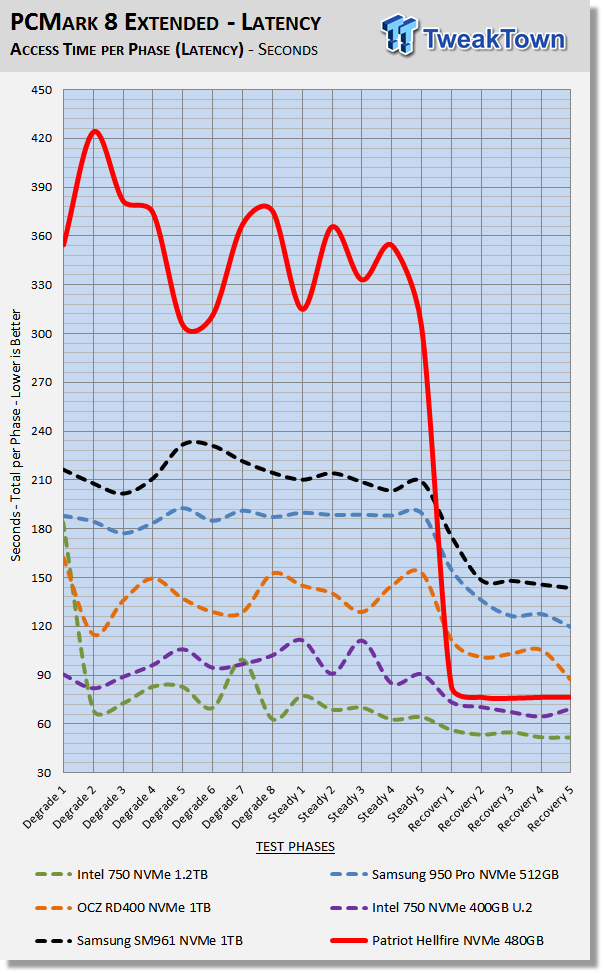
Latency drops dramatically after a bit of idle time. During the recovery phases, the Hellfire has lower (better) latency than the 950 Pro, RD400, and the SM951.
Disk Busy Time
Disk Busy Time is how long the disk is busy working. We chart the total time the disk is working as reported at each of the tests 18 trace iterations.
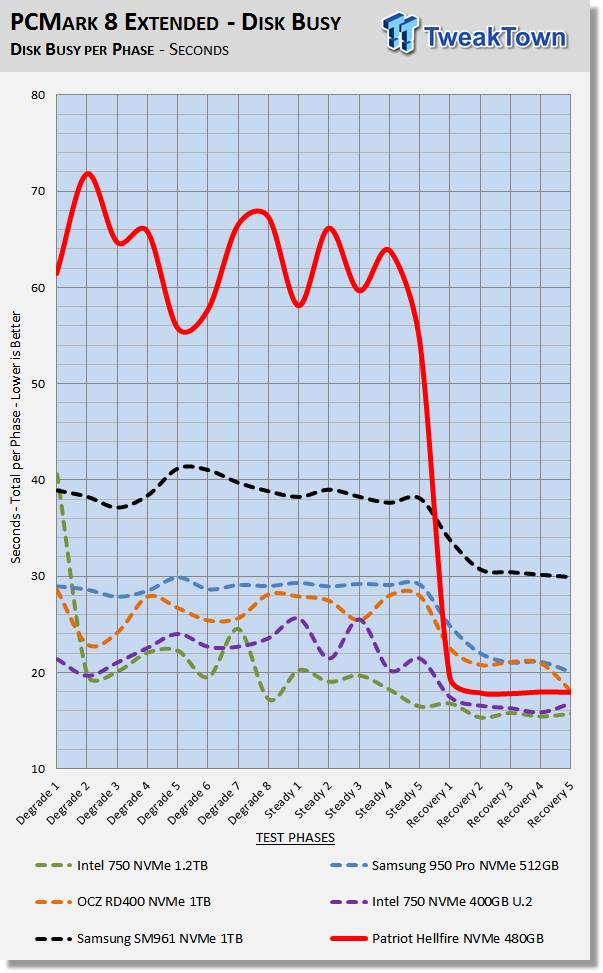
When latency is low, disk busy time is low as well.
Data Written
We measure the total amount of random data that our test drive/array is capable of writing during the degradation phases of the consistency test. Pre-conditioning data is not included in the total. The total combined time that degradation data is written to the drive/array is 470 minutes. This can be very telling. The better a drive/array can process a continuous stream of random data; the more data will be written.
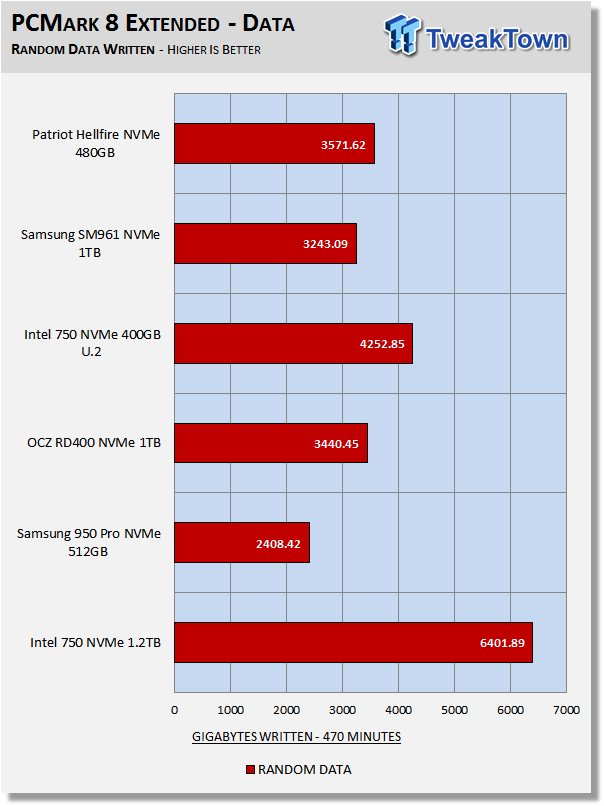
Overprovisioning and write latency are the biggest factors that determine the outcome of this portion of the test. The Intel drives have a healthy dose of overprovisioning which is the reason they dominate this portion of our testing.
The Hellfire doesn't have nearly the amount of overprovisioning as the Intel 750's do, but even a small amount of OP allows it to write more data than the non-overprovisioned drives in our test pool.
Benchmarks (Secondary Volume) – 70/30 Mixed Workload
70/30 Mixed Workload Test (Sledgehammer)
Version and / or Patch Used: Iometer 2014
Heavy Workload Model
This test hammers a drive so hard we've dubbed it "Sledgehammer." Our 70/30 Mixed Workload test is designed to simulate a heavy-duty enthusiast/workstation steady-state environment. We feel that a mix of 70% read/30% write, full random 4K transfers best represents this type of user environment. Our test allows us to see the drive enter into and reach a steady state as the test progresses.
Phase one of the test preconditions the drive for 1 hour with 128K sequential writes. Phase two of the test runs a 70% read/30% write, full random 4K transfer workload on the drive for 1 hour. We log and chart (phase two) IOPS data at 5-second intervals for 1 hour (720 data points). 60 data points = 5 minutes.
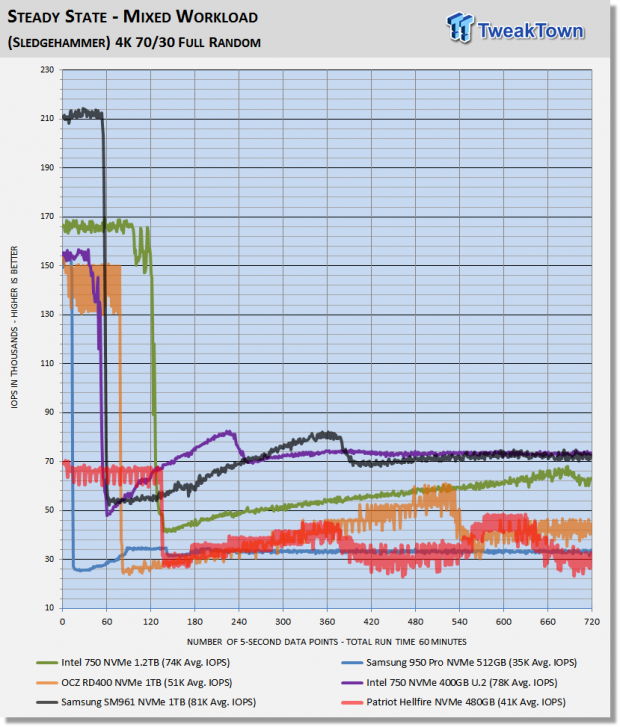
What we like about this test is that it reflects reality. Everything lines up, as it should. Consumer drives don't outperform Enterprise-Class SSDs that were designed for enterprise workloads. Consumer drives based on old technology are not outperforming modern Performance-Class SSDs, etc.
The Hellfire outperforms Samsung's 950 Pro in this brutal test but gets left behind by the other drives in our test pool.
Maxed-Out Performance (MOP)
This testing is just to see what the drive is capable of in an FOB (Fresh Out of Box) state under optimal conditions. We are utilizing empty volumes of Windows 10 and Windows Server 2008 R2 64-bit for this testing.
Windows 10 MOP
Patriot Hellfire 480GB
Windows Server 2008 R2 MOP
Patriot Hellfire 480GB
Final Thoughts
We feel that Patriot has positioned themselves well with the Hellfire. It costs less than a 950 Pro, and it is almost as fast. In some of our benchmarks, the Hellfire even manages to outperform Samsung's 950 Pro. If we compare the Hellfire to Intel's 750 Series SSDs, the Hellfire comes out on top most of the time. The Hellfire delivers better moderate workload performance than Intel's consumer NVMe offerings, which is why we feel the Hellfire is the superior SSD. On top of that, the Hellfire will cost you significantly less money than an Intel 750.
There are a couple of lower-cost NVMe SSDs on the market. They sell for about $70 less than the Hellfire, but what you gain in cost savings is in our opinion negated by lower performance. In fact, Intel's low-cost 600P NVMe SSD is such a poor performing PCIe SSD that top performing SATA SSDs can and do deliver better performance in certain scenarios. We have to look no further than our write transfer test to see that the 600P, although it is cheaper, doesn't deliver performance at a level we would expect to see from an NVMe SSD.
In the end, it all comes down to user experience, and on that front, Patriot's Hellfire delivers the goods. Our user experience while running the Hellfire as our OS disk was simply outstanding. It is noticeably superior to Intel's 750 Series, and every bit as good as what we get from a 950 Pro or OCZ RD400. Take a look at this boot video:
The above video gives you a little taste of what the Hellfire has to offer in terms of user experience. The Hellfire's performance is right, its price is right, and for those reasons, it is TweakTown recommended.
Pros:
- Moderate Workload Performance
- Pricing
- Build Quality
- Most Appealing Form Factor
Cons:
- Heavy Workload Performance
 ASUSTOR Lockerstor 2 Gen2+ AS6702T v2 NAS Review - Fast Performance
 TERRAMASTER D1 SSD Pro Thunderbolt/USB Portable Enclosure Review - Incredible Potential
 Orico K20 Mini 2TB Magnetic Portable SSD Review - Ultra-Thin MagSafe Drive
 TERRAMASTER D4 SSD 4-Bay NVMe DAS Enclosure Review - Superior Portable DAS
 Micron 3610 2TB SSD Review - DRAMless QLC at 11,000 MB/s
 Thermal Grizzly is now selling delidded Intel Core Ultra 7 270K Plus CPUs for enthusiasts
 Rumor: Next-gen Xbox may get disc-to-digital option to convert physical media into virtual games
 Sony expects PlayStation to break new profit records even while it invests in PS6
 PlayStation to deliver 32% returns next year, Sony predicts
 New Xbox cloud and Elite controllers leaked as Microsoft teases cloud-native games, tests free streaming
 Subnautica 2 is a mega hit with 2 million sales in 12 hours
 ASUS enters the memory business and launches its first 'ROG' DDR5 RAM modules
 Popular Chinese retailer JD briefly listed banned RTX 5090 and RTX PRO 6000 Blackwell GPUs
 Security researcher finds zero-day exploit that defeats Windows 11 BitLocker, calls it an insane 'backdoor' discovery
 AMD's FSR 4 coming to RDNA 2 could give the Xbox Series X a PS5 Pro-like upgrade
 PCCooler CPS RZ620M X CPU Cooler Review
 Memblaze PBlaze 7 7A40 Ocean 61.44TB Enterprise SSD Review - Oceans of QLC at 3.3 million IOPS
 MOZA SGP Sequential Sim Racing Shifter Review
 COLORFUL iGame GeForce RTX 5070 Ultra OC Review - When Style and Performance Meet
 GIGABYTE Z890 AORUS Elite WiFi7 Plus Motherboard Review - Right in the sweet spot
 PNY GeForce RTX 5080 Slim OC Review - A Compact 4K Powerhouse
 HP OmniBook 7 (Panther Lake) 16" Laptop Review
 ASUS ROG Strix X870E-E Gaming WiFi7 NEO - A Crosshair by any other name
 Cooler Master Cosmos Alpha Full-Tower Chassis Review
 Thrustmaster T598 Direct Axial Drive Force Feedback Racing Wheel Bundle Review
 Bluetooth Toggle Missing in Windows? Try These Fixes
 GPU Overclocking Basics in Windows 11: Safe Performance Gains Without the Guesswork
 GIGABYTE's new Ultimate OLED Gaming Monitor Bundle includes Xbox Game Pass
 I automated 5 annoying Windows maintenance tasks, and my PC basically runs itself
 How to Fix Windows 11 Black Screen on Boot or After Login
 The first 8 settings I disable on every fresh Windows 11 install in 2026
 Is Your Ethernet Performance Slower Than Wi-Fi? Here's How to Fix It
 MSI's Project Zero Delivers a Stunning Cable-Free Look to More Gamers
 How to Fix "We Couldn't Find a Fingerprint Sensor Compatible With Windows Hello" in Windows 11
 Why Is My Mouse Moving on Its Own? Here's How to Fix It