


At the end of 2016, I knew time was running short for our beloved MacBook Pro. We purchased that MacBook in early 2014 to take on Thunderbolt 2 reviews since Windows support wasn't quite ready. Three years later the battery life was getting abysmal, to the point I had to keep it on AC power most of the day, the original 128GB SSD had died and was replaced and Thunderbolt 2 was no longer the hot new technology.
With that, discussion and research ensued to find a replacement, and at first, I was 100% set on getting the new Kaby Lake MacBook Pro. At launch, Apple had some issues with the touch bar, and the specs for the model I was looking at just weren't that great for the money, so I considered the current Thunderbolt 3 storage solutions and wouldn't you know, Windows has full-fledged support from nearly all vendors.
With vendor support for Windows, our options grew to include the Alienware 15 R3. After doing some research, I found the Kaby Lake models were fixed to take care of heat issues found in the Skylake models of 2016, and so I ordered our new test system and thanks to Corsair upgraded the memory, the system is spec'd out as below.
- Intel Core i5 7300HQ
- 16GB Corsair Vengeance DDR4 3000
- NVIDIA GeForce GTX 1060 6GB
- MyDigitalSSD BPX 480GB SSD
- Samsung 960 EVO 250GB SSD
This article will look at the storage performance of the Alienware 15 R3, internal and external. The drives we are using for this purpose include the BPX NVMe SSD from MyDigitalSSD in m.2 Slot 0 and the Samsung 960 EVO NVMe in m.2 Slot 1. The Intel 730 480GB SATA SSD will test the 2.5" drive performance along with USB-C and USB 3.0 while the LaCie Bolt3 will take on Thunderbolt 3.
Benchmarks handle performance differently as well. Anvils has long been a storage performance staple when it comes to storage, so we will pair that with CrystalDiskMark and one of my new favorites, Flash Bench to test the overall performance of each storage medium.
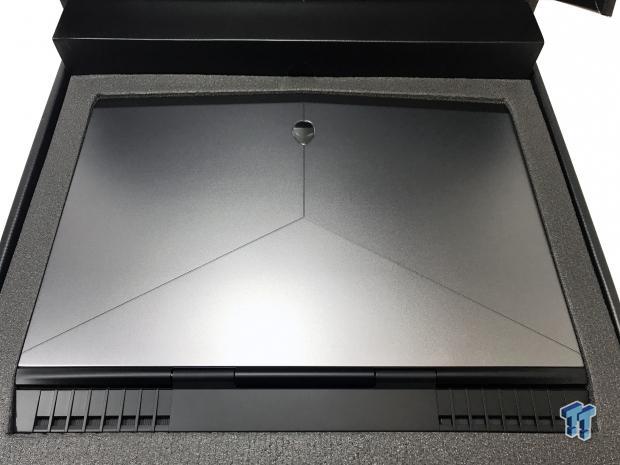
First, we dive in to get an overview of all the connectivity options of the Alienware 15 R3. Unboxing this unit, it's quite a bit heavier than our old MacBook Pro. It has a black and gunmetal gray color scheme, with the Alienware logo on the top. The edges of the panel and base have LED bars with full RGB support.
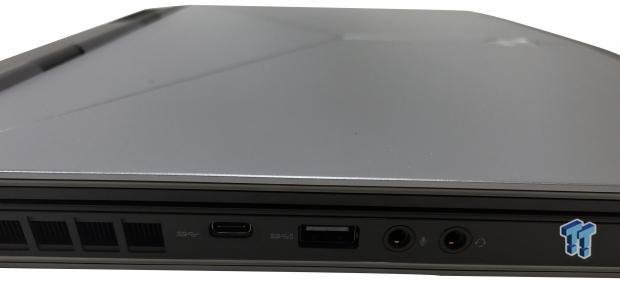
Starting on the left side of the notebook, we find USB 3.0 along with the USB-C port.
Our Latest Editorials Article Coverage
- Building the Ultimate Home Entertainment Server with an ASUSTOR NAS and Viper Gaming NVMe SSDs
- PS5, Xbox Scarlett SSD may use Optane-like ReRAM to supercharge speeds
- Investigation: m.2 Heatsinks, are they worth it?
- Thunderbolt 3 Cable Roundup: Do they differ?
- Intel Optane Memory: What It Is and Why It Matters
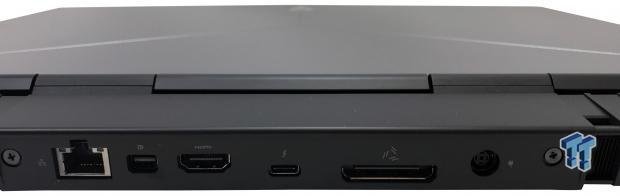
The backside houses gigabit LAN to the far left with DisplayPort and HDMI functionality next to it. The Thunderbolt 3 port is centered and followed by the Graphics Amplifier port and power input.
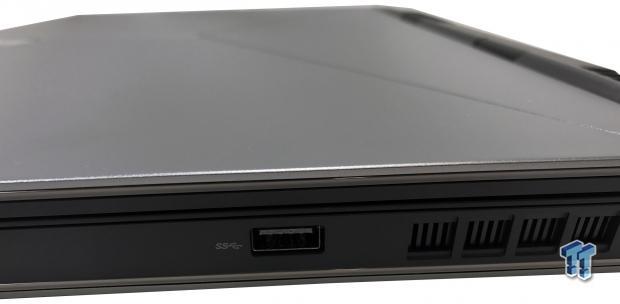
The right side houses a single USB 3.0 port.
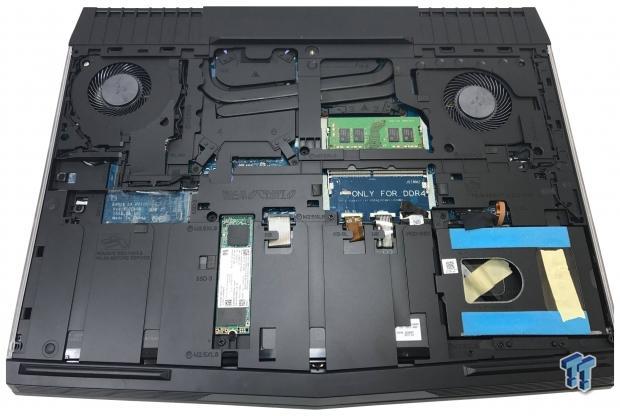
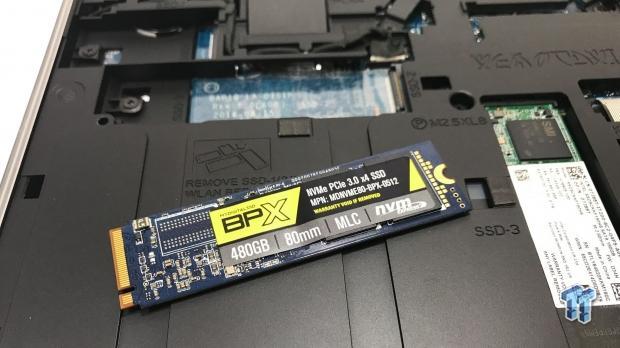
Internally, the system has three m.2 slots. Two are 2280 capable while the third is 2240. The bottom right is where the 2.5" drive caddy resides.
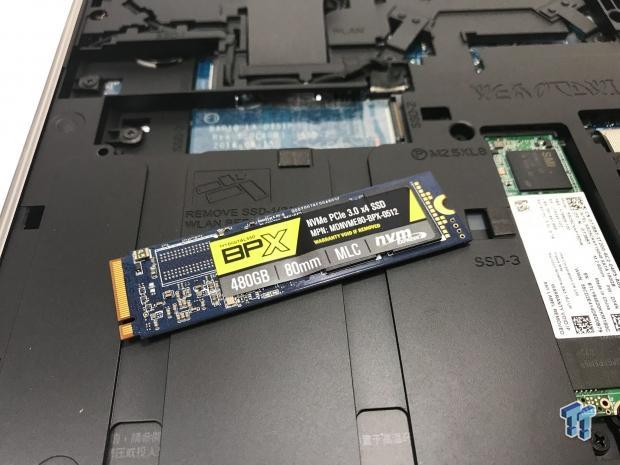
Above, we are ready to install our BPX in SSD-3. The Samsung 960 EVO is in SSD-2 above the BPX.
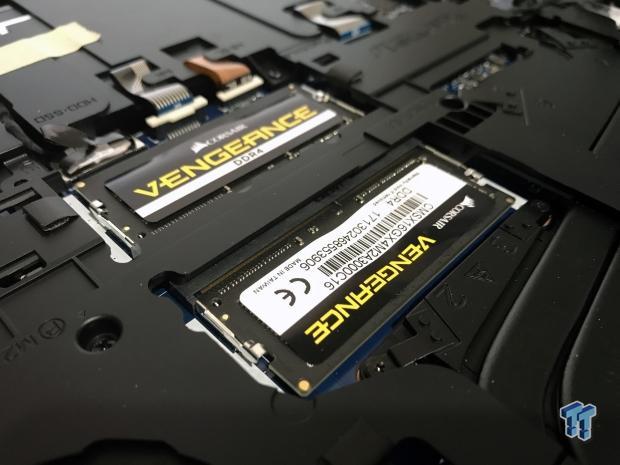
Of course, no system would be complete without a killer set of memory. Thanks to Corsair we were able to outfit this system with a 16GB kit of Vengeance DDR4 3000 sticks.
NVMe Storage Performance
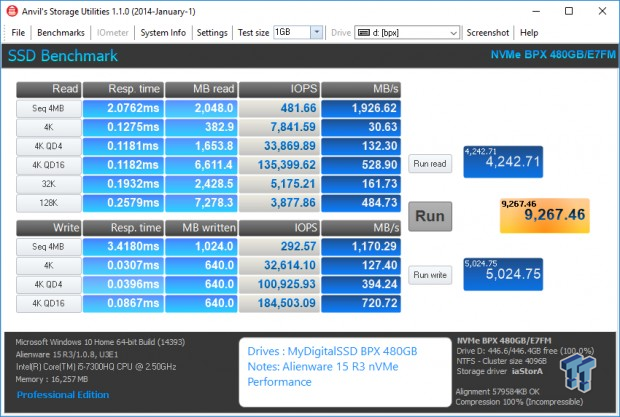
Starting off our performance tests, we take a look at the NVMe BPX from MyDigitalSSD. Anvils gives it a score of 9267 as a secondary drive reaching 1926 MB/s read and 1170 MB/s write.
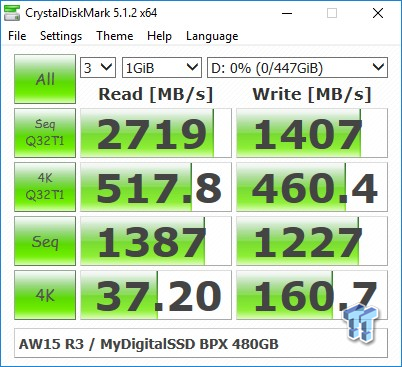
Scooting over to CDM, we find the BPX reaching 2719 MB/s read and 1407 MB/s write in sequential QD32 while 4K QD1 sits at 37.2 MB/s or roughly 9500 read IOPS. Write came in at 160 MB/s or around 41K IOPS.
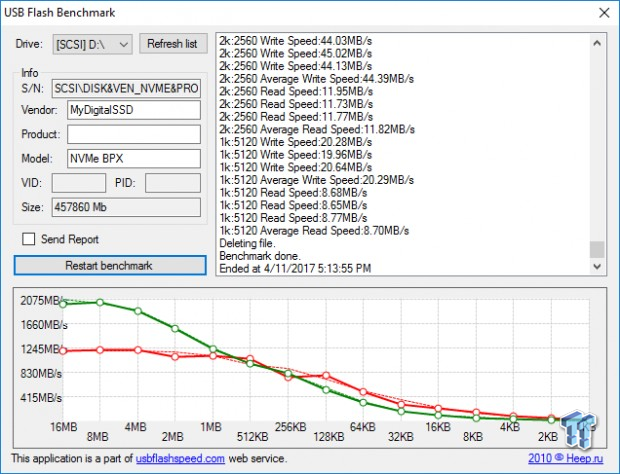
Over to flash bench, performance starts out at 2075 MB/s at 16M holds through 8M and then starts to taper off. Write performance, on the other hand, starts at 1245 MB/s and holds through 512K before it slowly tapers.

Starting over with the Samsung 960 EVO, Anvils gives it a score of 10449 with the Samsung NVMe driver installed. The sequential performance hit 1956 MB/s read and 1024 MB/s write, about the same as the BPX.
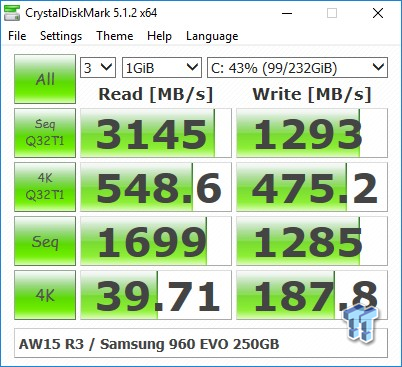
CDM showed much higher sequential performance on our EVO. 3145 MB/s read and 1293 MB/s write. 4KQD1 was near 40 MB/s read and 187 MB/s write.
Above, we have two runs through flash bench for the EVO. As you can see, sequential started near 2175 MB/s read and tapered quickly. Write performance is more linear starting around 1100 MB/s and holding that through 1M.
Thunderbolt 3 Storage Performance
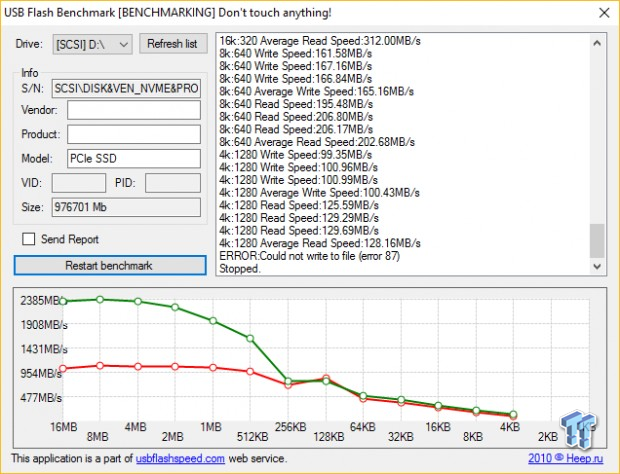
Thunderbolt 3 performance can be summed up with just one image. I used the LaCie Bolt 3 before I sent it back to Seagate for this and as you can see I was reaching 2400 MB/s read and a touch over 1000 Mb/s write. Theoretically, Thunderbolt 3 should be able to reach ~4.6GB/s, so we will certainly be on the lookout for which vendor goes after the performance crown first.
SATA 6Gb/s Storage Performance

Back at it, the Alienware 15 R3 uses the CM236 chipset, so things like USB 3.0 and SATA 6Gb/s are native in the chipset. Using the Intel 730, we look at SATA performance for the AW15 and notice it's certainly on par. 496 MB/s read and 455 MB/s write and a score of 4413 in Anvils.
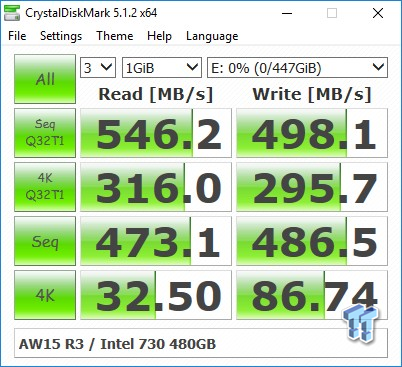
CDM gives slightly higher results of 546 MB/s read and 498 MB/s write. 4KQD1 comes in at 32 MB/s read and 86 MB/s write or 8000 read IOPS and 22K write IOPS.
Flash bench shows strong performance for our 730 holding steady at 505 MB/s read and 496 MB/s write.
USB Storage Performance
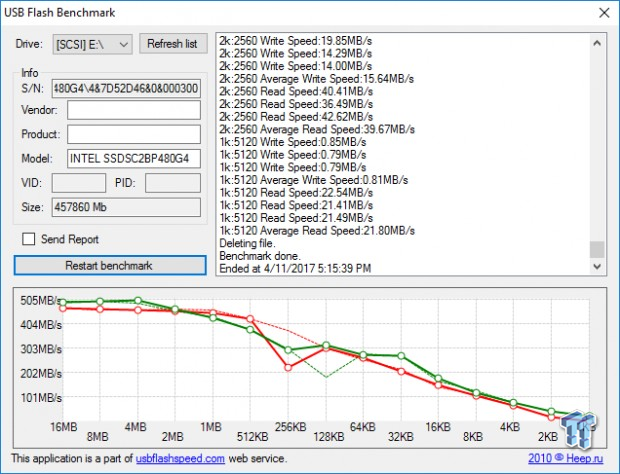
USB performance for the AW15 lets us use the USB-C port on the left side. Internally, this isn't a 10Gbps port but rather a gen 1 with a fancy connector. Often newer USB-C devices, even if they use the same drive, will have higher performance due to the better enclosure chipset. For this test, I used the Plugable USB-C Dock that's coming up for review very soon. This dock utilizes the ASMedia 1351 USB 3.1 to SATA bridge.
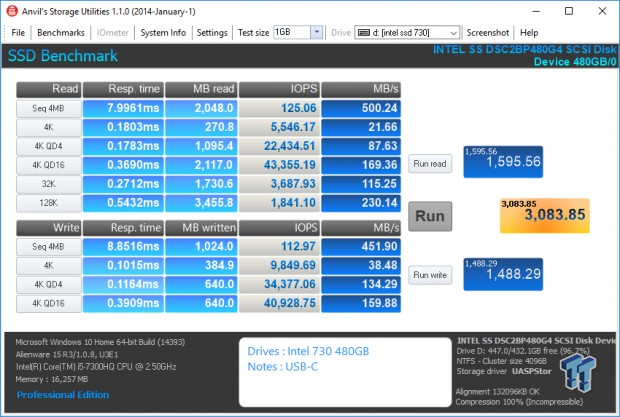
Performance starts off with Anvils giving our Intel 730 a score of 3083, 1200 points lower than SATA 6Gbps.
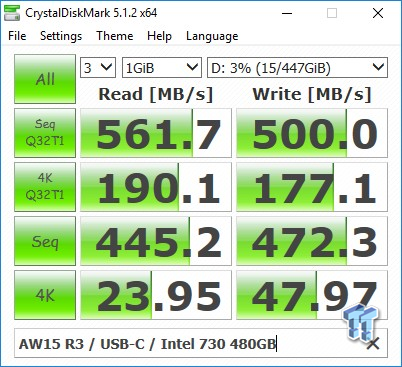
CDM performance was higher over USB-C in Sequential read and write. 4KQD1 suffered slightly compared to SATA, bringing in about half the performance.
Flash bench showed smooth performance both read and write. We start high at 490 - 500MB/s and cost slowly down to 400 MB/s at 256K.
Final Thoughts
All in I paid around $1100 for this notebook thanks to sales and reward points I had saved. The base configuration for this model comes in at $1199.99, that's with a 180GB SATA m.2 and a single 8GB stick of DDR4 and GTX 1050 Ti, boosting to the GTX 1060 6GB, brings the MSRP to $1349.99. I should mention this does come stock with an NVIDIA G-Sync display, Tobii eye tracking, and a full array of RGB lighting.
As far as I/O is concerned, I find it lacking, to be honest. I use this mainly on my couch with a LapDesk XXL and Logitech G403. That leaves me with the mouse plugged in on the left side in the Type-C port, leaving the USB-C on the left side and a secondary Type-C on the right. The secondary Type-C is too close to the mouse and its movement to use with any full-size device, especially flash drives or devices with long cords. The ideal application would be to find a wireless mouse with a low-profile USB adapter, or optionally find a Thunderbolt 3 dock suitable to your needs.
Getting down to the performance, the AW15 is stacked. With a possible three m.2 and one SATA, there is potential for high capacity / very quick storage. In my tests, I had both the m.2 2280 slots filled and found no performance loss in this configuration. As you saw from the benchmarks above, the AW15 allowed the BPX to push 2700 MB/s read and 1400 MB/s write and 33K Write IOPS. One thing of note and a few of you have asked me about this, utilities like CDI and other smart monitors will show the BPX having temps sometimes over 60c, and in my case, ran at 63c for a long period.
I talked to MyDigitalSSD and came away with this quote: "Not to worry, our drive definitely runs hot, but the main reason for that is because we put the heat sensor on the controller itself whereas our competition put the sensor further away on the PCB. You will not need to worry unless the drive breaks the 120c mark." The 960 EVO performed remarkably well too, reaching 3100 MB/s read and 1300 MB/s write in sequential tests. 4K performance was near 10K IOPOs read and 37K write QD1.
USB 3.1 and SATA were both up to the task with SATA providing 560 MB/s read and 500 MB/s write with our Intel 730. That same SSD carried its performance over to USB 3.1 in the Alienware 15 R3 reaching 561 MB/s read and 500 MB/s write. 4KQD1 was a bit lower over USB 3.1 than SATA but both performed quite well.
The Alienware 15 R3 offers a solid amount of value in its base configuration. I find the three m.2 slots and Thunderbolt 3 connectivity the most useful for my purposes and you can certainly look forward to Thunderbolt 3 reviews coming to you very soon using this notebook.
 Samsung 990 2TB SSD Review - Ninth Gen QLC at PCIe Gen4 Speeds
 HighPoint Rocket 1604L Gen5 x16 NVMe Software RAID AIC Review: half the price with full 59 GB/s speed
 UGREEN NASync DXP4800 GT Review: powerful 4-bay NAS with AMD Ryzen and dual 10GbE ports
 Phison E37T SSD Controller Exclusive Preview - The Fastest DRAMless SSD Platform Yet
 Seagate FireCuda X1070 4TB SSD Review - A New Mainstream Contender
 Xbox outage turns ugly as players use Xbox App glitch to download and play titles for free
 Xbox servers go down just days after PlayStation outage, giving us a glimpse into our digital-only future
 Xbox Series X survives a devastating house fire and still works!
 'PS5 is currently the Call of Duty box,' analyst says after Black Ops II re-release takes over PlayStation
 Colorful and MSI RTX 50 graphics card prices spike in China as GDDR6 and GDDR7 memory costs rise
 SEGA won't abandon its physical culture, but stresses importance of digital for sales growth
 PC classic Myst returns with mysterious new Project Mudfish
 Minecraft now recommends 16GB of RAM and a much newer CPU
 007 First Light ditches Denuvo DRM just as first patch arrives packing a ton of bug fixes and some new content
 Microsoft's still working on Windows 11 File Explorer improvements, and it's now making deleting large files speedier
 Logitech G512 X 98 Analog Mechanical Gaming Keyboard Review - An Innovative Two-in-One
 Thrustmaster T.Flight HOTAS 5 MSFS Edition Review
 SteelSeries Arctis Nova Pro Omni Wireless Headset Review - One Headset to Rule Them All
 SteelSeries Arctis Nova 7 Wireless Gen 2 Headset Review - New and Improved, But Is It Enough?
 AMD Ryzen 7 7700X3D Review - Days of Future Past
 ASUS ExpertBook Ultra (Panther Lake) 14" Business Laptop Review
 ASUS ROG Raikiri II Xbox Wireless Controller Review - Ready to Take Control
 MOZA FMP18 Panel Bundle Review: authentic F/A-18 Hornet cockpit controls for flight sims
 Micron 6600 ION 245.76TB Enterprise SSD Review - Best in Class Programming Speeds
 Printer Not Working in Windows? How to fix detection, print queues and drivers
 The Ultimate Guide to Personalizing Your Windows 11 Taskbar
 How to Turn Your Windows Laptop Into a Second Monitor with Miracast and Wireless Display in Minutes
 6 Mistakes to Avoid When Buying a Windows Laptop
 I capped Windows Update's bandwidth with Delivery Optimization, and my downloads stopped choking
 I use this decade-old free tool that finds files faster than Windows Search does
 I install and update most of my apps with this Windows command now, and I stopped downloading sketchy installers
 Hisense U6SF 65-inch MiniLED TV: High Performance Meets Leisurely Convenience
 I stopped digging through Windows menus after I set up this one folder
 Don't sell your Windows laptop until you do these things