


Our Verdict
Introduction, Specifications, Pricing & Availability
As a brand, OCZ no longer exists. Toshiba states that going forward their retail SSDs will be sold under the Toshiba brand name, while OCZ will be a sub-series. They further state that all Toshiba retail SSDs will have OCZ performance "DNA" and target the enthusiast and gaming market which includes entry-level DIY system builders and first-time upgraders from HDDs under the same umbrella.
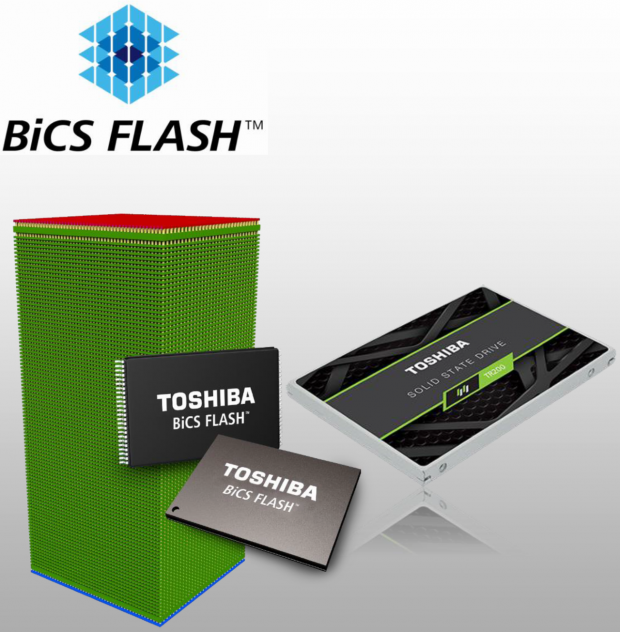
BiCS is what Toshiba calls their vertically stacked three-dimensional (3D) flash memory. BiCS flash, has far higher die area density compared to two-dimensional (planar) NAND flash memory. This is because with 3D memory technology, NAND flash strings run vertically. Think of 3D NAND flash as a skyscraper building and planar flash as a single-story building. Both can have the same footprint, but the skyscraper can have hundreds of times more floor space depending on how many floors, or layers in the case of 3D NAND, are used.
Popular Now: Diablo 4's next season is bringing back iconic items from Diablo 2 and 33D NAND flash has many inherent advantages over 2D (planar) flash that go beyond density alone. 3D NAND flash can be programmed faster than 2D can. Spaces between memory cells on 3D flash are far wider than in 2D NAND flash memory. This makes it possible to improve the programming speed and at the same time reduce power consumption by increasing the amount of data for a single programming sequence. The wider open spaces between cells also decreases cell coupling providing greater reliability and endurance in comparison to 2D NAND flash memory.
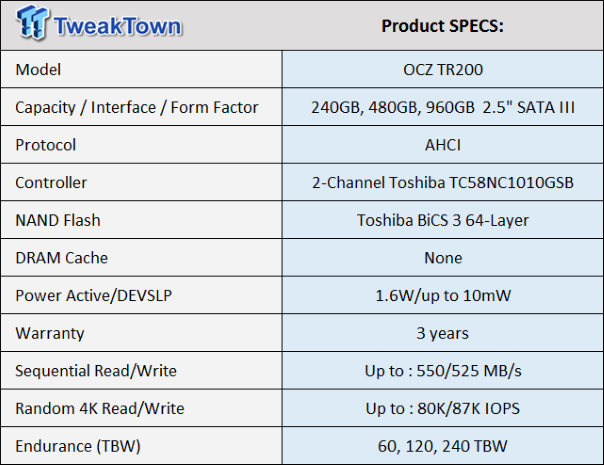
The TR200 pairs Toshiba's 2-channel TC58 controller with a third generation Toshiba BiCS 3D flash array. BiCS 3D flash will only come in TLC (3-bit) or QLC (4-bit) flavors, there will be no MLC (2-bit) variants. Toshiba is confident that the performance and endurance offered by BiCS 3 is at minimum on par with planar MLC flash. Just as we no longer see new retail SLC flash products brought to market, the day is coming sooner rather than later where we may no longer see new MLC flash products hitting store shelves.
Third generation BiCS (BiCS 3) 3D TLC flash products are starting to enter the mainstream market. Toshiba's 64-Layer BiCS 3 TLC flash technology is well refined and set to shake up the market by offering better endurance, higher density, and higher performance TLC flash than is possible from conventional planar (2D) TLC flash technology. Toshiba states that BiCS is the superior flash technology for the following reasons:
- Higher Capacity: Vertically stacked cell structure enables higher capacity in the same footprint.
- Higher Endurance: Charge trap cell & memory hole structure increase endurance.
- Higher Performance: Faster programming speed with 1-shot program called "Full Sequence". Triple pages can be programed simultaneously with fewer steps.
- Higher Power Efficiency: Triple pages can be programed with almost the same power consumption of a single page program.
So far, we've seen BiCS 3 64-Layer 3D TLC flash featured on two enthusiast level SATA SSDs coming from Toshiba's flash partner Western Digital, as well as Toshiba's own blazing fast XG5 OEM client NVMe SSD. Now, Toshiba has their sights set on penetrating the SATA DIY upgrade value segment with BiCS 3. The Toshiba OCZ TR200 Series we are looking at today is the first Toshiba retail upgrade SSD shipping with 64-Layer 3-bit-per-cell TLC (triple-level cell) BiCS 3D flash.
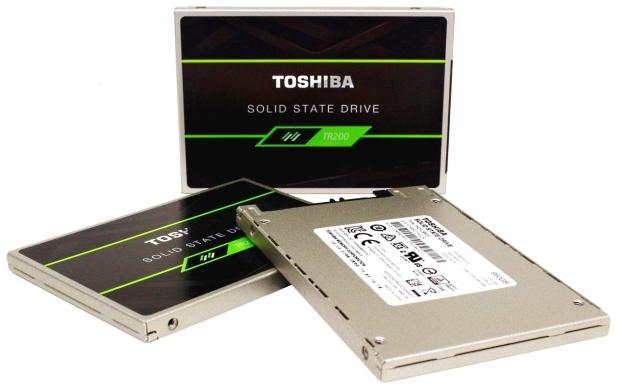
The TR200 will be the only SATA-based retail product released by Toshiba for the remainder of 2017. It is targeted at entry-level DIY system builders and first-time upgraders from HDDs. The drive focuses on outstanding price/performance for value-oriented consumers. It is designed to offer both lower power and cost savings to customers without expensive and power-consuming DRAM. We will add that the TR200 is one of the best looking SSDs we've ever seen. The green on black color scheme is definitely eye-catching. Our photos don't do it justice.
Our Latest SSD Review Coverage
- Biwin M560 2TB SSD Review - Best Overall Retail-Ready DRAMless SSD
- Samsung 990 2TB SSD Review - Ninth Gen QLC at PCIe Gen4 Speeds
- Phison E37T SSD Controller Exclusive Preview - The Fastest DRAMless SSD Platform Yet
- Seagate FireCuda X1070 4TB SSD Review - A New Mainstream Contender
- Micron 3610 2TB SSD Review - DRAMless QLC at 11,000 MB/s
DRAMless SSDs are a coming trend because production costs are reduced, and the savings can be passed on to the consumer through lower pricing. DRAMless SSDs are a bit of give and take though. Production costs are lower, and DRAMless SSDs also consume less power which is advantageous in a mobile environment, but there is a tradeoff because performance is lower as well.
Factory Specifications
Features include:
- MTTF: 1.5 Million Hours
- DEVSLP
- ECC
- SMART
- TRIM
- Garbage Collection
- Software: OCZ SSD Utility
MSRP: 240GB = $89.99, 480GB = $149.99, 960GB = $289.99
If these prices seem a bit on the high side for DRAMless SSDs, actually they are not. The impact that the current NAND shortage is having on SSD production costs is getting more extreme with each passing day.
Availability: The TR200 will hit retail channels this month.
The TR200 is only available as a 2.5" form factor SSD. Looking at the factory specs provided to us, we see that performance is similar at all capacity points. We expect that the higher capacities will have slightly lower performance than the 240GB model because of the nature of DRAMless SSDs. The TR200 pairs Toshiba's 2-channel TC58 controller with a BiCS 3 flash array. The TR200 employs TSOP packaged BiCS 3 flash packages which we've not seen until now.
Drive Details
Toshiba OCZ TR200 SATA III SSDs
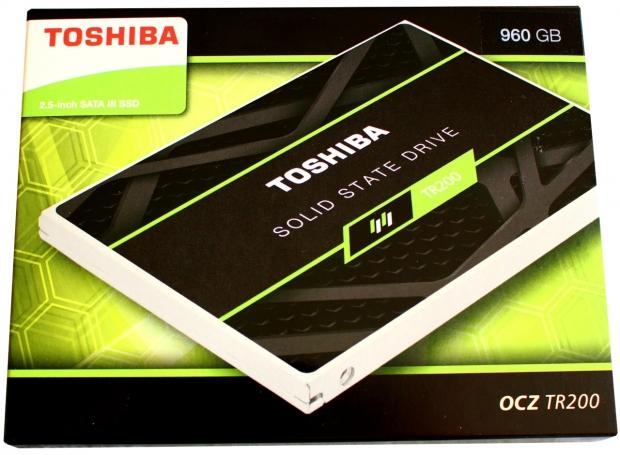
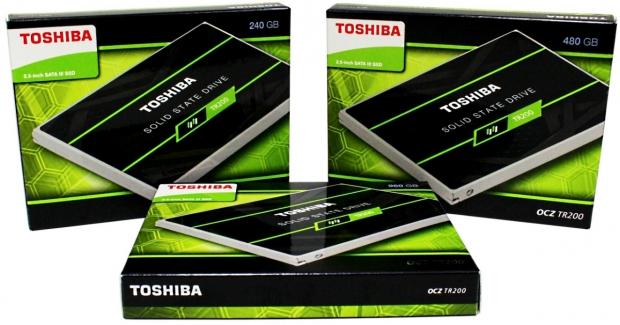
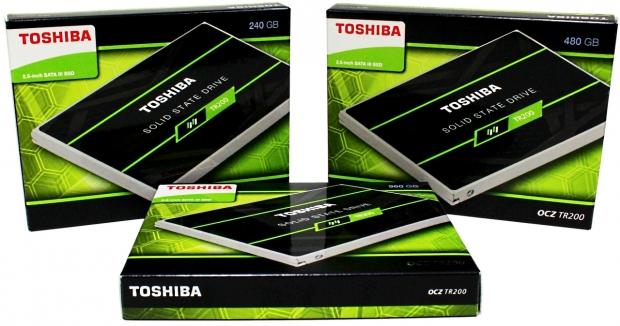
The TR200 ships in handsomely decorated green and black themed packaging. The front of the packaging has an image of the enclosed SSD. The enclosed drive's capacity is listed on the upper right corner.
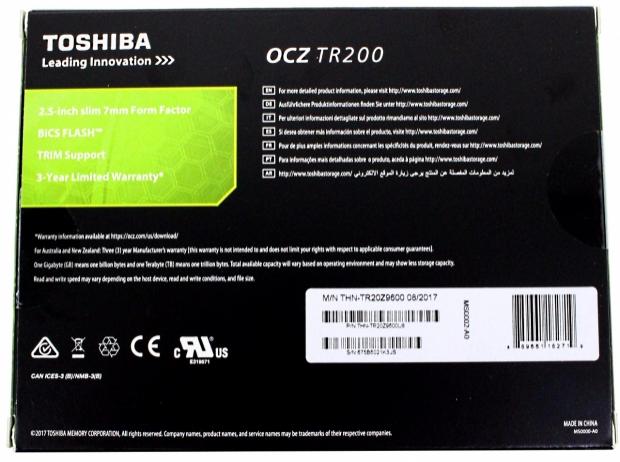
The rear of the TR200's packaging advertises the drives slim 2.5" x 7mm form factor, BiCS flash array, TRIM support, and 3-year limited warranty.
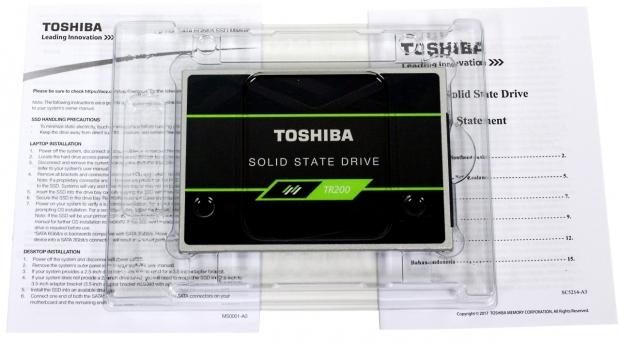
Included with the drive are two printed guides.
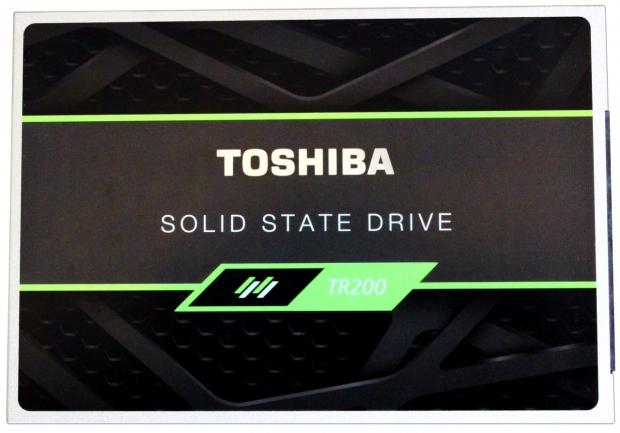
The top half of the drives sheet aluminum enclosure is covered with a very attractive green and black themed label.
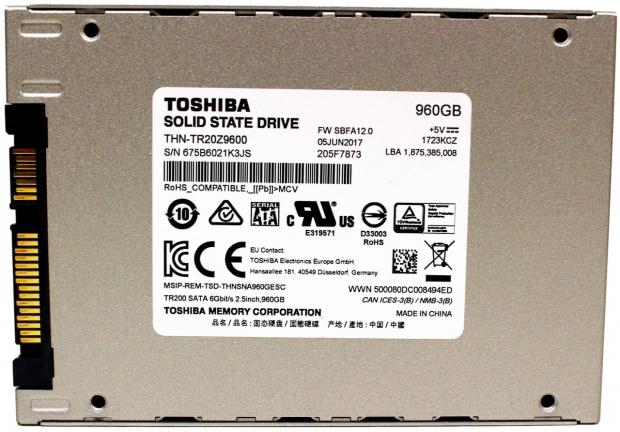
The bottom half of the drives snap together enclosure is also formed from sheet aluminum. There is a manufacturers' label that lists the particulars of the SSD.
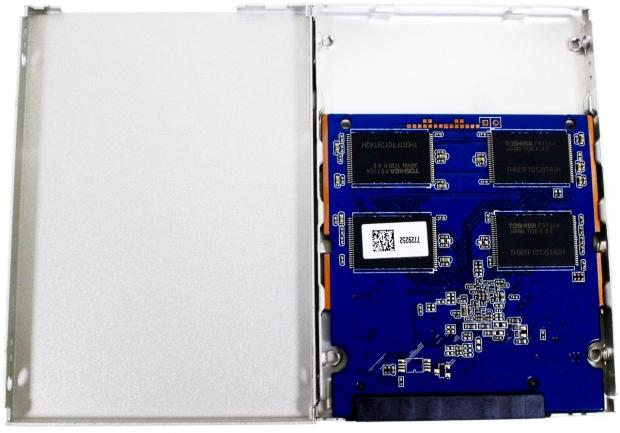
Popping the drive's enclosure open reveals a 3/4 length PCB that snaps into place.
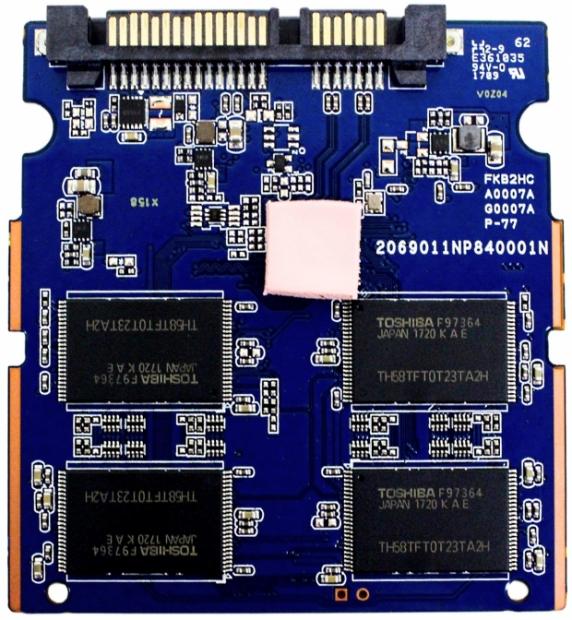
This side of the PCB is populated with four BiCS 3 TSOP flash packages and its controller. The controller has a thermal pad mounted on it to wick heat into the enclosure.
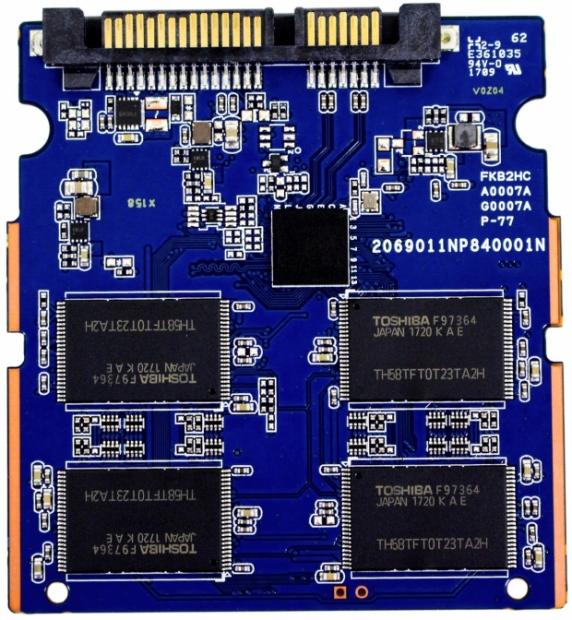
Removing the thermal pad reveals the drive's tiny 2-channel controller.
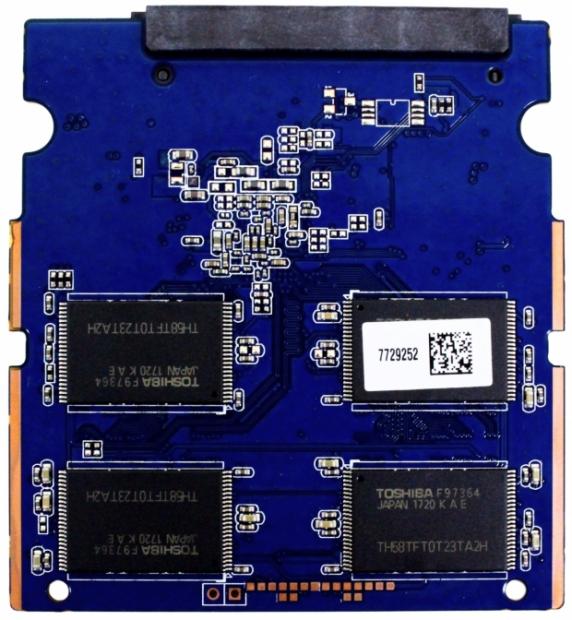
This side of the PCB is populated with an additional four flash packages.
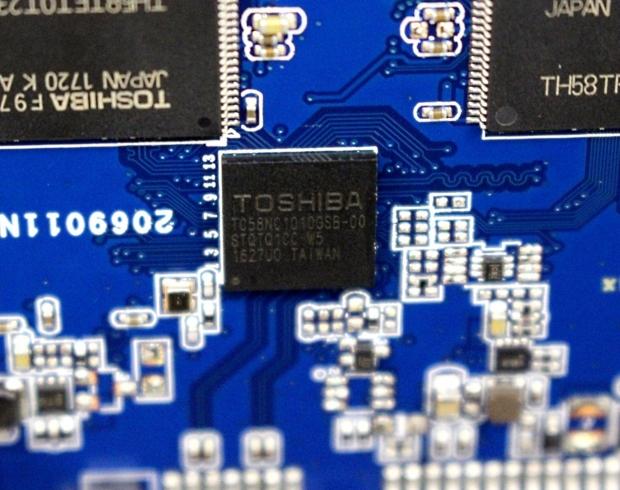
A close-in view of the drive's 2-channel Toshiba TC58NC1010GSB controller.
Test System Setup and Properties
Jon's Consumer SSD Review Test System Specifications
- Motherboard: ASRock Extreme9 Z97 - Buy from Amazon
- CPU: Intel Core i7 4790K @ 4.8GHz - Buy from Amazon / Read our review
- Cooler: Swiftech H2O-320 Edge - Buy from Amazon / Read our review
- Memory: Corsair Dominator DDR3 32GB 2400MHz - Buy from Amazon
- Video Card: Onboard Video
- Case: IN WIN X-Frame - Buy from Amazon / Read our review
- Power Supply: Seasonic Platinum 1000 Watt Modular - Buy from Amazon / Read our review
- OS: Microsoft Windows 10 Professional 64-bit - Buy from Amazon
- Drivers: Intel RAID option ROM version 13.0.0.2075 and Intel RST driver version 14.8.0.1042
We would like to thank ASRock, Crucial, Intel, Corsair, RamCity, IN WIN, and Seasonic for making our test system possible.
Drive Properties & Software
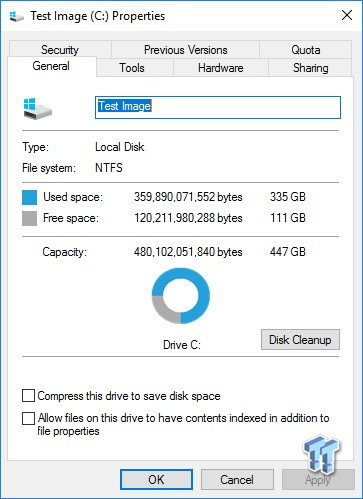
OCZ TR200 960GB OS Disk 75% Full

OCZ TR200 480GB OS Disk 75% Full
OCZ TR200 240GB OS Disk 75% Full
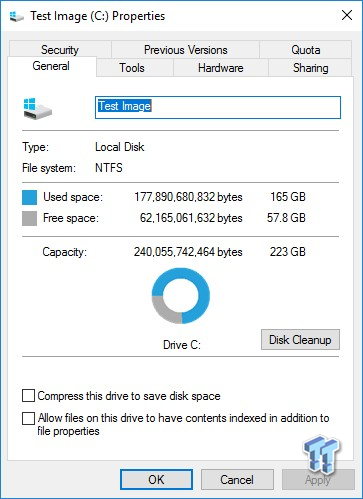
The majority of our testing is performed with our test drive as our boot volume. Our boot volume is 75% full for all OS Disk "C" drive testing to replicate a typical consumer OS volume implementation. We feel that most of you will be utilizing your SSDs for your boot volume and that presenting you with results from an OS volume is more relevant than presenting you with empty secondary volume results. We are utilizing Windows 10 Pro 64-bit OS for all of our testing. Empty Windows 10 benchmark screenshots are shown on our MOP (Maxed-Out Performance) page.
System settings: Cstates and Speed Stepping are both disabled in our systems BIOS. Windows High-Performance power plan is enabled. Windows write caching is enabled, and Windows buffer flushing is disabled.
Please note: When comparing our results to those of other review sites, look at page 10 Maxed Out Performance-Windows 10 which is done with the disk empty.
We will be presenting benchmark screenshots of the 960GB model and the 480GB model. The 960GB will be shown first followed by the 480GB model. All three capacities will be shown on our charts.
OCZ SSD Utility
The TR200 is fully compatible with OCZ's SSD Utility. The utility makes drive maintenance and monitoring simple and easy to understand.
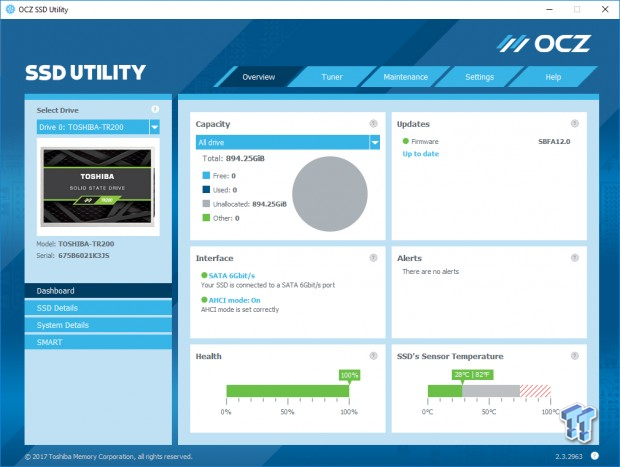
The overview tab tells us what firmware is on the drive, the drive's temperature, health, interface and will alert us if there are any issues.
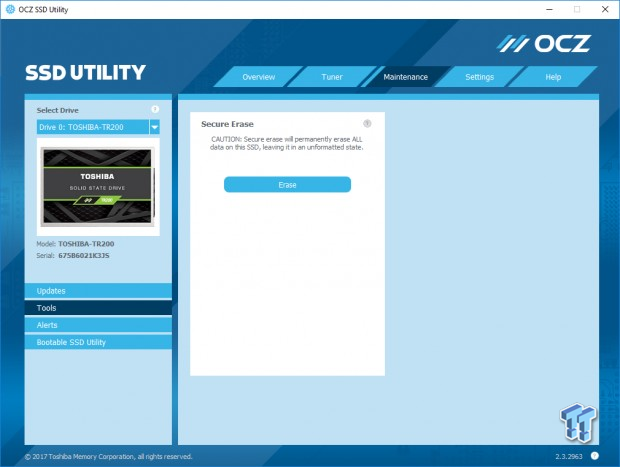
The drive can be secure erased using the utility.
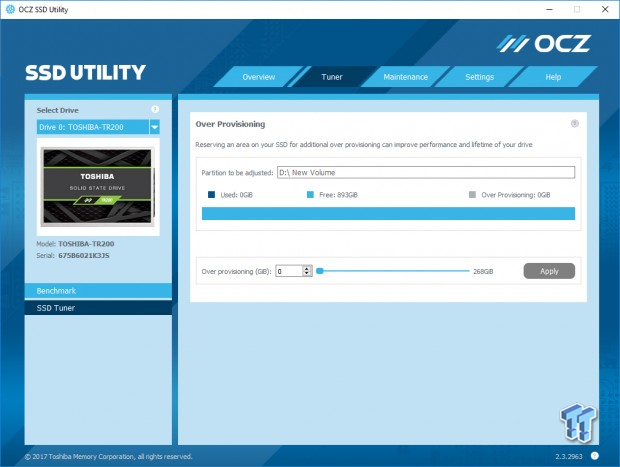
You can overprovision the drive easily using this tool.
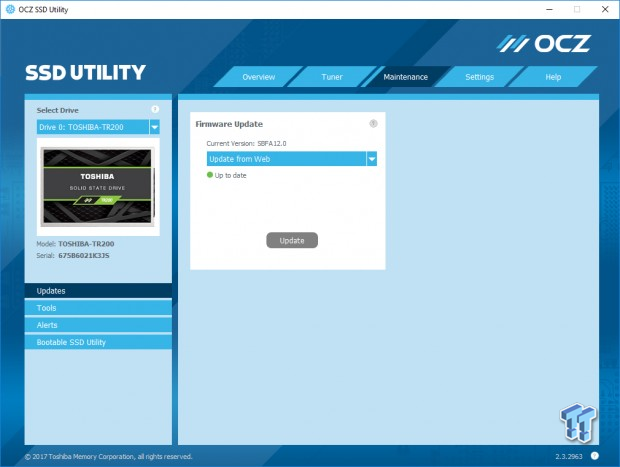
You can easily update the drive's firmware with a couple of clicks.
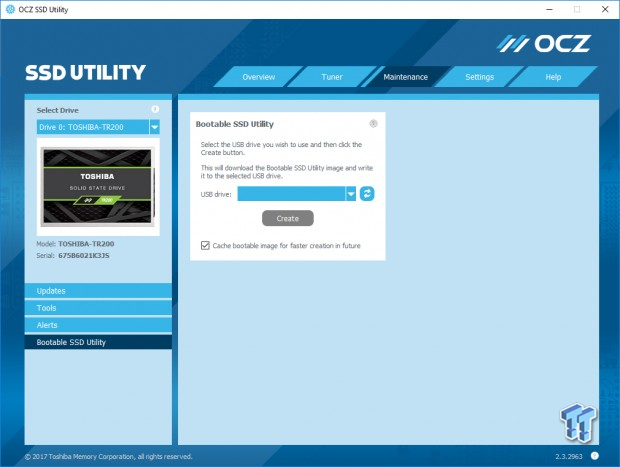
You can create a bootable version of the OCZ SSD utility here.
Synthetic Benchmarks – ATTO & Anvil's
ATTO
Version and / or Patch Used: 2.47
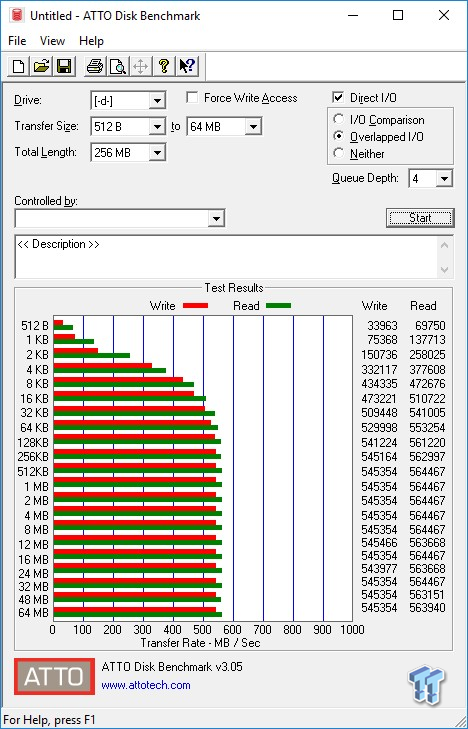
ATTO is a timeless benchmark used to provide manufacturers with data used for marketing storage products. With ATTO, we are looking at maximum sequential performance with compressible data as well as the performance curve.
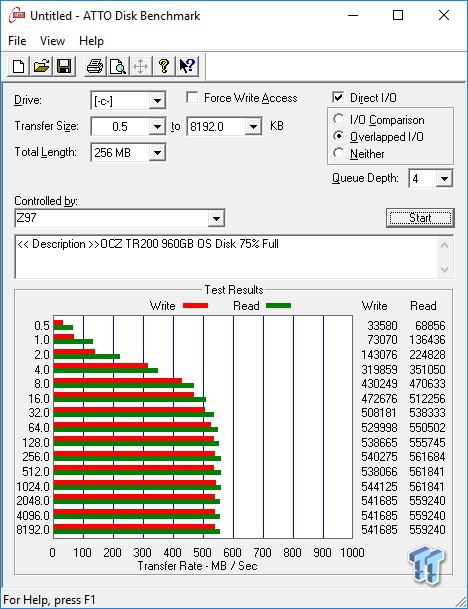

Compressible sequential read/write transfers max out at 563/542 MB/s. Both figures exceed factory specs. Keep in mind this is our OS volume, and it is filled to 75% of its total capacity.
Sequential Write
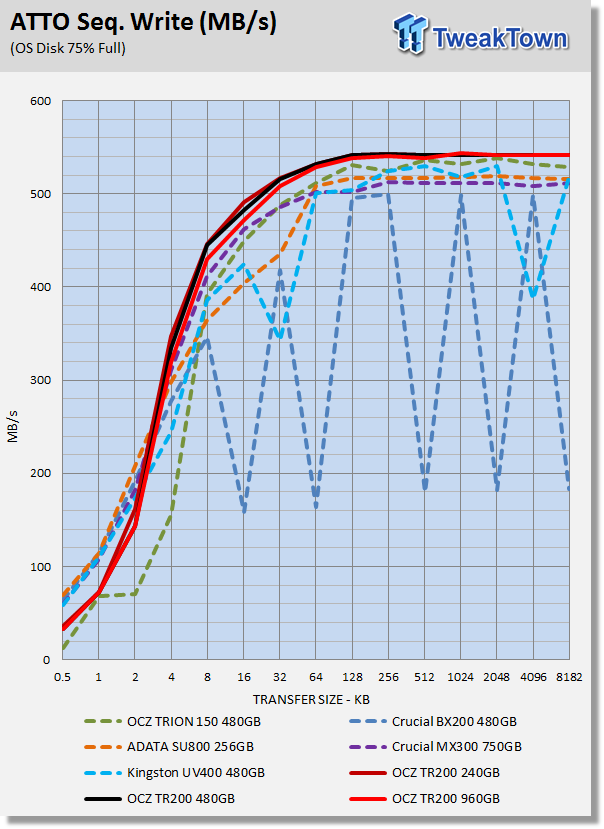
All three capacity points deliver similar performance. The performance curve is nice and smooth which is what we are looking for. All three capacities deliver outstanding sequential performance that is a cut above the other SSDs in our test pool.
Sequential Read
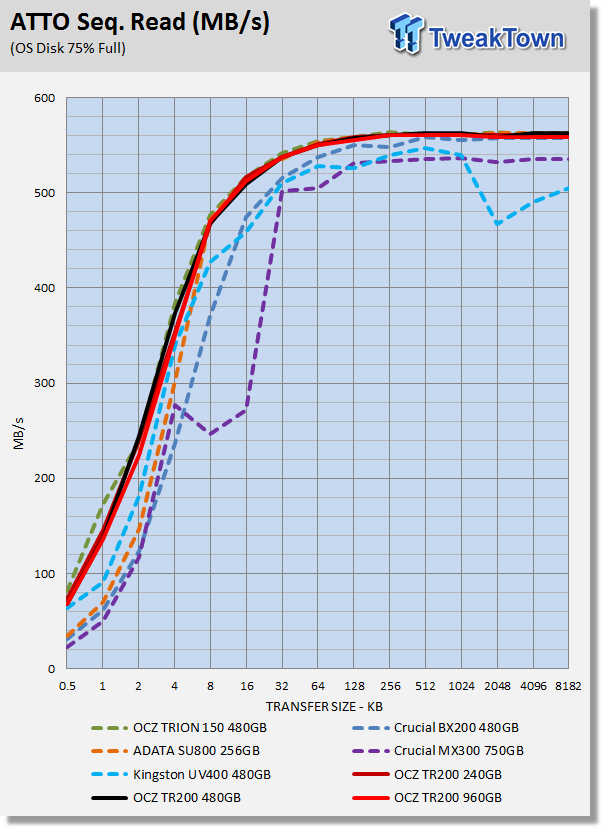
We are looking for a nice smooth performance curve and good small-file performance. The TR200 delivers it once again when testing small sequential file performance.
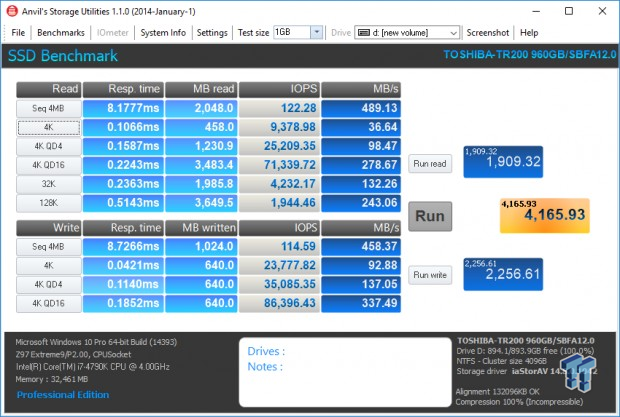
Anvil Storage Utilities
Version and / or Patch Used: 1.1.0
Anvil's Storage Utilities is a storage benchmark designed to measure the storage performance of SSDs. The Standard Storage Benchmark performs a series of tests; you can run a full test or just the read or write test, or you can run a single test, i.e., 4k QD16. With Anvil's, we are focused on the total score.


Scoring
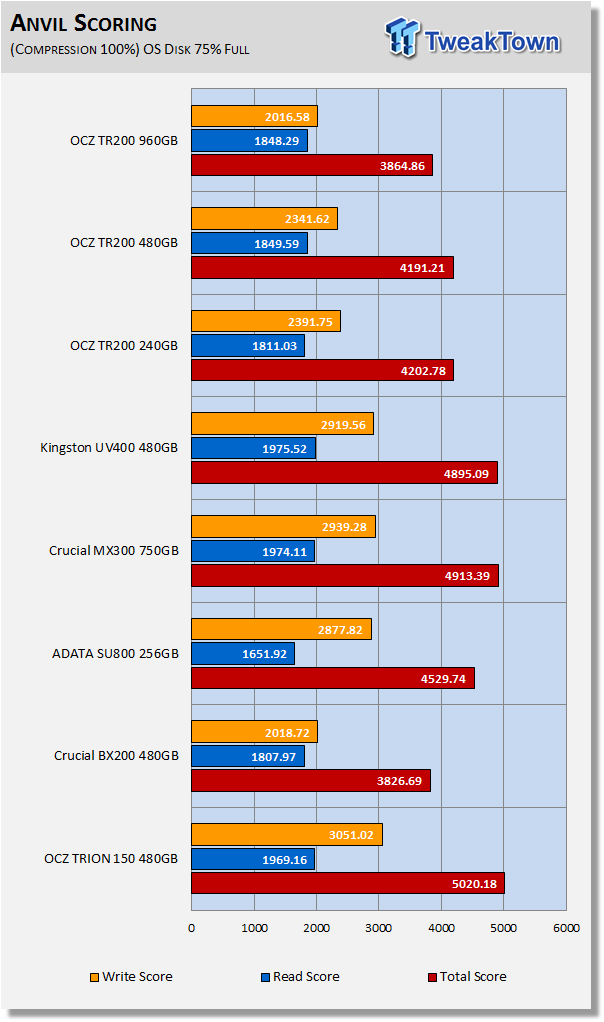
Anvil's scoring typically provides us with a good indication of a drive's overall synthetic performance. This plays out as we would expect to see for a DRAMless configuration. The 240GB model scores better than the 480GB and 960GB models because its address table is smaller and easier to manage. We typically are looking for a score of at least 4K from a TLC SSD. The 240GB and 480GB models give us what we are looking for, but the 960GB model doesn't quite get there.
(Anvil) Read IOPS through Queue Depth Scale
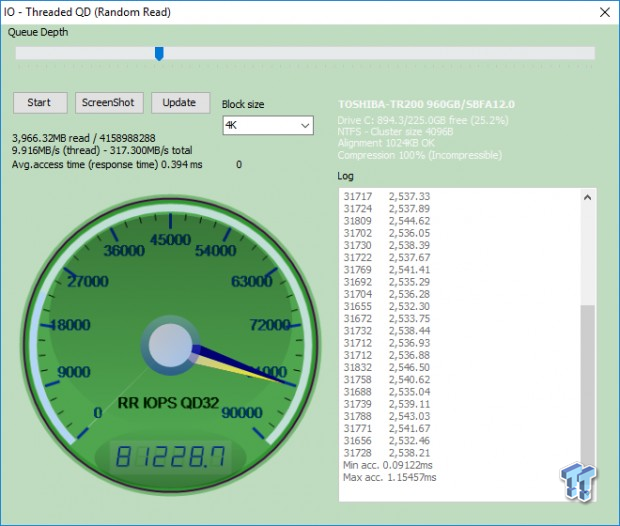
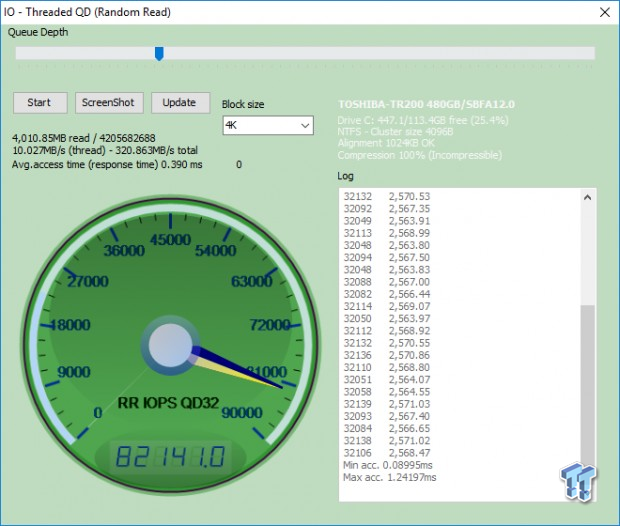
With a partition on the drives and 75% full, the 960GB and 480GB models are able to exceed factory max random read specifications. The 240GB model (not shown) doesn't quite get there.
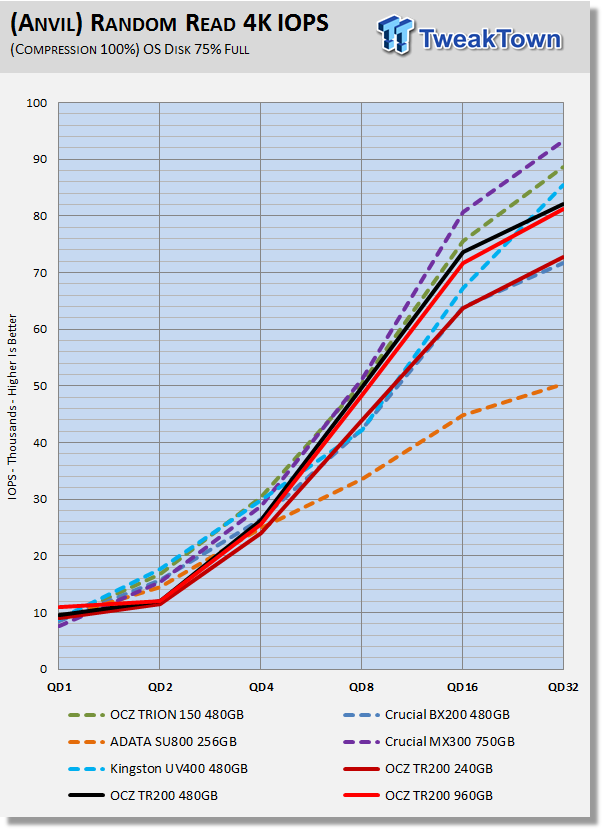
QD1 is the most important metric, and the TR200's deliver better QD1 random read performance than the rest of the drives in our test pool. However, the TR200 doesn't begin to scale in performance until we exceed QD2.
(Anvil) Write IOPS through Queue Scale
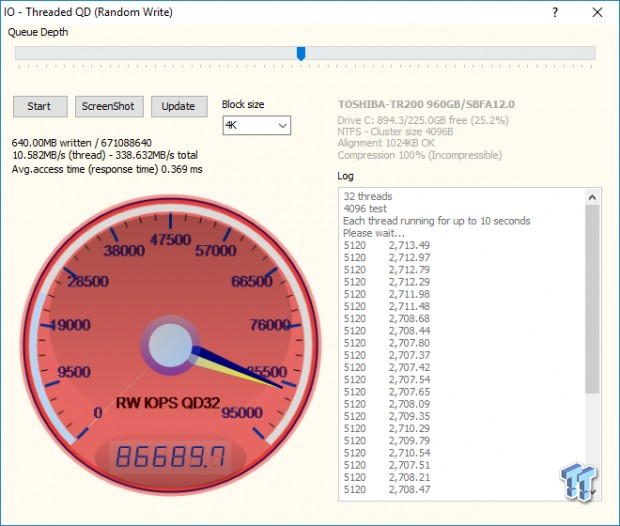

We are able to hit factory max random write specs, or close enough, even when the drives are 75% full.
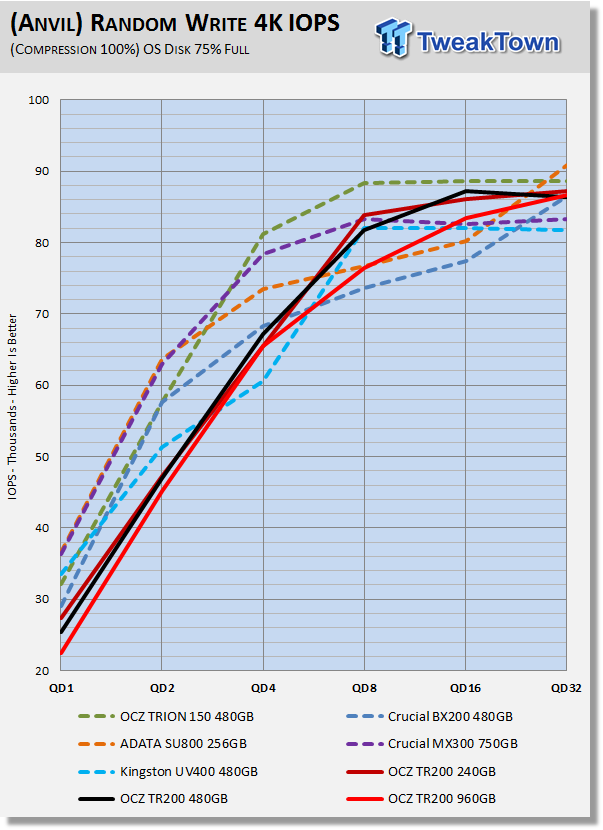
The TR200 is the only DRAMless SSD in our test pool. Without DRAM table caching, low queue depth random write performance takes a hit.
Synthetic Benchmarks - CDM & AS SSD
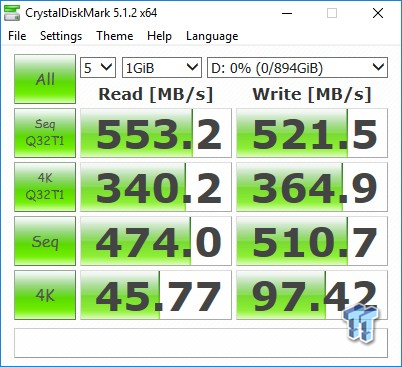
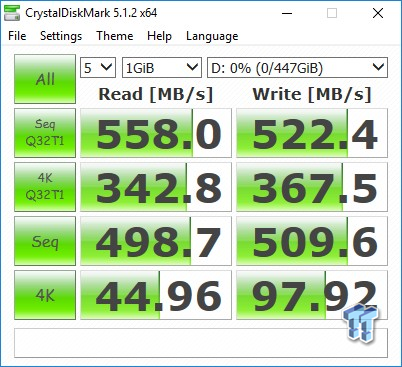
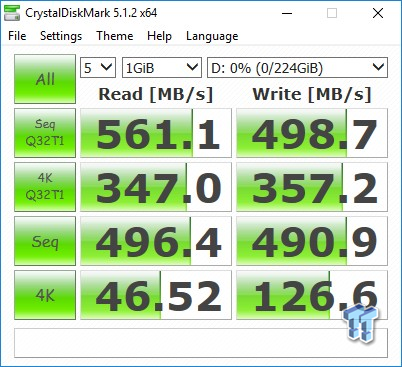
CrystalDiskMark
Version and / or Patch Used: 3.0 Technical Preview
CrystalDiskMark is disk benchmark software that allows us to benchmark 4K and 4K queue depths with accuracy. Note: Crystal Disk Mark 3.0 Technical Preview was used for these tests since it offers the ability to measure native command queuing at QD4. With this version of CDM, we are focused on 4K random performance at QD1 and QD4.
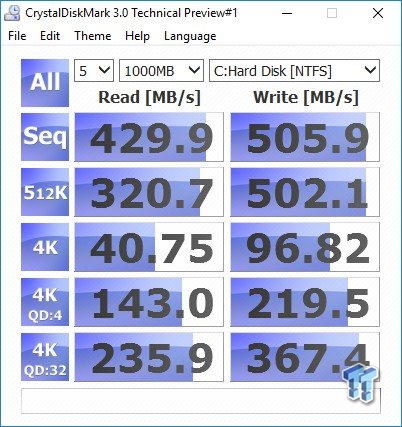
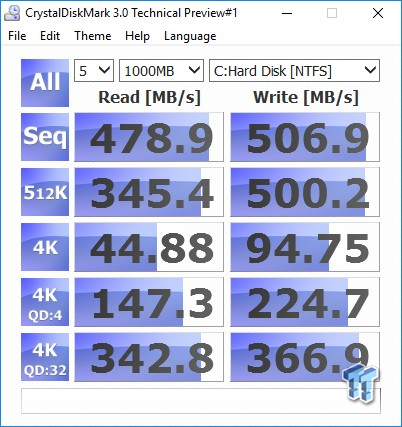
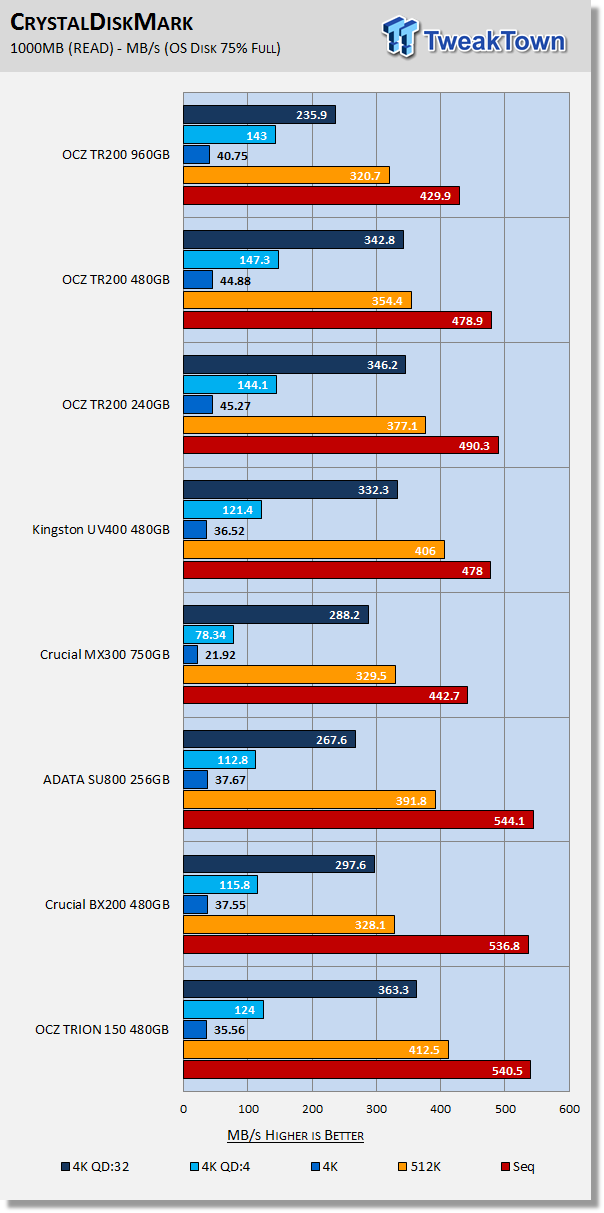
Focusing in on 4K QD1 and 4K QD4, we are getting very strong random read performance from the TR200 at all three capacity points. This is a win for the TR200.
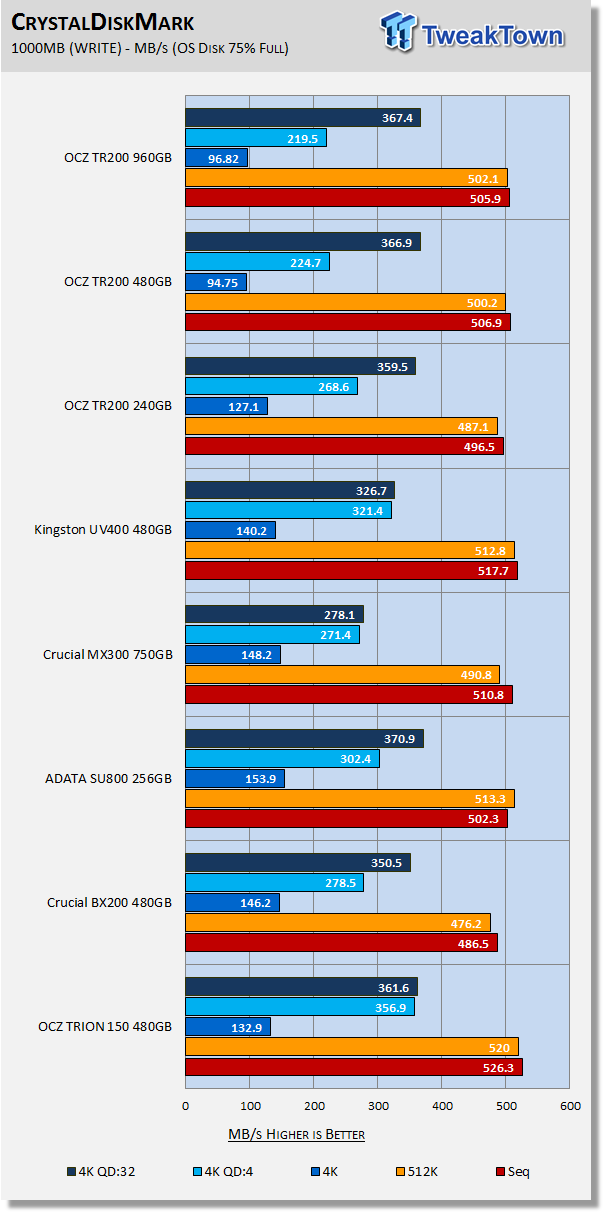
Random write performance at QD1 and QD4 is lower than the rest of the drives in our test pool. This is to be expected from DRAMless SSDs.
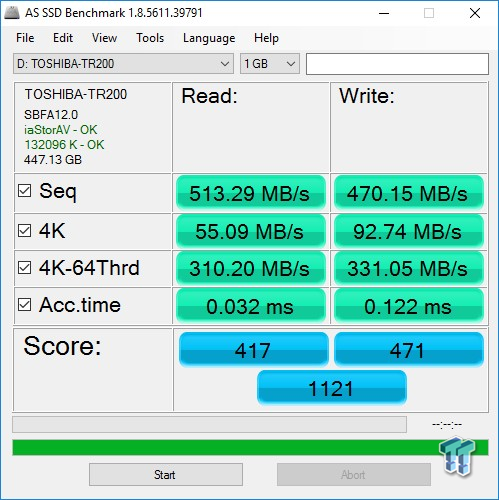
AS SSD
Version and / or Patch Used: 1.8.5611.39791
AS SSD determines the performance of SSDs. The tool contains four synthetic as well as three practice tests. The synthetic tests are to determine the sequential and random read and write performance of the SSD. We focus on the total score when evaluating AS SSD results.

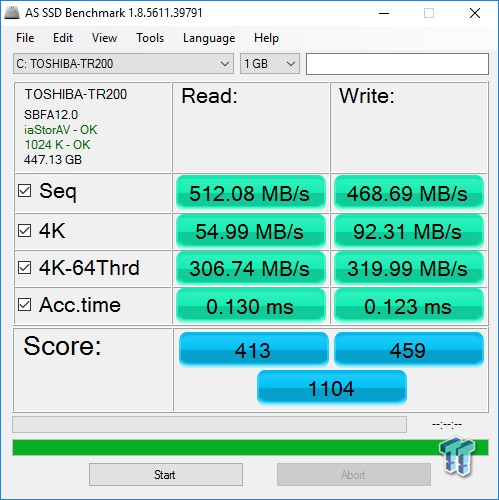
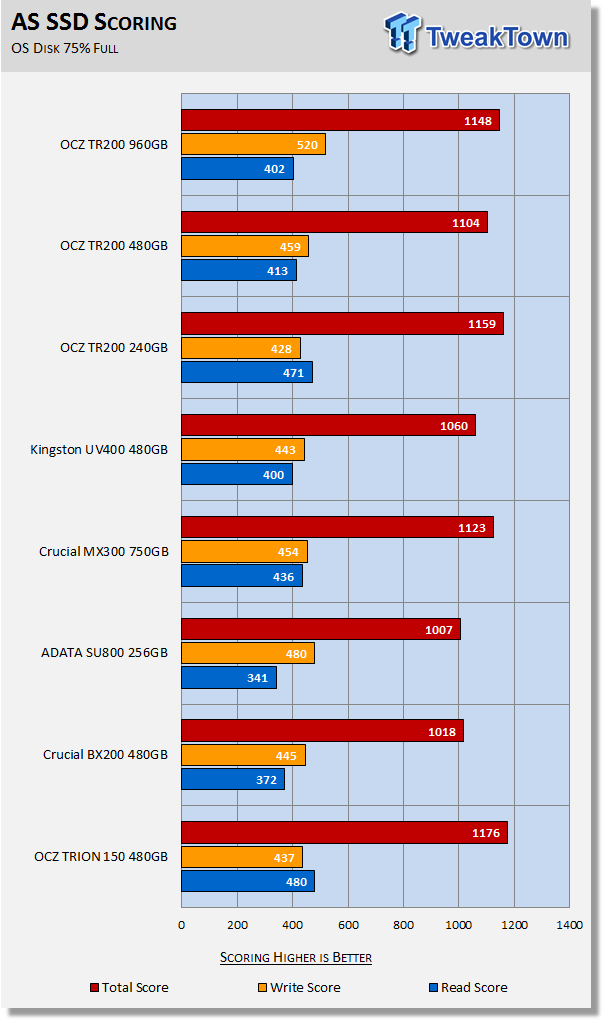
AS SSD is a demanding test. With AS SSD we are looking for a minimum score of 1000 from a TLC SSD. All three capacity points give us what we are looking for and then some; each scoring over 1100.
Benchmarks (OS) - Vantage, PCMark 7, PCMark 8 & SYSmark
Consumer Workloads
We categorize these tests as indicative of a moderate workload environment.
PCMark Vantage - Hard Disk Tests
Version and / or Patch Used: 1.2.0.0
The reason we like PCMark Vantage is that the recorded traces are played back without system stops. What we see is the raw performance of the drive. This allows us to see a marked difference between scoring that other trace-based benchmarks do not exhibit. An example of a marked difference in scoring on the same drive would be empty vs. filled vs. steady state.
We run Vantage three ways. The first run is with the OS drive 75% full to simulate a lightly used OS volume filled with data to an amount we feel is common for most users. The second run is with the OS volume written into a "Steady State" utilizing SNIA's guidelines. Steady-state testing simulates a drive's performance similar to that of a drive that been subjected to consumer workloads for extensive amounts of time. The third run is a Vantage HDD test with the test drive attached as an empty, lightly used secondary device.
OS Volume 75% Full - Lightly Used

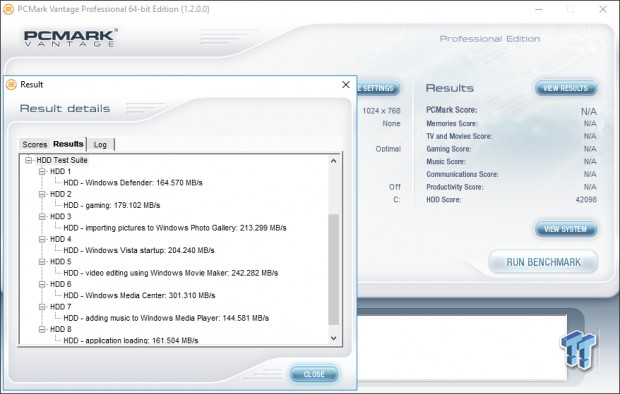
OS Volume 75% Full - Steady State
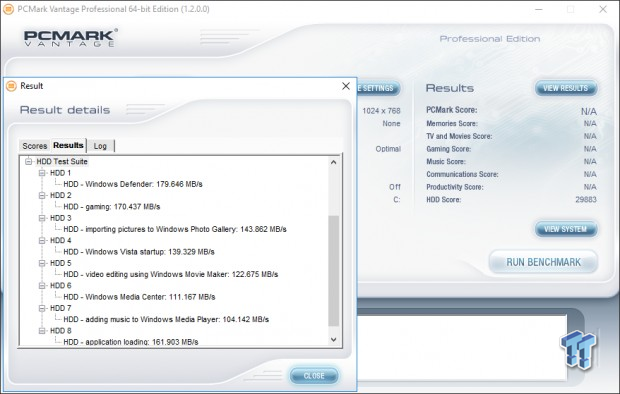
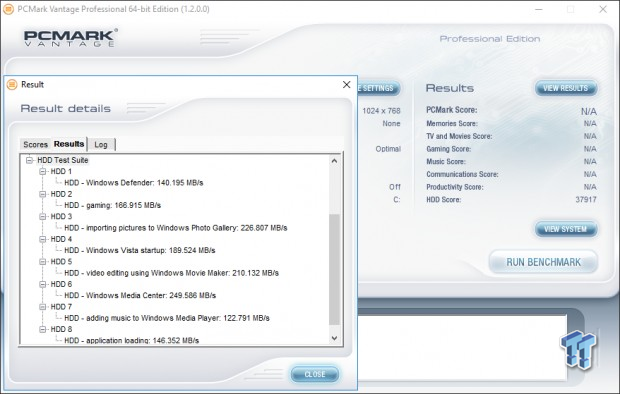
Secondary Volume Empty - FOB


There's a big difference between an empty drive, one that's 75% full/used, and one that's in a steady state.
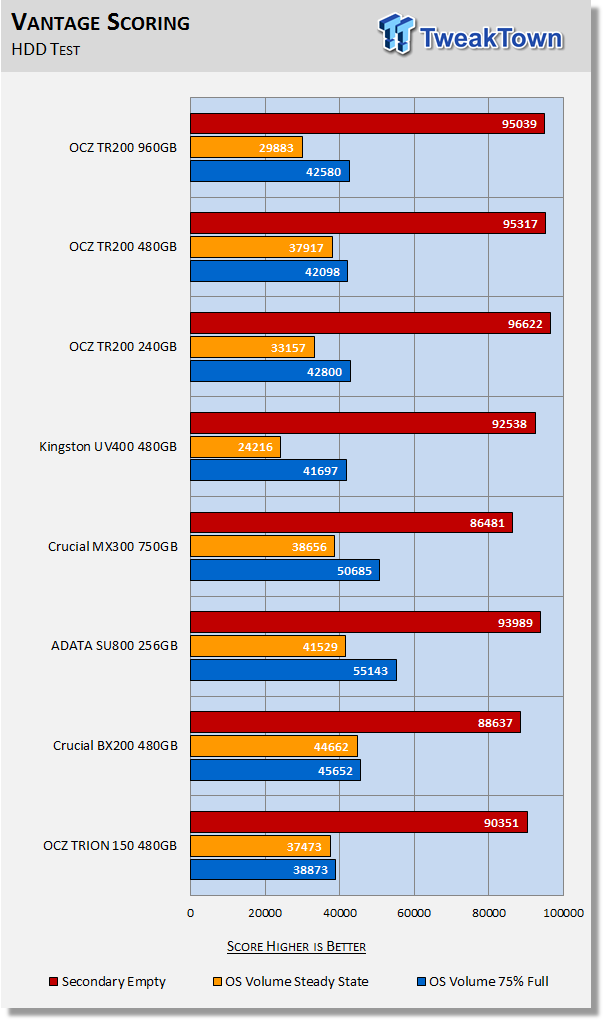
The important scores to pay attention to are "OS Volume Steady State" and "OS Volume 75% full." These two categories are most important because they are indicative of typical of consumer user states. When a drive is in a steady state, it means garbage collection is running at the same time it's reading/writing. This is exactly why we focus on steady-state performance.
Stunning scores when empty, but empty is practically meaningless. At 75% full and lightly used, the TR200's all score about the same. The TR200 manages to outperform its predecessor the TRION 150 as well as the UV400 with data on the drive, but that's about it. Workload performance is where a 2-channel controller is at a disadvantage, although the TR200's 3D flash array is offsetting a lot of the disadvantage.
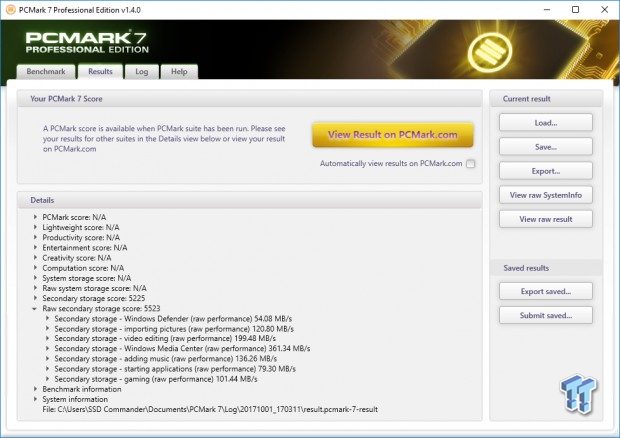
PCMark 7 - System Storage
Version and / or Patch Used: 1.4.0
We will look to Raw System Storage scoring for evaluation because it's done without system stops and, therefore, allows us to see significant scoring differences between drives.
OS Volume 75% Full - Lightly Used

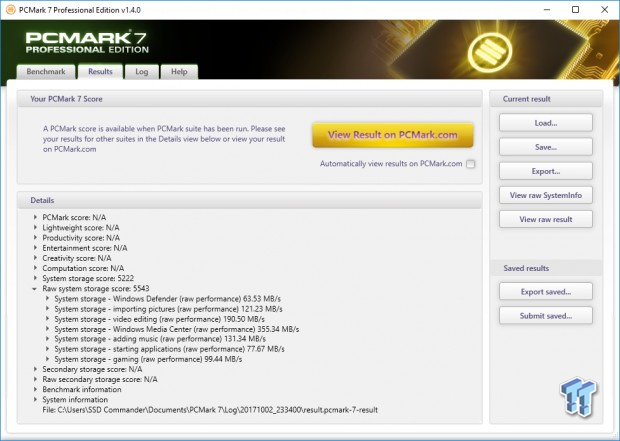
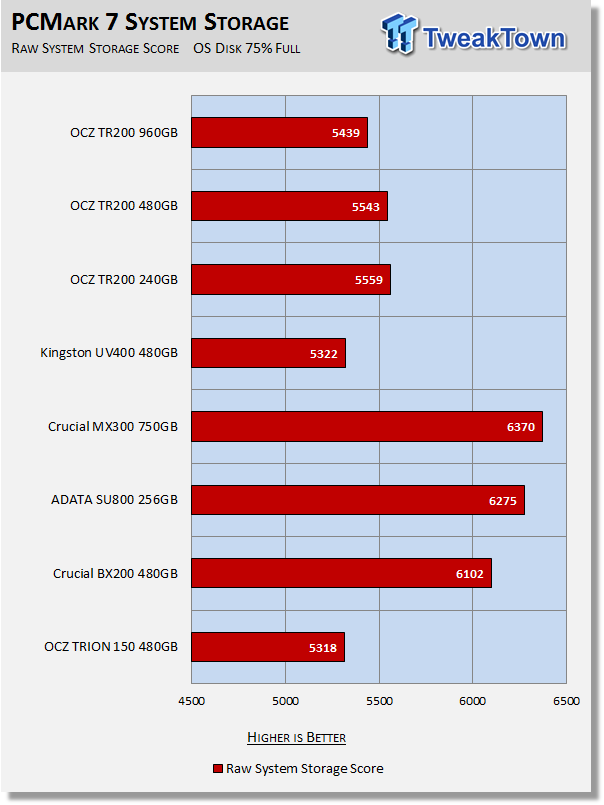
We are typically looking for a minimum score of 5K from a value-oriented SSD. The TR200 is able to exceed our minimum. Again, the TR200 outscores the TRION 150 and the UV400.
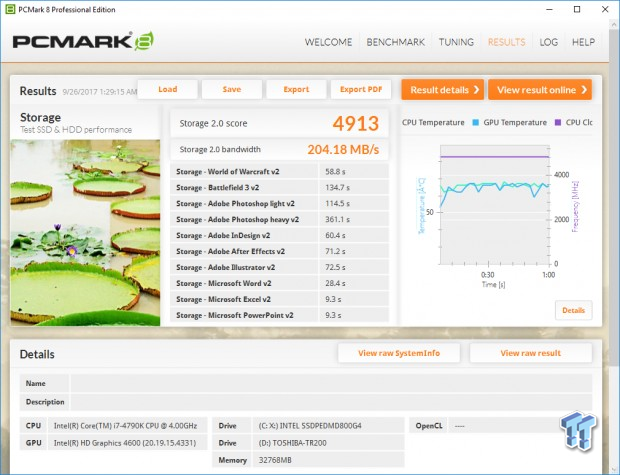
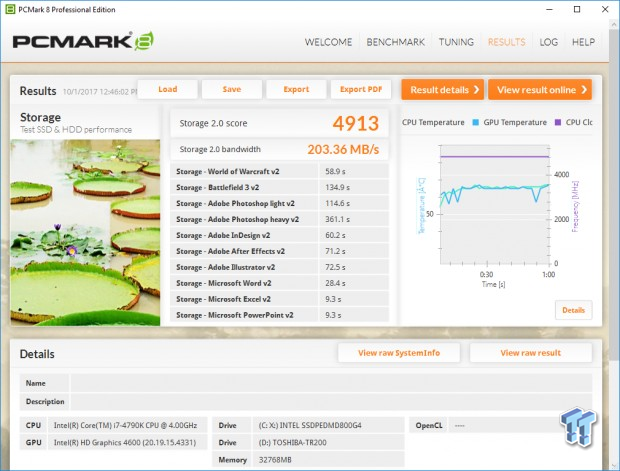
PCMark 8 - Storage Bandwidth
Version and / or Patch Used: 2.4.304
We use PCMark 8 Storage benchmark to test the performance of SSDs, HDDs, and hybrid drives with traces recorded from Adobe Creative Suite, Microsoft Office, and a selection of popular games. You can test the system drive or any other recognized storage device, including local external drives. Unlike synthetic storage tests, the PCMark 8 Storage benchmark highlights real-world performance differences between storage devices. We focus on the total score first and then storage bandwidth when evaluating PCMark 8 results.
OS Volume 75% Full - Lightly Used
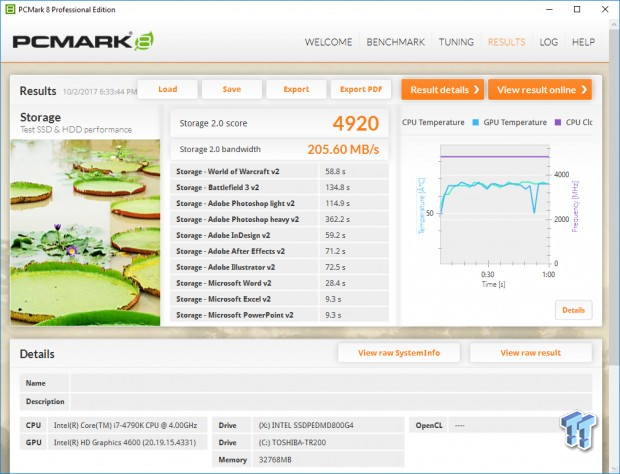

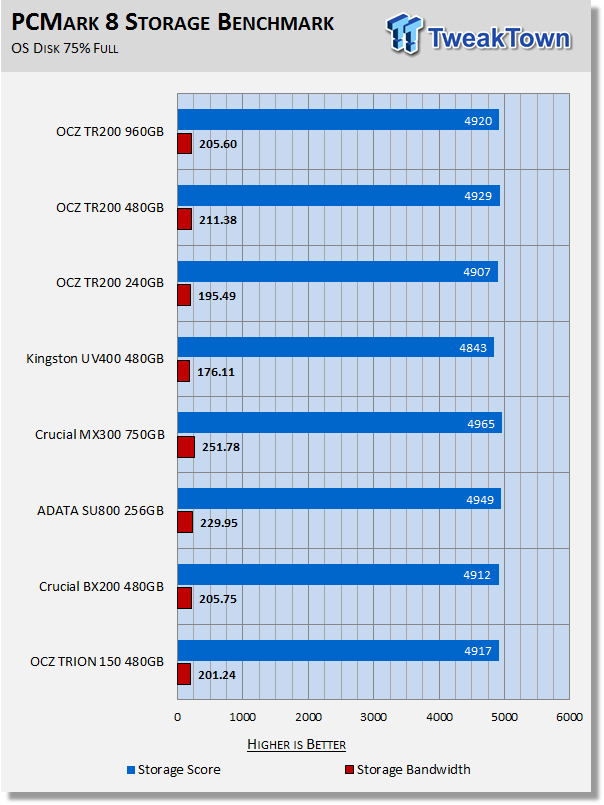
PCMark 8 is the most intensive moderate workload simulation we run. With respect to moderate workloads, this test is what we consider the best indicator of a drive's overall performance. We consider overall score more important than bandwidth because scoring takes latency into account.
This time we find that the smaller address table on the 240GB can't overcome the advantage of more die on the higher capacity models. The 480GB and 960GB TR200's both deliver better performance than their planar flash-based sibling the TRION 150. The TR200 at all capacity points scores higher than we were expecting to see from a DRAMless SSD.
BAPCo SYSmark 2014 SE System Performance
Version and / or Patch Used: 2.0.0.70
SYSmark 2014 SE is considered the gold standard for testing system performance because it is an application based benchmark. This test gives us the ultimate in real-world results because it utilizes actual applications running on the system, instead of playing back recorded traces. If you want to know what kind of impact a particular SSD will have on your system's overall performance; this test will show you.
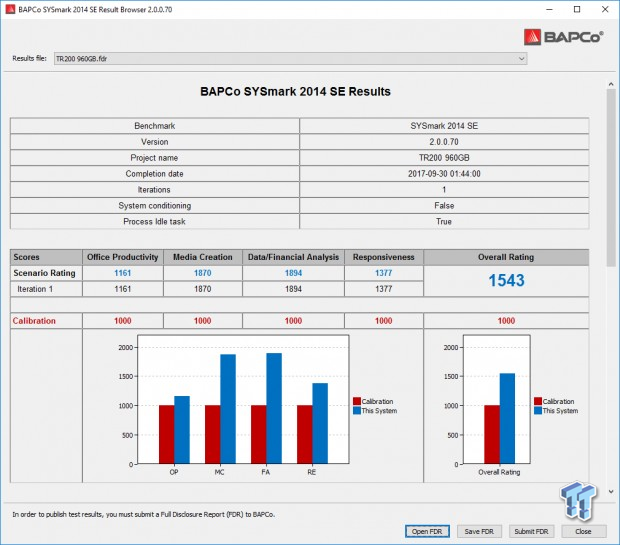
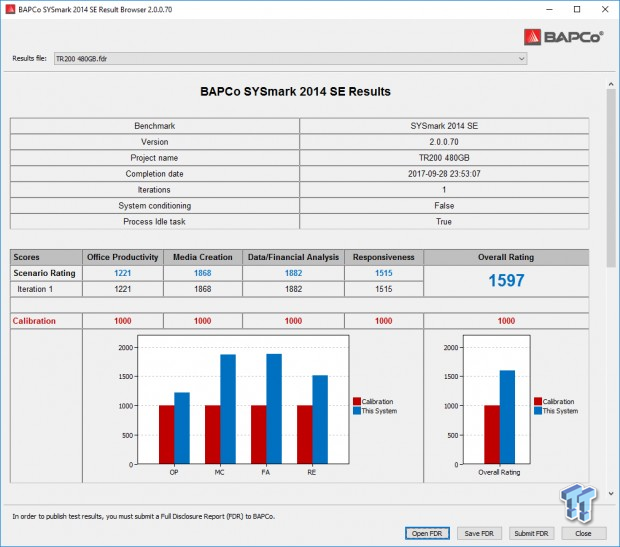
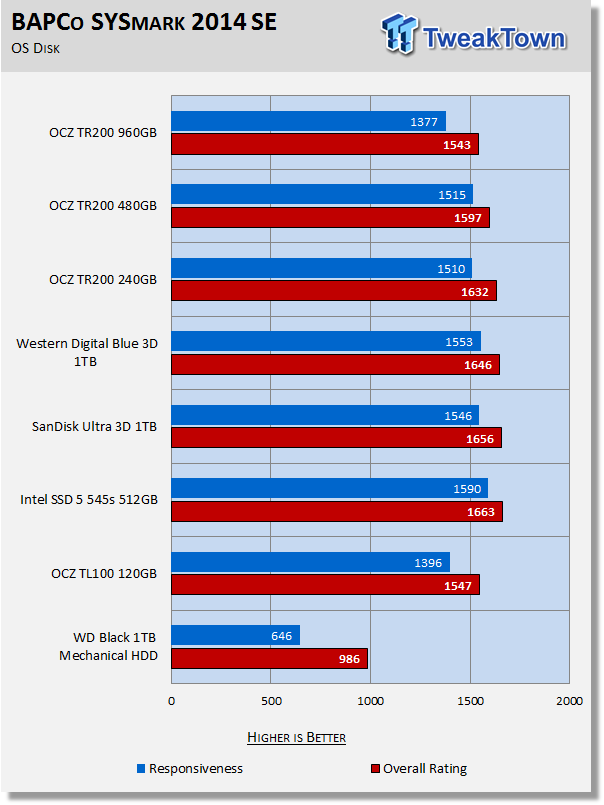
Our systems are much more powerful than the calibration system (1000-point baseline) used by BAPCo, so we ran an OCZ TL100 120GB SATA III SSD to establish a comparison point relative to our test systems. We will be running this test going forward, and we will add drives to our chart as we test them.
Real application testing shows us that the TR200 will deliver an average to above average user experience. The 240GB model does especially well. Here is a clear demonstration that low capacity DRAMless SSDs are typically faster than high capacity models.
Note: we are replacing our PCMark 8 Extended testing with SYSmark because we believe SYSmark is much more relevant for consumer SSD testing.
Benchmarks (Secondary) – IOPS, Response & Transfers
Iometer – Maximum IOPS
Version and / or Patch Used: Iometer 2014
We use Iometer to measure high queue depth performance. (No Partition)
Max IOPS Read
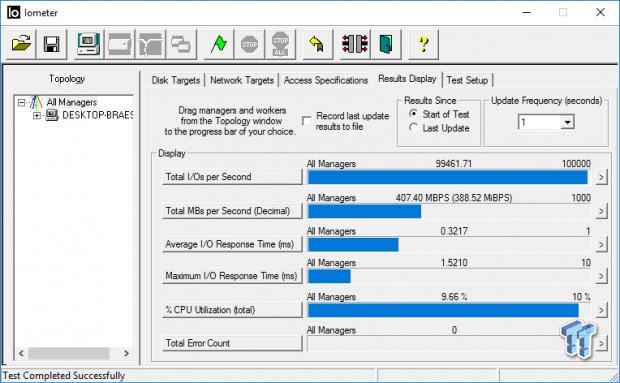
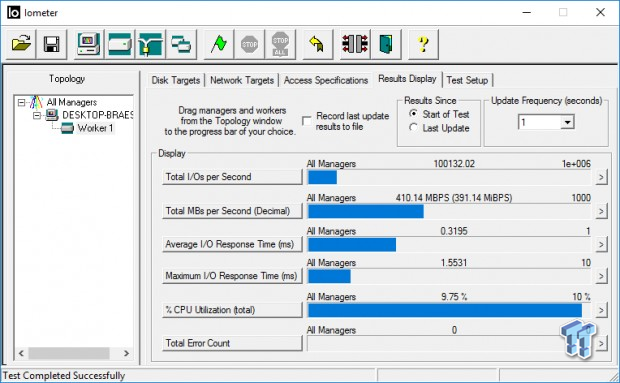
Max IOPS Write
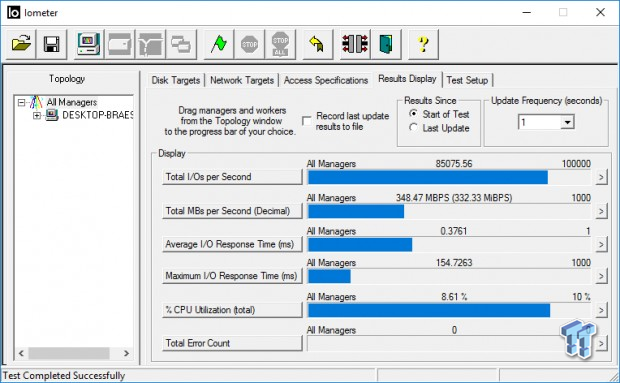

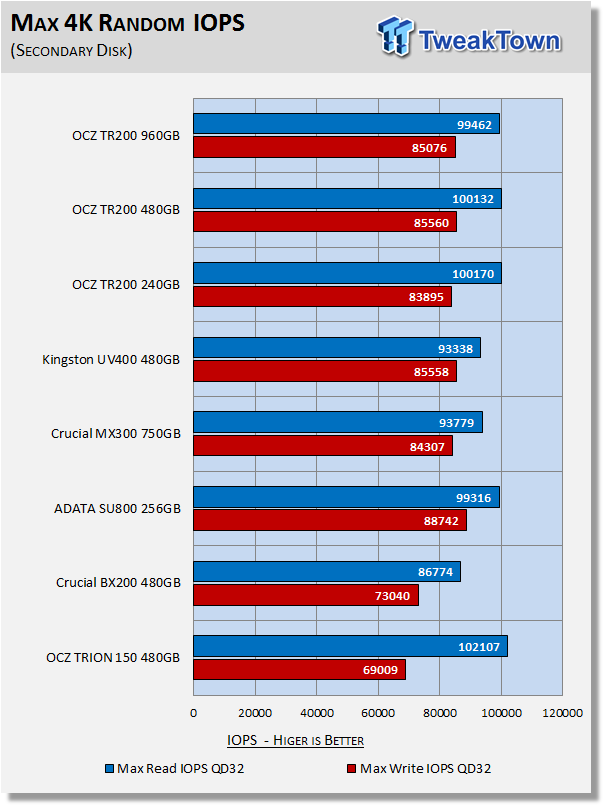
Good results from the TR200. We still can't hit 87K write IOPS though.
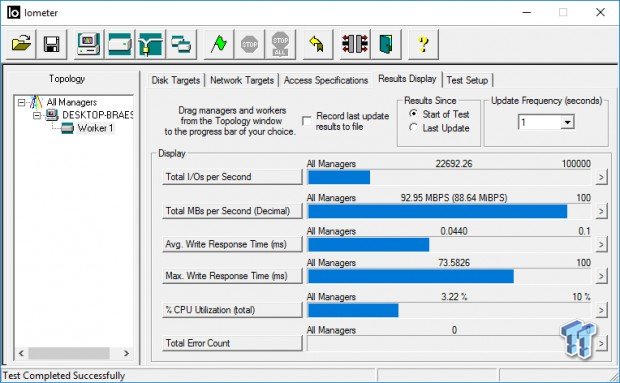
Iometer – Disk Response
Version and / or Patch Used: Iometer 2014
We use Iometer to measure disk response times. Disk response times are measured at an industry accepted standard of 4K QD1 for both write and read. Each test runs twice for 30 seconds consecutively, with a 5-second ramp-up before each test. We partition the drive/array as a secondary device for this testing.
Avg. Write Response
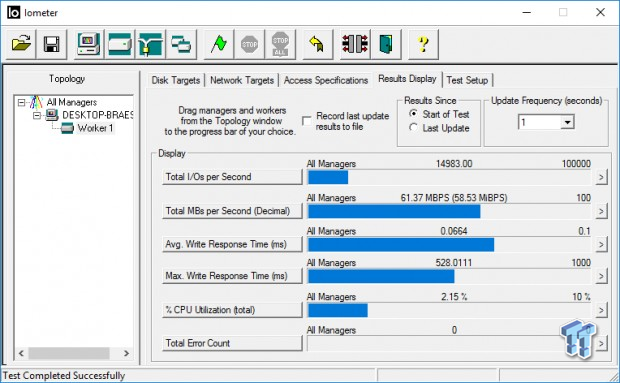
Avg. Read Response
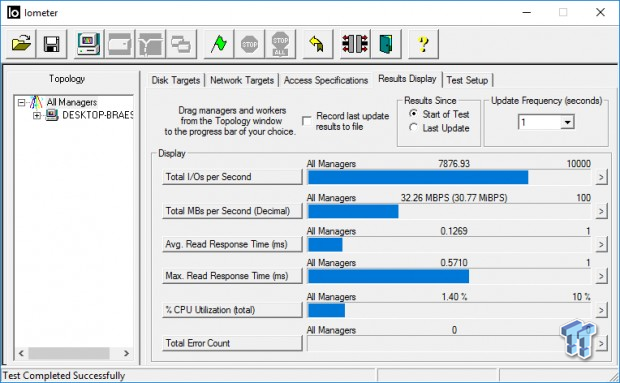
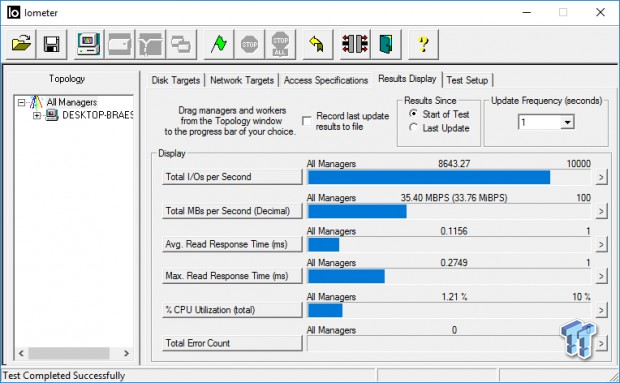
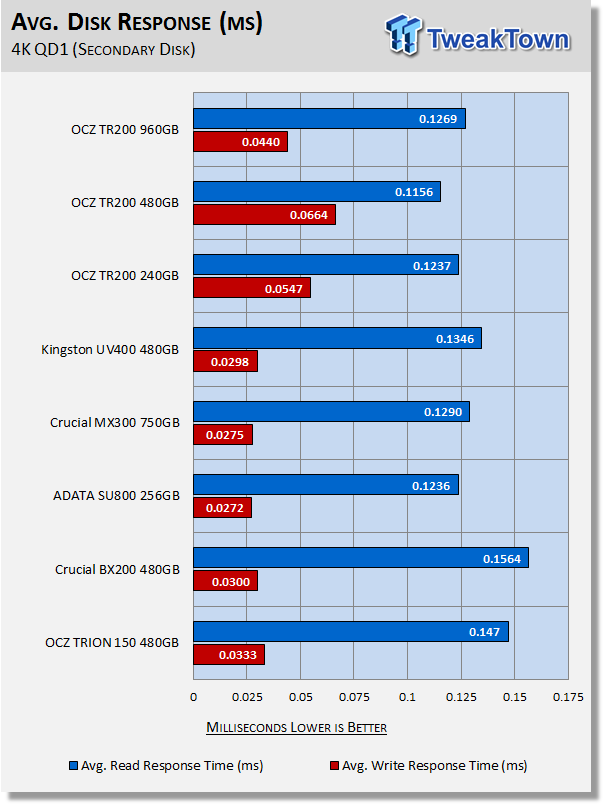
Better than average read response. In fact, the 480GB TR200 delivers the best (lowest) read response of all of the drives in our test pool. Write response is another matter. No DRAM cache makes write response sluggish.
DiskBench - Directory Copy
Version and / or Patch Used: 2.6.2.0
We use DiskBench to time a 28.6GB block (9,882 files in 1,247 folders) composed primarily of incompressible sequential and random data as it's transferred from our DC P3700 PCIe NVME SSD to our test drive. We then read from a 6GB zip file that's part of our 28.6GB data block to determine the test drive's read transfer rate. Our system is restarted prior to the read test to clear any cached data, ensuring an accurate test result.
Transfer Rate
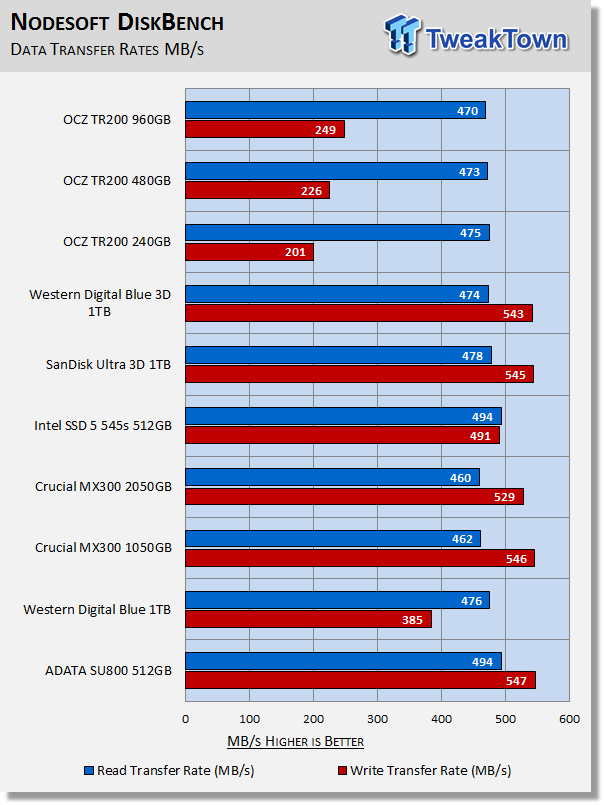
When testing write transfer rates, we have a rule of thumb. If any SSD cannot achieve 200MB/s with our write transfer test, that SSD will not receive a TweakTown recommendation. There are many TLC SSDs that do not pass our minimum, but we didn't include those on our chart. Additionally, we recently updated to Windows 10 Anniversary Edition and with that update, sustained write performance greatly increased. This means our previous transfer tests cannot be compared with those run on the newer version on Windows 10. This is the reason we only have a few drives on our chart.
The TR200 240GB just squeaks by our minimum thanks in large part to its 3D flash array offsetting its lack of a DRAM cache. As this shows, if you are transferring large chunks of data frequently, then the TR200 is probably not the drive for you. The good news is the vast majority of users aren't transferring huge chunks of data.
Benchmarks – 70/30 Mixed Workload & Sustained Sequential Write
70/30 Mixed Workload Test (Sledgehammer)
Version and / or Patch Used: Iometer 2014
Heavy Workload Model
This test hammers a drive so hard we've dubbed it "Sledgehammer." Our 70/30 Mixed Workload test is designed to simulate a heavy-duty enthusiast/workstation steady-state environment. We feel that a mix of 70% read/30% write, full random 4K transfers best represents this type of user environment. Our test allows us to see the drive enter into and reach a steady state as the test progresses.
Phase one of the test preconditions the drive for 1 hour with 128K sequential writes at QD32. Phase two of the test runs a 70% read/30% write at QD32, full random 4K transfer workload on the drive for 1 hour. We log and chart (phase two) IOPS data at 5-second intervals for 1 hour (720 data points). 60 data points = 5 minutes.
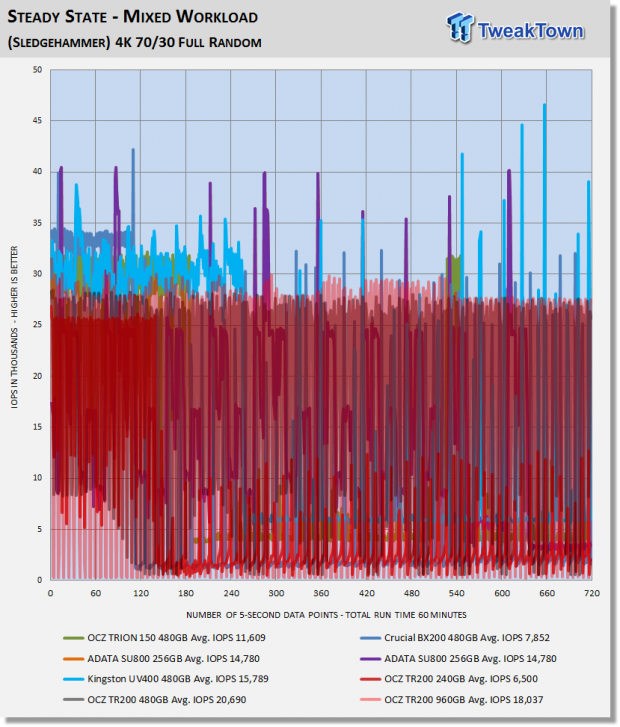
What we like about this test is that it reflects reality. Everything lines up, as it should. Consumer drives don't outperform Enterprise-Class SSDs that were designed for enterprise workloads. Consumer drives based on old technology are not outperforming modern Performance-Class SSDs, etc.
Because of the massive variability inherent to the drives we selected for our test pool, this chart is very hard to read, so just look at the average IOPS listed. The 240GB model gets pounded because it is able to be written over at least twice in the preconditioning stage. The higher capacity models are likely not getting written over more than once in the 1-hour timespan which is why they do so much better. This time these results must be taken with some skepticism.
Sustained Sequential Write
Version and / or Patch Used: Iometer 2014
Heavy Workload Model
We write to the drive for 1 hour with 128K sequential writes at QD32. We log and chart megabytes per second data at 5-second intervals for 1 hour (720 data points). 60 data points = 5 minutes.
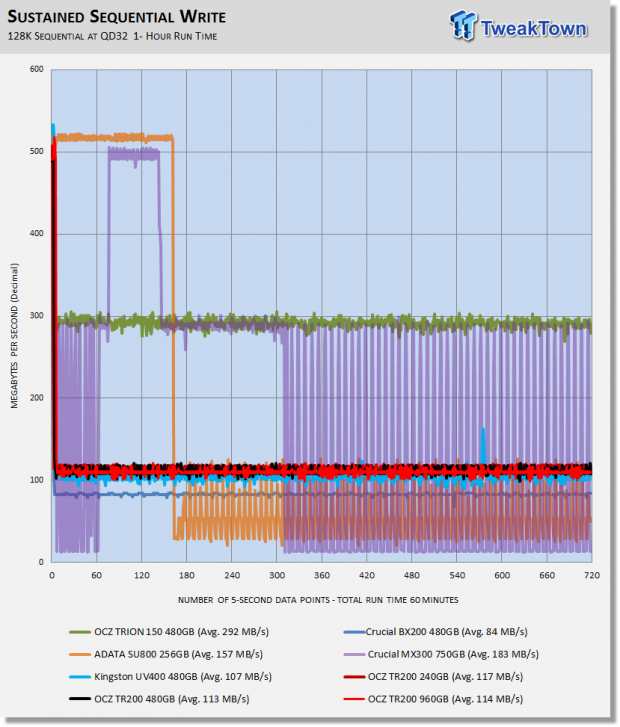
Here we can see the unmasked sequential write performance of the TR200, and it doesn't look very good. We expected to see more from a BiCS flash array, but the drives 2-channel controller is really holding it back.
Maxed-Out Performance (MOP)
This testing is just to see what the drive is capable of in an FOB (Fresh Out of Box) state under optimal conditions. We are utilizing empty volumes of Windows 10 64-bit for this testing.
Windows 10 MOP
OCZ TR200 960GB SATA III SSD


Windows 10 MOP MOP
OCZ TR200 480GB SATA III SSD


Windows 10 MOP MOP
OCZ TR200 240GB SATA III SSD


Final Thoughts
Looking back at our test results, we find the TR200 does perform equivalent to or better than most value-oriented SSDs - at least the ones we chose for out test pool. This is a bit surprising considering the TR200 doesn't have a DRAM cache to speed things along. We like the fact that the TR200 delivers better moderate workload performance than the TRION 150, or TR150, that it is replacing. Also, we noticed that the TR200 doesn't take much of a performance hit when loaded up with data and we like that as well.
We believe the 240GB model will be the best selling of the bunch. It does deliver the best synthetic performance of the series. Synthetic performance represents the bursty type of workloads that are common to the average user relatively well. Evidence of this fact is demonstrated perfectly by our SYSmark 2014 SE testing. The 240GB TR200 was only 13 points away from matching the Western Digital Blue 3D 1TB' overall system performance which is quite a feat. SYSmark also showed proof that when considering a DRAMless SSD less may actually be more. Typically, SSDs that do have a DRAM cache get faster as capacity goes up. With DRAMless SSDs the opposite is what we are seeing. Less capacity is faster. This makes sense because the address table is smaller and easier for the SSD to manage when there is no DRAM to cache it.
Overall, and taking into consideration that the TR200 is DRAMless, we are fairly pleased with the product. In general, it delivers better performance than you will get from most planar TLC-based SSDs even with a DRAM cache. For some, the 2-channel DRAMless configuration of the TR200 will have its benefits. Mobile users will benefit from reduced power consumption. In theory, the TR200 should end up being priced lower than the competition, and that will be good for those on a tight budget.
User Experience: In terms of user experience the TR200 delivers an average SSD experience which is what we would expect from a value-oriented SSD. Our user experience wasn't anything to write home about, but it is still good enough to earn a TweakTown recommendation.
Pros:
- Synthetic Performance
- Software Suite
- 3D Flash
Cons:
- Workload Performance
- MSRP
- Sustained Seq. Write
 Biwin M560 2TB SSD Review - Best Overall Retail-Ready DRAMless SSD
 Samsung 990 2TB SSD Review - Ninth Gen QLC at PCIe Gen4 Speeds
 HighPoint Rocket 1604L Gen5 x16 NVMe Software RAID AIC Review: half the price with full 59 GB/s speed
 UGREEN NASync DXP4800 GT Review: powerful 4-bay NAS with AMD Ryzen and dual 10GbE ports
 Phison E37T SSD Controller Exclusive Preview - The Fastest DRAMless SSD Platform Yet
 GeForce RTX 50 Series GPU prices are rumored to increase by 30% in the coming weeks, months
 TSMC's 1.4nm process timeline accelerates, with mass production happening sooner than expected
 Diablo 4's next season is bringing back iconic items from Diablo 2 and 3
 Razer Huntsman V3 HE Magnetic 8K keyboards include a Mini 65% model
 Four C's of Xbox's future outlined in new CEO memo
 Linux kernel patch boosts Steam Deck 1% lows by 31.8% by fixing AMD CPU clock handling
 Nexus Mods new owner wants to make installing mods as easy as using Spotify
 Dragon Age remasters are technically possible but won't be easy, BioWare co-founder says
 The EU is preparing to hit ChatGPT and Roblox with its strictest content moderation rules
 Man outsmarts GPU scammers by filming his RTX 5070 Ti unboxing, and finds two-liter water bottle inside
 ASUS ROG Strix X870E-A Gaming WiFI7 Neo Review - A New Enticing Option
 Noctua NL-LC1-36 Liquid CPU Cooler Review
 Logitech G316 X 98 Wired Gaming Keyboard Review - Retro-Inspired Board that Falls a Little Short
 Logitech G512 X 98 Analog Mechanical Gaming Keyboard Review - An Innovative Two-in-One
 Thrustmaster T.Flight HOTAS 5 MSFS Edition Review
 SteelSeries Arctis Nova Pro Omni Wireless Headset Review - One Headset to Rule Them All
 SteelSeries Arctis Nova 7 Wireless Gen 2 Headset Review - New and Improved, But Is It Enough?
 AMD Ryzen 7 7700X3D Review - Days of Future Past
 I switched my PC to encrypted DNS in Windows 11, and browsing felt more private
 Printer Not Working in Windows? How to fix detection, print queues and drivers
 The Ultimate Guide to Personalizing Your Windows 11 Taskbar
 How to Turn Your Windows Laptop Into a Second Monitor with Miracast and Wireless Display in Minutes
 6 Mistakes to Avoid When Buying a Windows Laptop
 I capped Windows Update's bandwidth with Delivery Optimization, and my downloads stopped choking
 I use this decade-old free tool that finds files faster than Windows Search does
 I install and update most of my apps with this Windows command now, and I stopped downloading sketchy installers
 Hisense U6SF 65-inch MiniLED TV: High Performance Meets Leisurely Convenience
 I stopped digging through Windows menus after I set up this one folder