


Our Verdict
Introduction, Drive Specifications, Pricing & Availability
For people in the know, MyDigitalDiscount has long been a source for incredible deals on SSDs. A couple of weeks ago, we noticed that MyDigitalDiscount is selling Samsung's awesome PM961 1TB M.2 NVMe SSD for an eye-popping price of $422. This may sound like it is still priced pretty high, but with the current flash shortage in full swing, the pricing for many popular SSDs has skyrocketed in the past month or so.
The Samsung PM961 is basically an OEM client version of the 960 EVO. The 960 EVO sports slightly better performance specifications than the PM961, but in actual use, there is no discernable difference what-so-ever. And, as we will show, there is virtually no difference with real-world consumer workloads.
So, why are we starting off by mentioning this? Price. The Samsung 960 EVO 1TB is currently selling at Newegg.com for $507, which is a whopping $85 more than you will pay for a 1TB PM961 from MyDigitalDiscount.com. Right now, we believe this is the best deal going for a super-fast high capacity M.2 NVMe SSD.
Typically, retail consumers cannot even buy OEM client drives because they are only sold in large quantities. This is where MyDigitalDiscount comes to the rescue. MyDigitalDiscount has secured a large quantity of Samsung PM961's and is selling them to retail consumers.
We want our readers to know about this great deal, and we are going to show you first hand just how well Samsung's PM961 1TB M.2 NVMe SSD performs on both Intel and AMD Ryzen platforms.
Specifications
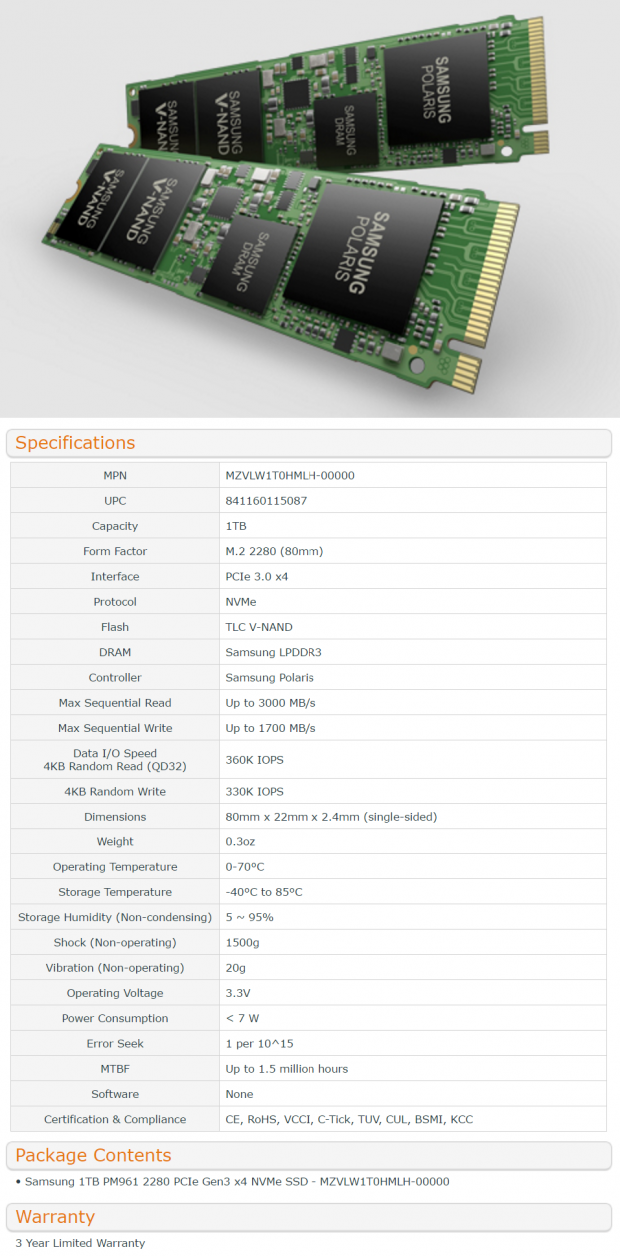
The Samsung PM961 M.2 NVMe PCIe SSD is available in four capacities: 128GB, 256GB, 512GB and 1TB. The 1TB PM961 we have on the bench today sports the following specifications:
- Sequential Read: up to 3,000 MB/s
- Sequential Write: up to 1,700 MB/s
- Max 4K Random Read Speed: up to 360,000 IOPS @ QD32
- Max 4K Random Write Speed: up to 330,000 IOPS @ QD32
- Endurance: not stated
- MTBF: 1.5 Million Hours
- Warranty: 3-Year Limited Warranty
- SMART
- TRIM
- Garbage Collection
The 1TB PM961 is currently selling at MyDigitalDiscount for $422.22.
Our Latest SSD Review Coverage
- Phison E37T SSD Controller Exclusive Preview - The Fastest DRAMless SSD Platform Yet
- Seagate FireCuda X1070 4TB SSD Review - A New Mainstream Contender
- Micron 3610 2TB SSD Review - DRAMless QLC at 11,000 MB/s
- SK hynix Platinum P51 2TB SSD Review - A Powerful Gen5 Alternative
- Biwin Black Opal X570 Pro 8TB SSD Review - Massive Capacity with Elite Performance
Drive Details
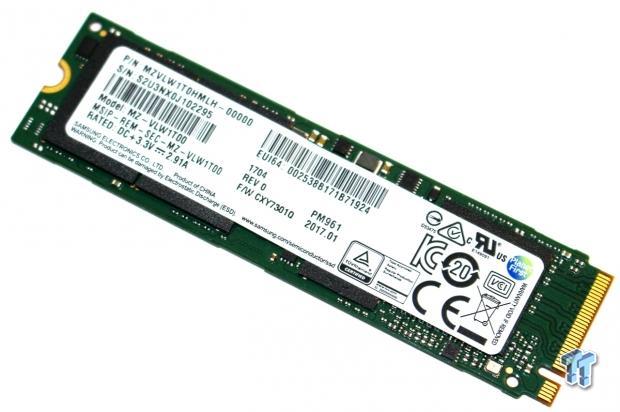
Samsung PM961 1TB M.2 NVMe PCIe SSD
Our drive arrived well protected inside of a small, sturdy plain brown cardboard box. We did not take a photo of it.
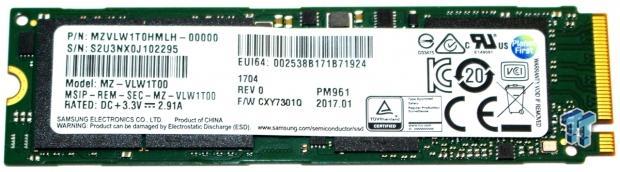
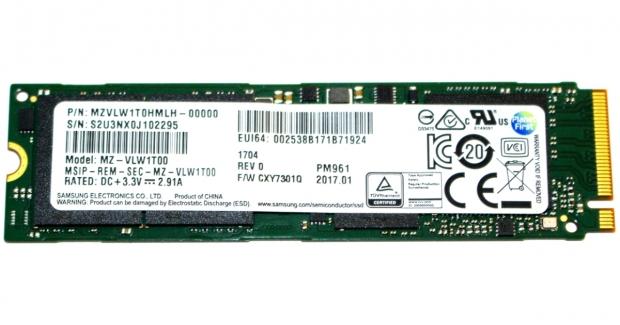
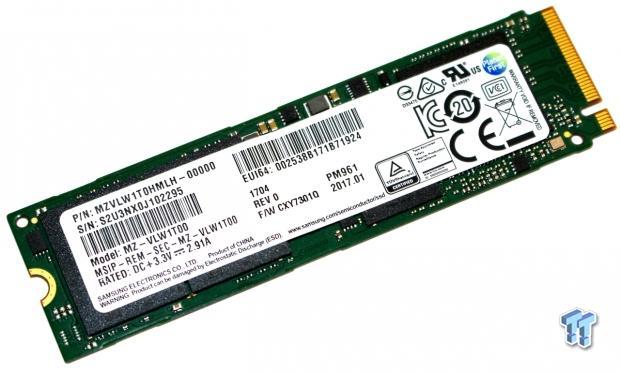
This side of the drive is covered by a manufacturer's label. We did not remove the label. Going from left to right the label is covering two 512GB Samsung 3-bit VNAND packages, a 1GB Samsung LPDDR3 1600MHz DRAM package and finally the drives 5-core Samsung Polaris NVMe controller.
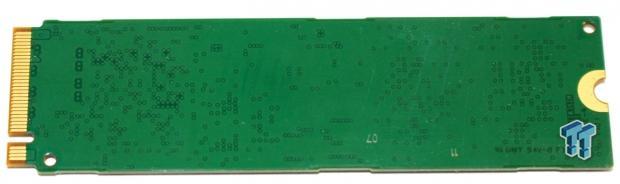
The PM961 is a single sided design, so there are no components located on this side of the PCB.
Test System Setup & Drive Properties
Jon's Consumer PCIe SSD Intel Review Test System Specifications
- Motherboard: ASRock OC Formula Z170 - Buy from Amazon / Read our review
- CPU: Intel Core i7 6700K @ 4.7GHz - Buy from Amazon / Read our review
- Cooler: Swiftech H2O-320 Edge - Buy from Amazon / Read our review
- Memory: Corsair Vengeance LPX DDR4 16GB 3200MHz - Buy from Amazon
- Video Card: Onboard Video
- Case: IN WIN X-Frame - Buy from Amazon / Read our review
- Power Supply: Seasonic Platinum 1000 Watt Modular - Buy from Amazon / Read our review
- OS: Microsoft Windows 10 Professional 64-bit - Buy from Amazon
- Drivers: Samsung NVMe driver
Jon's Consumer PCIe SSD AMD Ryzen Review Test System Specifications
- Motherboard: ASRock X370 Gaming K4
- CPU: AMD Ryzen 7 1800X @ 4.2GHz - Buy from Amazon / Read our review
- Cooler: Corsair Hydro H110i - Buy from Amazon
- Memory: Corsair Dominator Platinum DDR4 16GB 3000MHz - Buy from Amazon
- Video Card: XFX Radeon RX 460 Single Slot - Buy from Amazon
- Case: Corsair Carbide Air 540 - Buy from Amazon / Read our review
- Power Supply: Corsair RM850x 850 Watt Modular - Buy from Amazon
- OS: Microsoft Windows 10 Professional 64-bit - Buy from Amazon
- Drivers: Samsung NVMe driver
We would like to thank ASRock, Crucial, Intel, Corsair, RamCity, IN WIN, and Seasonic for making our test system possible.
Drive Properties
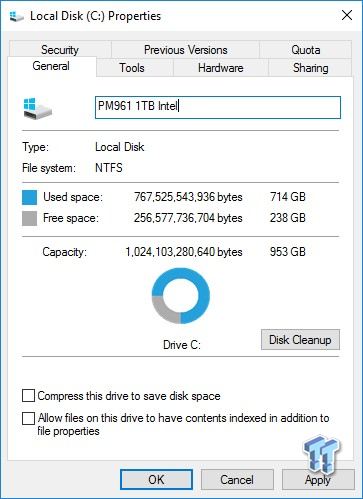
Samsung PM961 1TB M.2 NVMe PCIe SSD OS Disk 75% Full (Intel)
Samsung PM961 1TB M.2 NVMe PCIe SSD OS Disk 75% Full (AMD Ryzen)
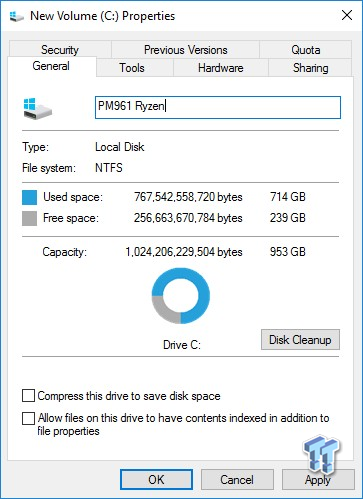
The majority of our testing is performed with our test drive as our boot volume. Our boot volume is 75% full for all OS Disk "C" drive testing to replicate a typical consumer OS volume implementation. We feel that most of you will be utilizing your SSDs for your boot volume and that presenting you with results from an OS volume is more relevant than presenting you with empty secondary volume results.
System settings: Cstates and Speed stepping are both disabled in our systems BIOS. Windows High-Performance power plan is enabled. Windows write caching is enabled, and Windows buffer flushing is disabled. We are utilizing Windows 10 Pro 64-bit OS (Build 14393) for all of our testing except for our MOP (Maxed-Out Performance) benchmarks where we switch to Windows Server 2008 R2 64-bit (Intel Only). Empty Windows 10 benchmark screenshots will also be shown on our MOP page for both Intel and AMD Ryzen Platforms.
Intel screenshots will be shown first followed by AMD Ryzen throughout the review.
Synthetic Benchmarks – ATTO & Anvil Storage Utilities
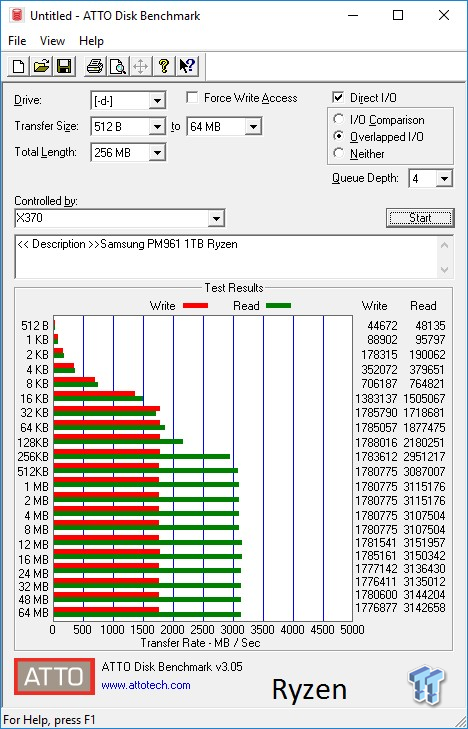
ATTO
Version and / or Patch Used: 3.05
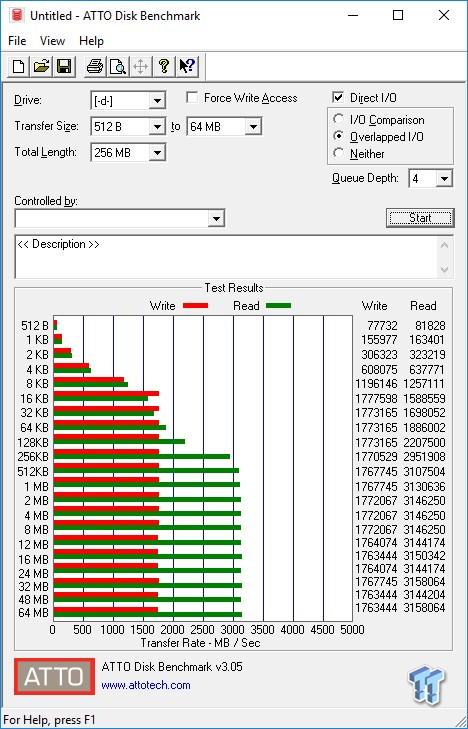
ATTO is a timeless benchmark used to provide manufacturers with data used for marketing storage products. When evaluating ATTO performance, we focus on the drive's performance curve.

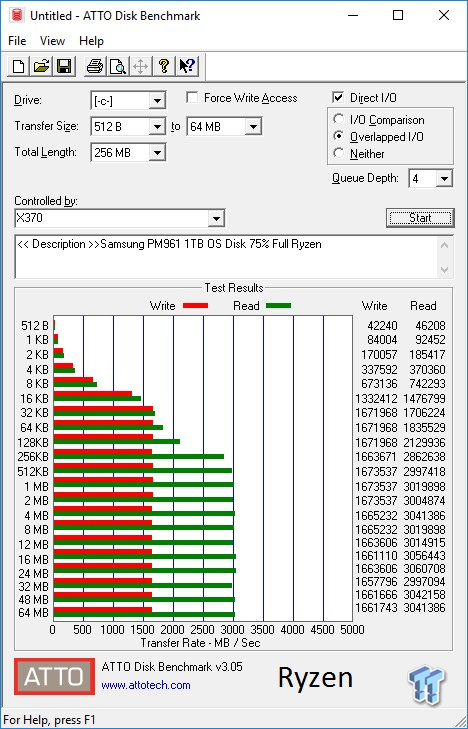
The PM961 meets or exceeds factory sequential specifications on our Intel platform. On our Ryzen platform, we can't quite hit 1,700 MBs sequential write. The Intel platform has a major advantage in smaller file sizes.
Sequential Write
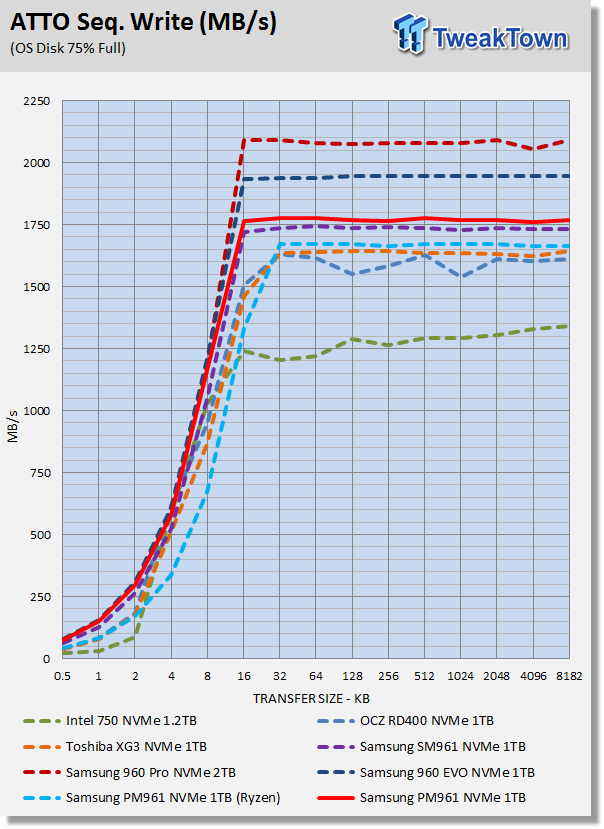
Graphing the performance curve shows the commanding lead that the Intel has over AMD's Ryzen platform at every file size. Comparing performance to the rest of the SSDs in our test pool shows the PM961 outperforming all but the 960 Pro and 960 EVO. Thanks to its pSLC (pseudo-SLC) caching, the PM961 manages to outperform the more powerful SM961.
Sequential Read
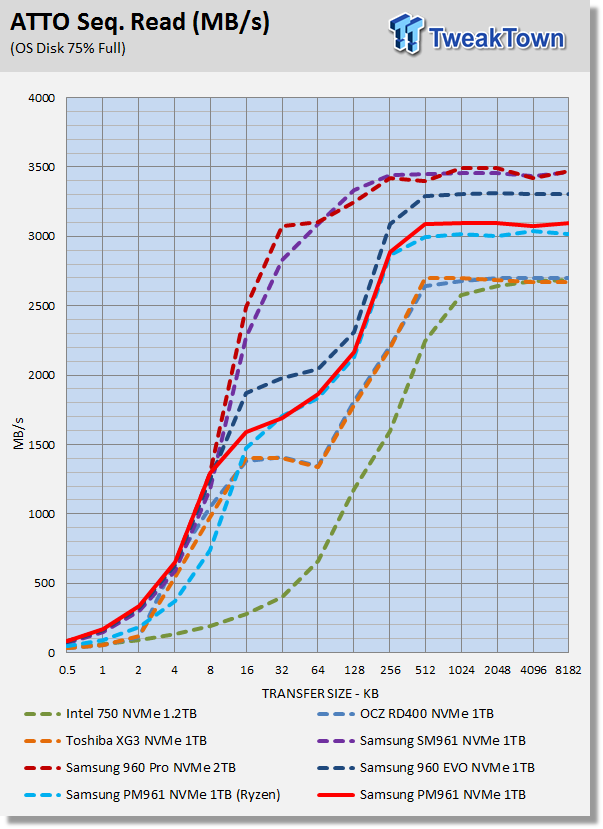
Again, the PM961 runs better on our Intel platform doing so where it matters most – small file performance. This time, the MLC powered SM961 leaves no doubt which is the better performing SSD. The Polaris powered PM961 lays waste to the Intel 750, RD400 and Toshiba XG3.
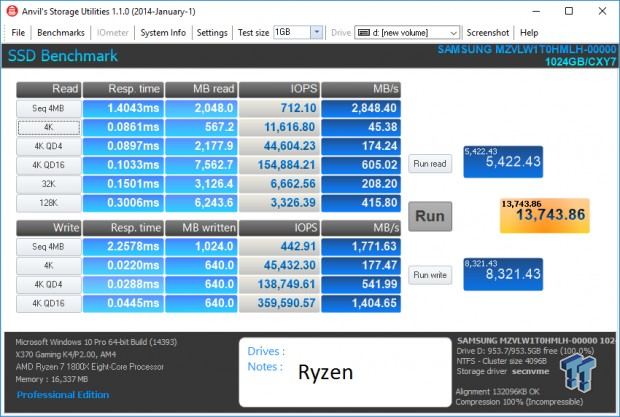
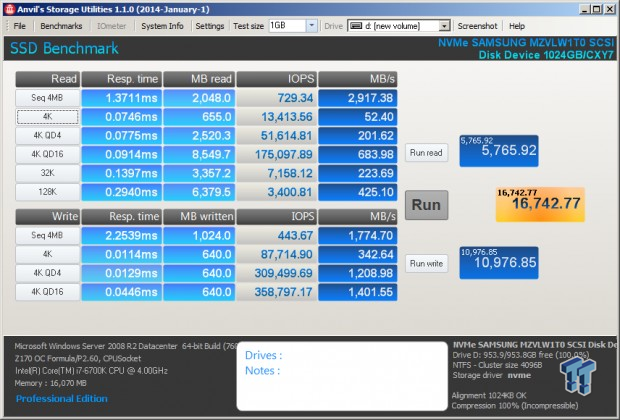
Anvil Storage Utilities
Version and / or Patch Used: 1.1.0
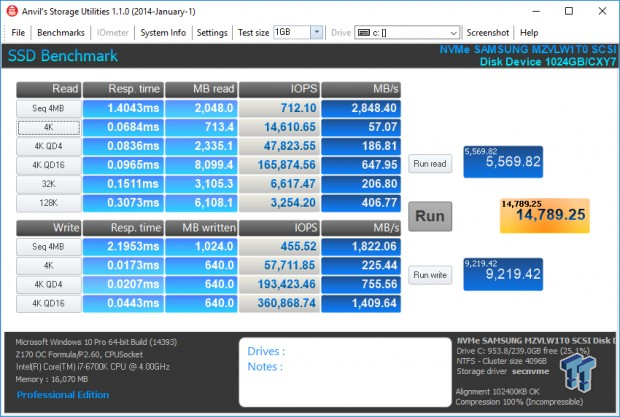
Anvil's Storage Utilities is a storage benchmark designed to measure the storage performance of SSDs. The Standard Storage Benchmark performs a series of tests; you can run a full test or just the read or write test, or you can run a single test, i.e. 4k QD16. When evaluating performance with Anvils, we focus on the total score. When evaluating NVMe SSDs, we are typically looking for a minimum total score of over 10K.

Scoring
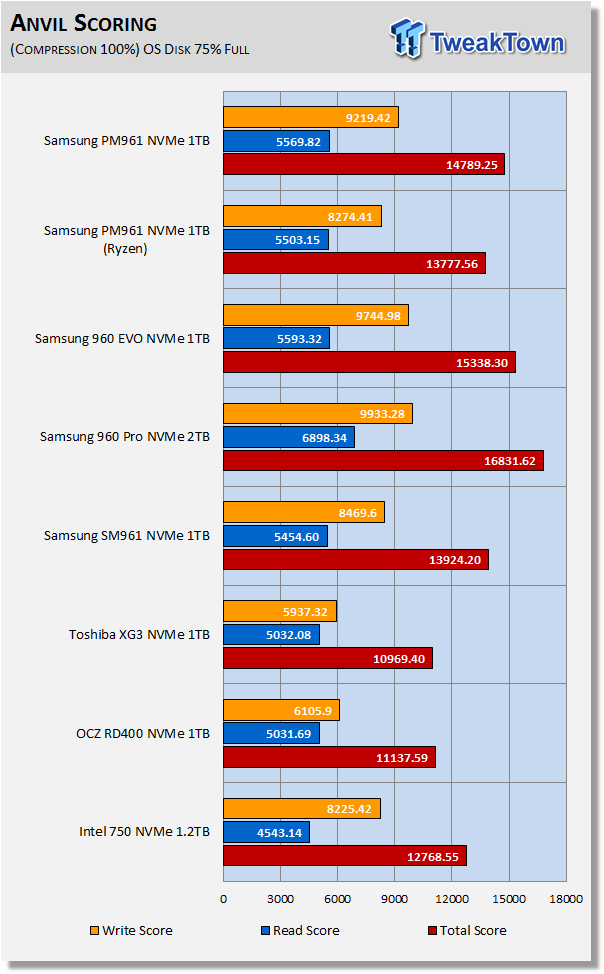
The PM961 outscores the more powerful SM961 primarily because we ran the SM961 on the in-box Windows 10 NVMe driver and the PM961 on Samsung's NVMe driver 2.0. Does an NMVe driver matter? You bet it does. The 960 EVO outscores the PM961, but it's not by much. The non-Samsung SSDs in our test pool don't stand a chance against the mighty PM961.
(Anvil) Read IOPS through Queue Depth Scale
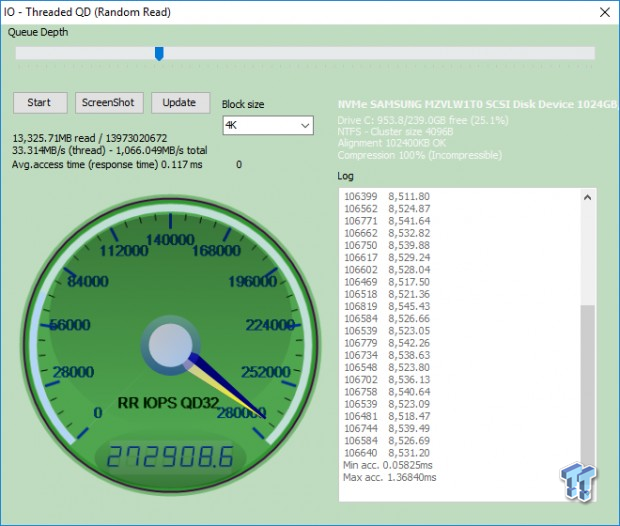
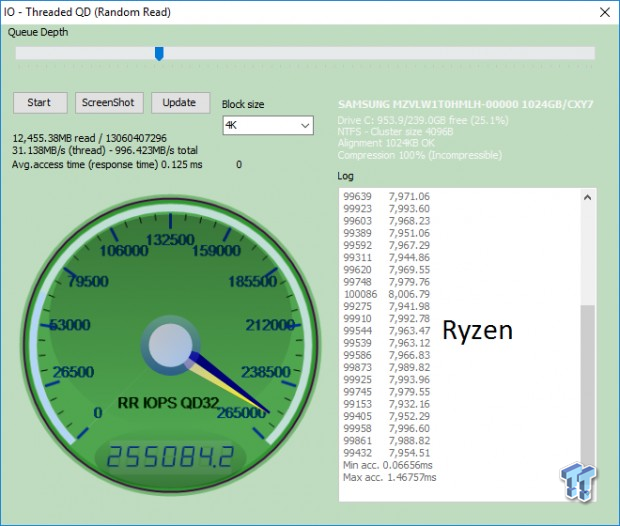
Our Ryzen platform is nipping at the heels of our Intel platform at high queue depths. Keep in mind that this is our OS disk and it is 75% full.
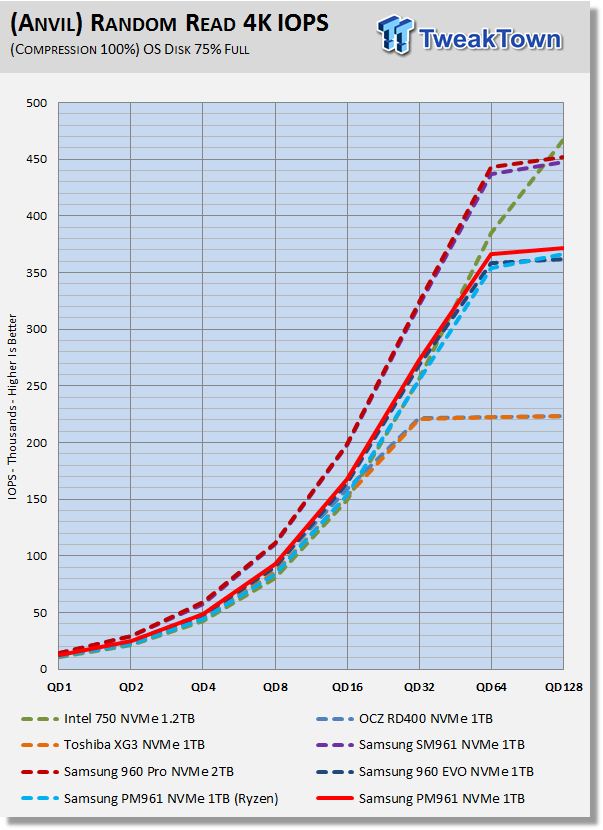
The Intel 750 takes the win at queue depths over 64, but overall, the Samsung SSDs in our test pool deliver a far better performance curve where it matters – low queue depths. The PM961 manages to edge out the 960 EVO, and demolishes the OCZ/Toshiba offerings.
(Anvil) Write IOPS through Queue Scale
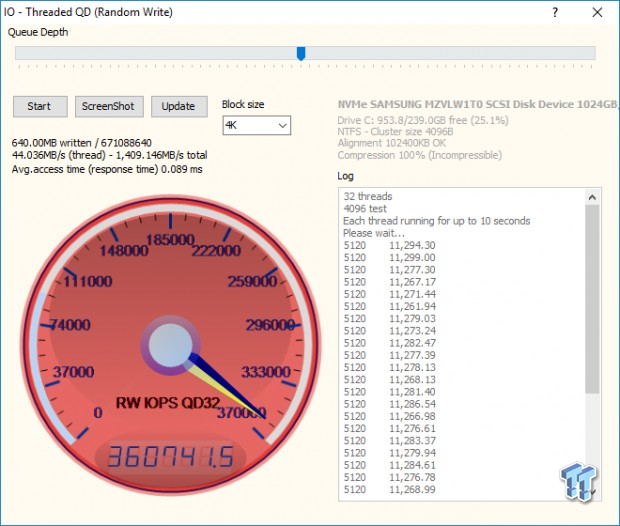
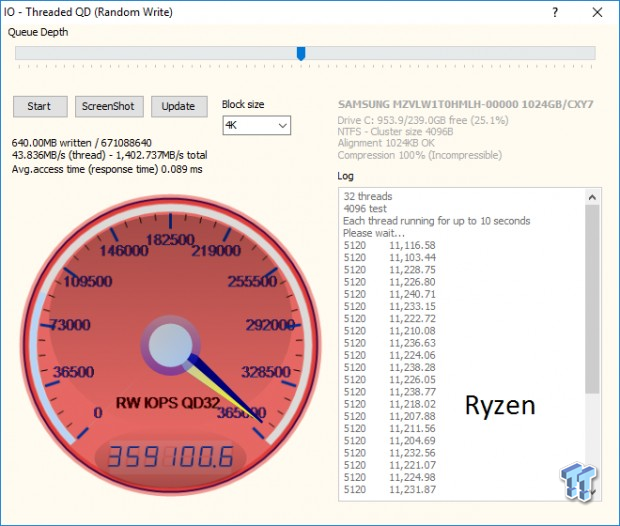
With our Intel platform, we are able to attain 360K random write IOPS at QD32. With our AMD Ryzen platform, we are able to attain 359K random write IOPS at QD32. Keep in mind that this is our OS disk and it is 75% full.
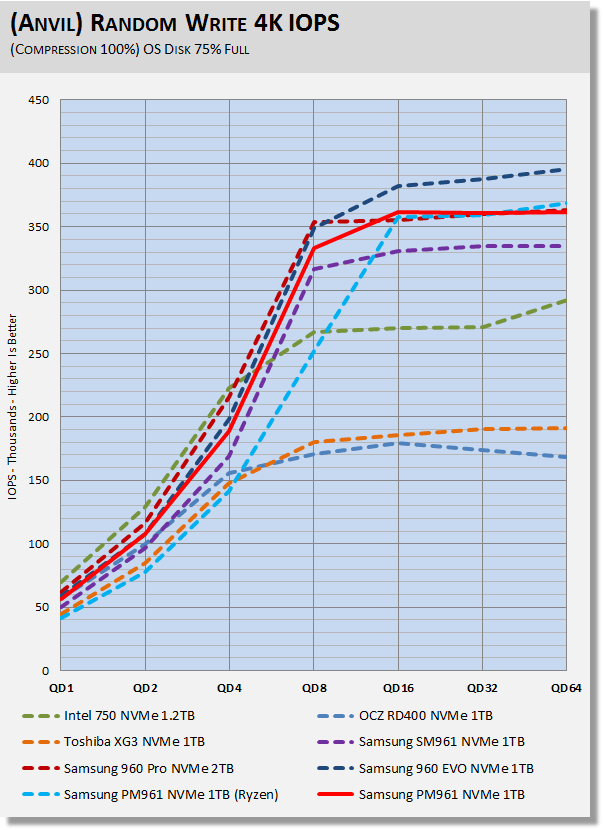
This paints a better picture of what is really going on than our test at QD32 does. The Intel platform demolishes the Ryzen platform at queue depths lower than QD32. For reasons unknown to us, Ryzen is significantly inferior when writing random data at low queue depths. We are using the exact same driver on both platforms, but Intel displays a clear advantage over AMD until we hit high queue depths where it doesn't really matter anyway.
This testing is accelerated by the PM961's pSLC cache layer, which is why is outperforms the SM961 and even the 960 Pro at queue depths 16-32. The 960 EVO outperforms the PM961 due to its performance oriented firmware. The OEM PM961 is held back by its firmware to keep thermals in check when installed in laptops. The EVO is able to be fully unleashed even in a laptop environment because its thermal label keeps heat in check.
Synthetic Benchmarks – CrystalDiskMark & AS SSD
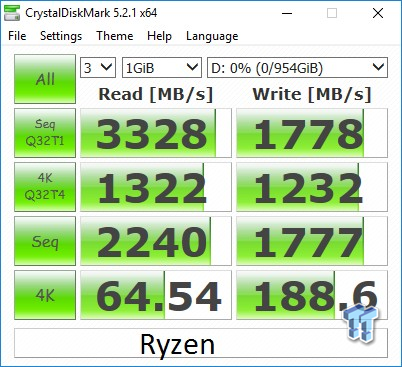
CrystalDiskMark
Version and / or Patch Used: 3.0 Technical Preview
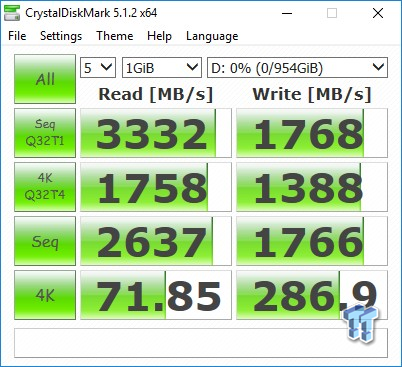
CrystalDiskMark is disk benchmark software that allows us to benchmark 4k and 4k queue depths with accuracy. Note: Crystal Disk Mark 3.0 Technical Preview was used for these tests since it offers the ability to measure native command queuing at QD4. When evaluating CDM results, we focus on 4K random performance at QD1 and QD4.
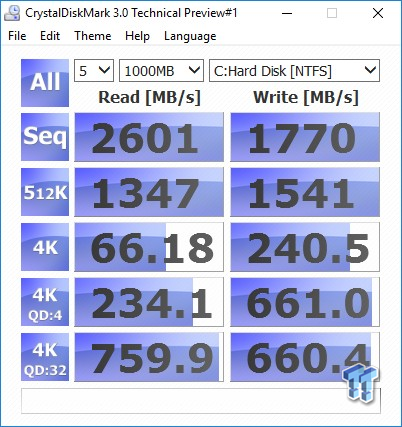
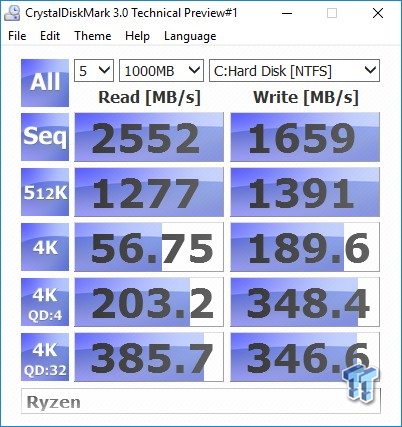
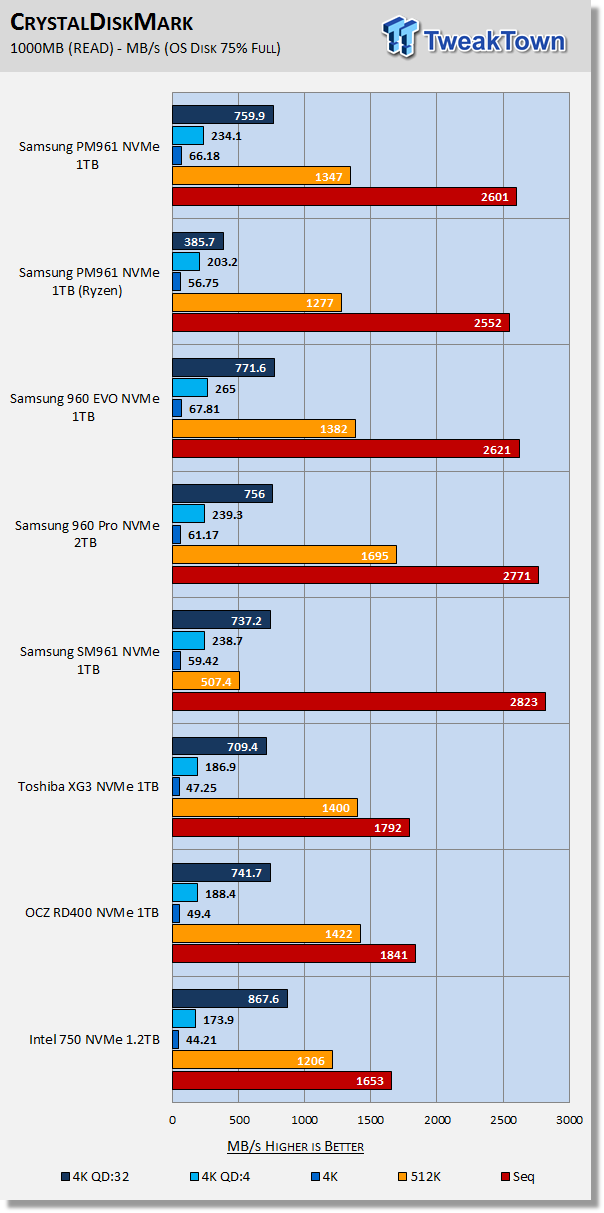
The Polaris controlled (Samsung) SSDs display vastly superior sequential read performance where it matters most – QD1. Once again, the PM961 is nipping at the heels of the 960 EVO. We see a big difference between Intel and AMD when reading random data. The PM961 is flexing some muscle and giving us a glimpse of why we believe it to be the best value in flash-based NVMe SSDs.
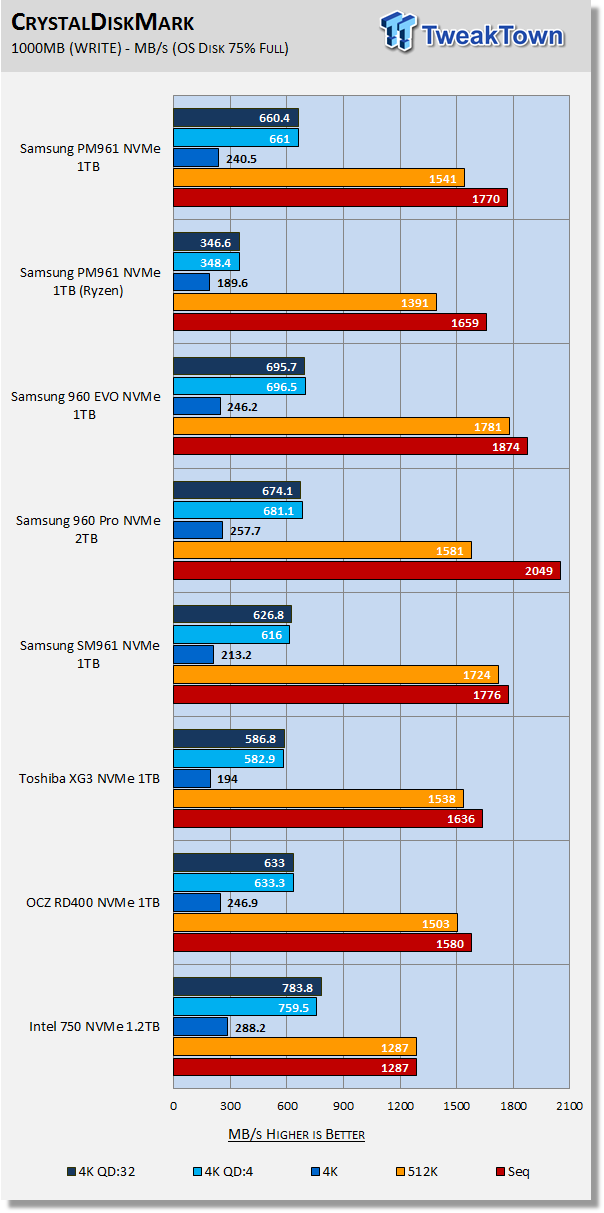
The AMD Ryzen platform is at a real disadvantage in comparison with Intel when writing random data. The PM961 is delivering better random write performance than the more powerful SM961, for two reasons, the driver we used on the PM961 and its pSLC caching layer.
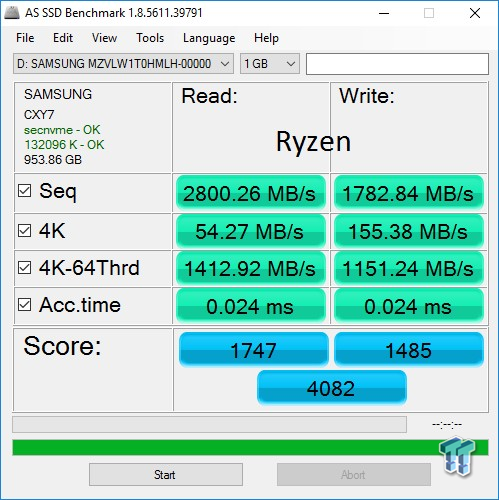
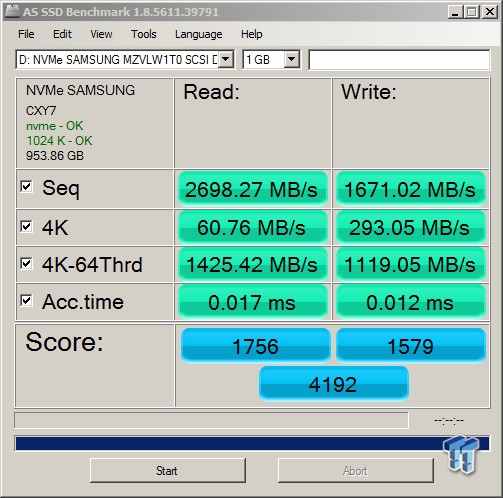
AS SSD
Version and / or Patch Used: 1.8.5611.39791
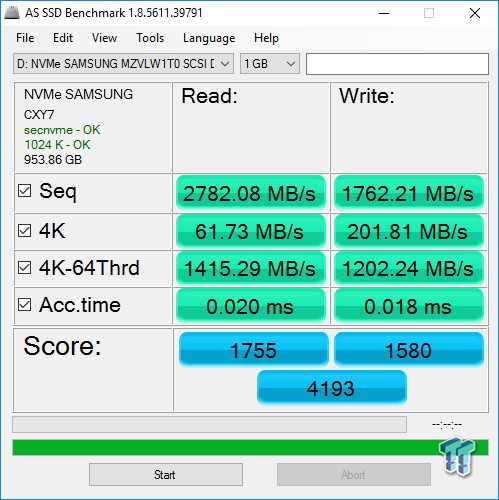
AS SSD determines the performance of SSDs. The tool contains four synthetic as well as three practice tests. The synthetic tests are to determine the sequential and random read and write performance of the SSD. We evaluate AS SSD performance in terms of overall score. We are looking for a minimum score of 2,000 when evaluating NVMe SSDs


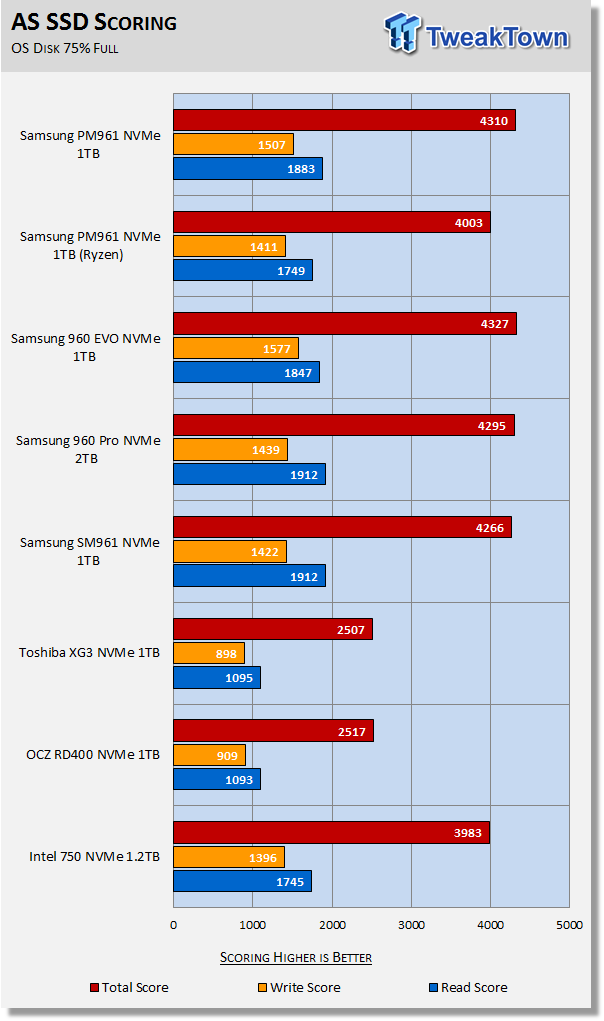
AS SSD is a demanding test, and the PM961 eats it alive, scoring over double our minimum of 2,000 on both platforms. The PM961 outscores the 960 EVO reading data, and the 960 EVO outscores the PM961 writing data. Overall, both drives deliver similar performance, but the PM961 is $85 bucks cheaper.
Benchmarks (OS) - Vantage, PCMark 7, PCMark 8 & SYSmark 2014 SE
Moderate Workload Model
We categorize these tests as indicative of a moderate workload environment.
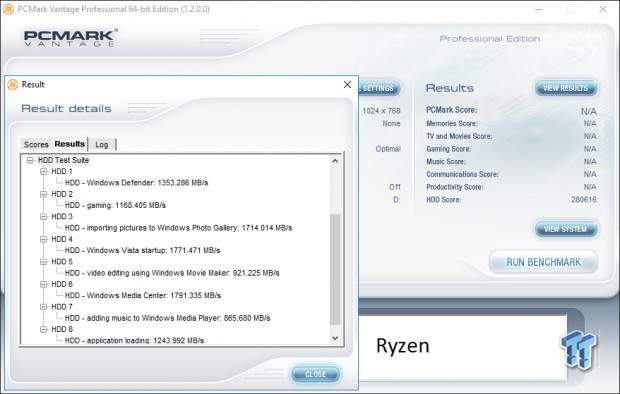
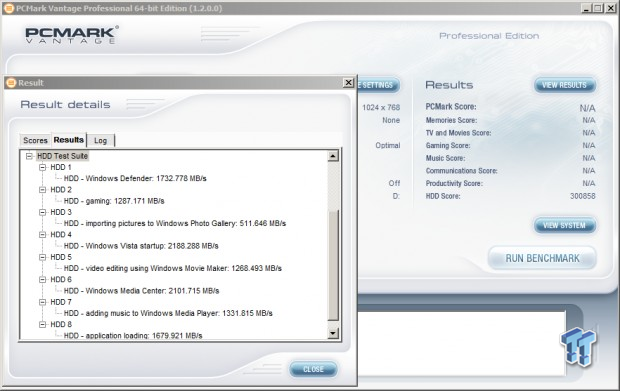
PCMark Vantage - Hard Disk Tests
Version and / or Patch Used: 1.2.0.0
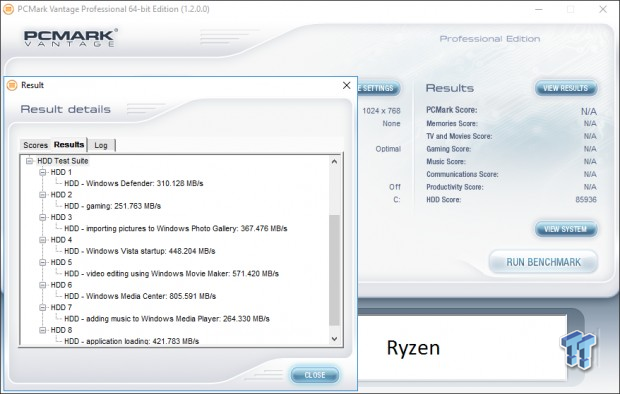
The reason we like PCMark Vantage is because the recorded traces are played back without system stops. What we see is the raw performance of the drive. This allows us to see a marked difference between scoring that other trace-based benchmarks do not exhibit. An example of a marked difference in scoring on the same drive would be empty vs. filled vs. steady state.
We run Vantage three ways. The first run is with the OS drive 75% full to simulate a lightly used OS volume filled with data to an amount we feel is common for most users. The second run is with the OS volume written into a "Steady State" utilizing SNIA's consumer guidelines. Steady state testing simulates a drive's performance similar to that of a drive that been subjected to consumer workloads for extensive amounts of time. The third run is a Vantage HDD test with the test drive attached as an empty, lightly used secondary device.
OS Volume 75% Full - Lightly Used


OS Volume 75% Full - Steady State

Secondary Volume Empty - FOB
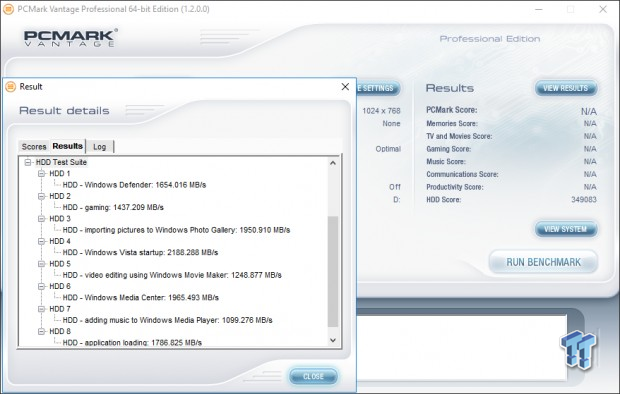
There's a big difference between an empty drive, one that's 75% full/used, and one that's in a steady state.
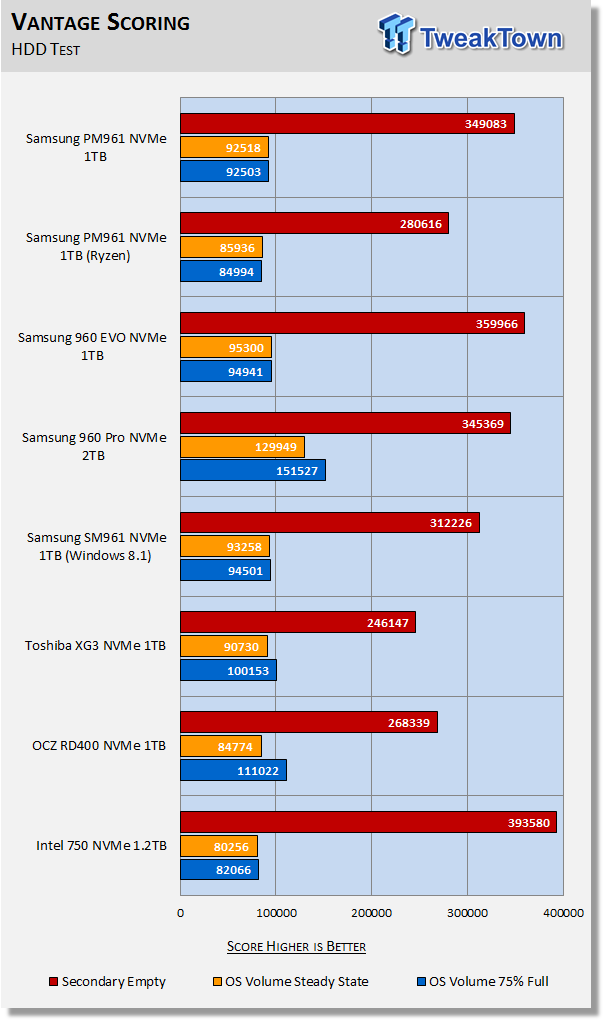
The important scores to pay attention to are "OS Volume Steady State" and "OS Volume 75% full." These two categories are most important because they are indicative of typical of consumer user states. When a drive is in a steady state, it means garbage collection is running at the same time it's reading/writing.
Focusing in on 75% full and steady state performance reveals the PM961 is an absolute beast when running consumer workloads. We used the numbers we had from running the SM961 on Windows 8.1 for our workload testing because the Windows 8.1 NVMe driver is vastly superior to the Windows 10 NVMe driver. We didn't get a chance to run the Samsung NVMe driver on the SM961 but had we done so the SM961 would have performed significantly better.
There is a substantial performance drop when running the drive on our Ryzen platform, due to its inferior low queue depth performance. Of particular note, both the PM961 and the 960 EVO don't really lose any performance when running in a steady state with workloads of this nature.
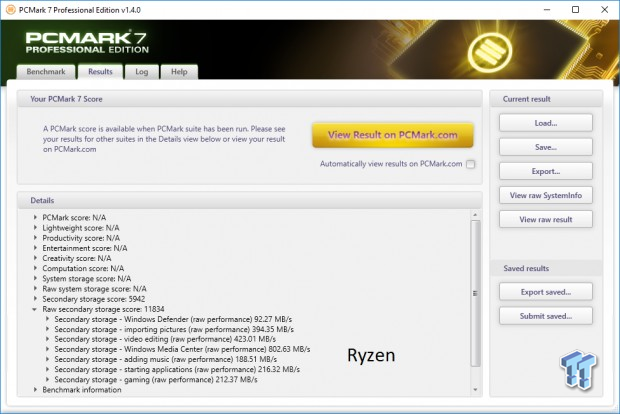
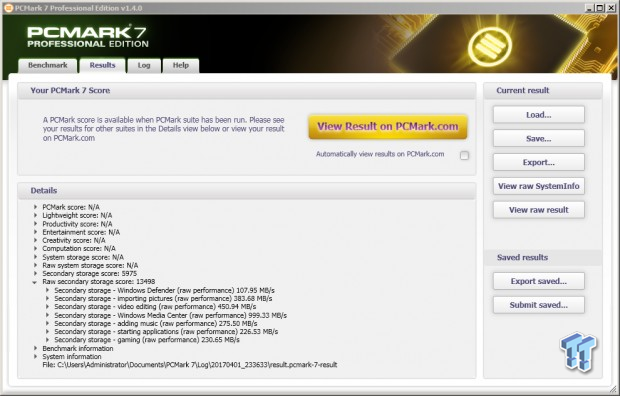
PCMark 7 - System Storage
Version and / or Patch Used: 1.4.0
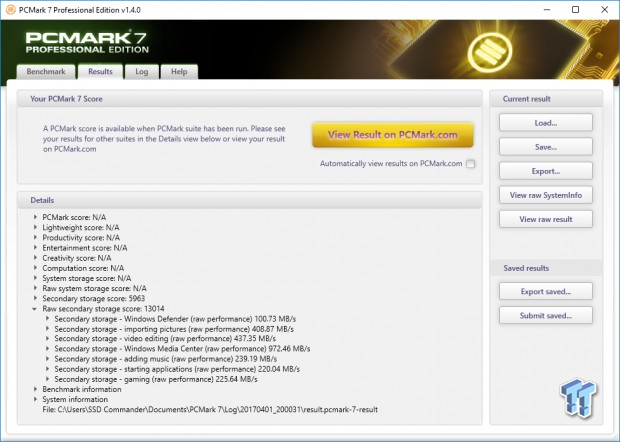
We will look to Raw System Storage scoring for evaluation because it's done without system stops and, therefore, allows us to see significant scoring differences between drives. When testing NVMe SSDs on PCMark 7, we are looking for a minimum score of 10,000.
OS Volume 75% Full - Lightly Used
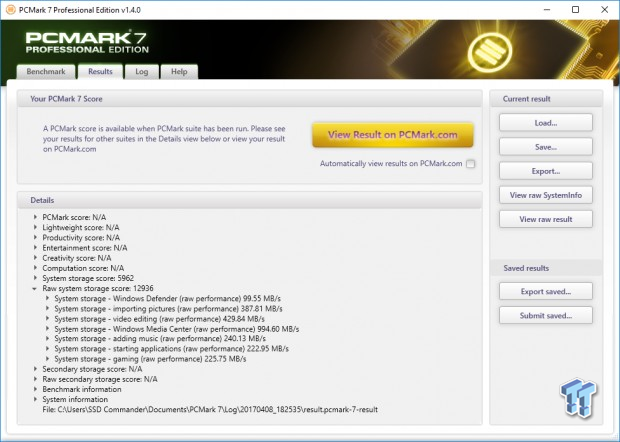
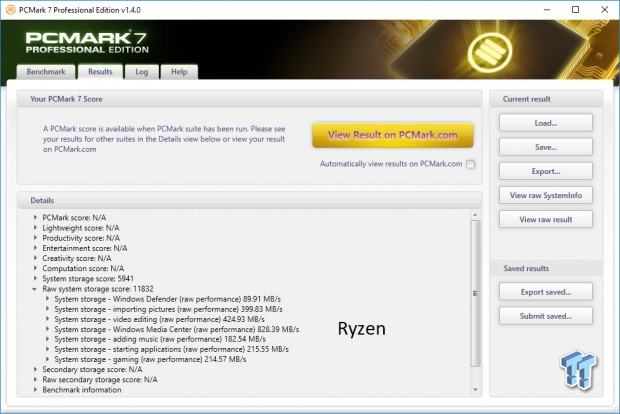
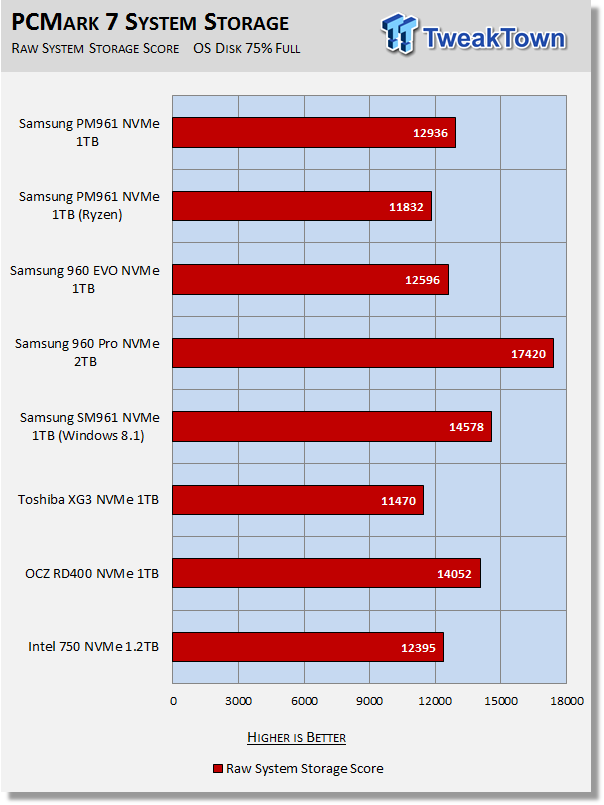
PCMark 7 more accurately represents real-world performance than does Vantage. The results of this test clearly demonstrate why we believe that the PM961 will deliver performance that is equivalent to the much more expensive 960 EVO. In fact, the PM961 manages to deliver a higher score. The results on our Ryzen platform are again significantly lower than on our Intel platform, but even so, the PM961 running on Ryzen easily surpasses our minimum score of 10,000.
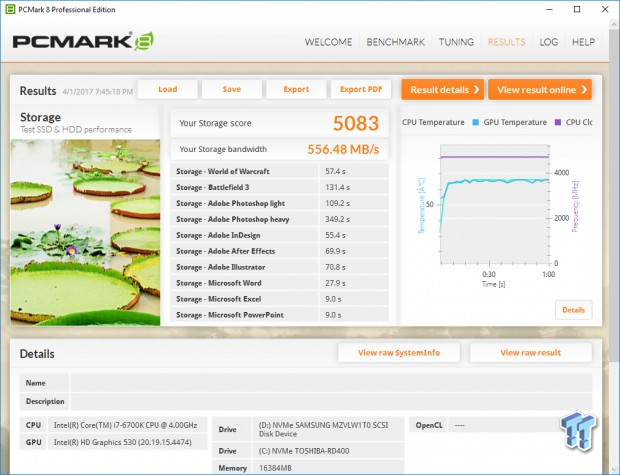
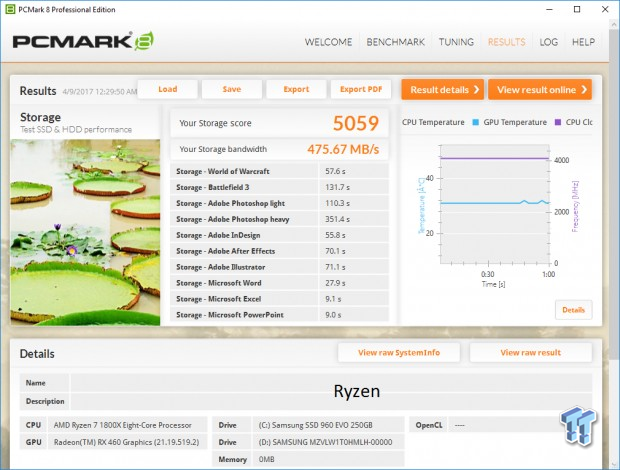
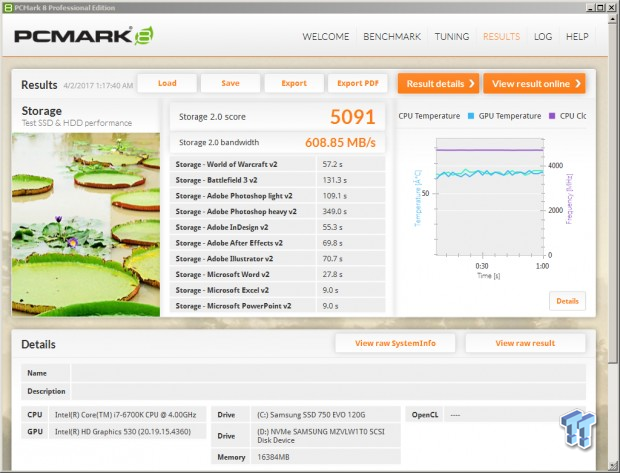
PCMark 8 - Storage Bandwidth
Version and / or Patch Used: 2.4.304
We use PCMark 8 Storage benchmark to test the performance of SSDs, HDDs, and hybrid drives with traces recorded from Adobe Creative Suite, Microsoft Office, and a selection of popular games. You can test the system drive or any other recognized storage device, including local external drives. Unlike synthetic storage tests, the PCMark 8 Storage benchmark highlights real-world performance differences between storage devices.
OS Volume 75% Full - Lightly Used

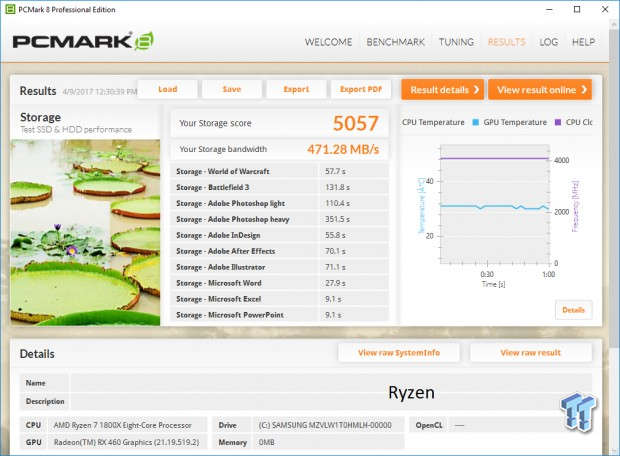
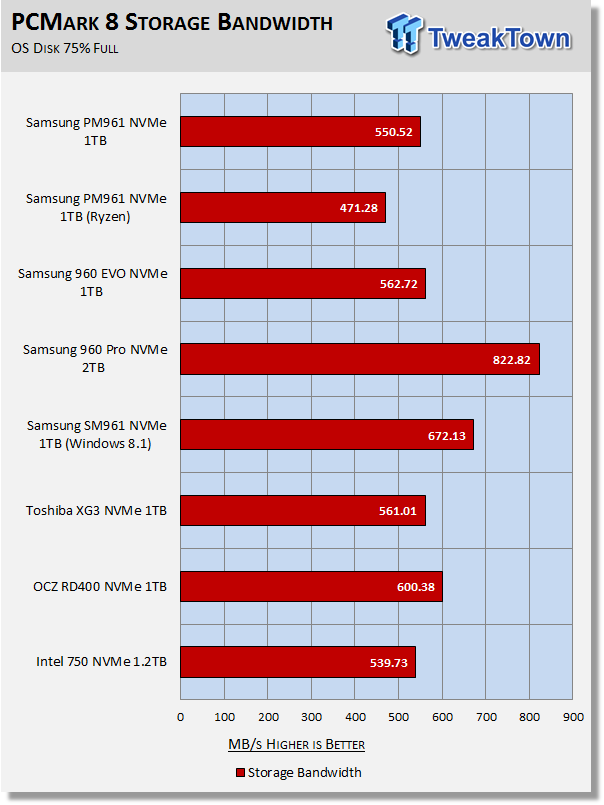
PCMark 8 is the most intensive moderate workload simulation we run. With respect to moderate consumer type workloads, this test is what we consider the best indicator of a drive's performance. The PM961 is running neck-in-neck with the more expensive 960 EVO. The difference in workload performance between the two drives is virtually negligible and the PM961, when purchased from MyDigitalDiscount, is about 20% cheaper than you will pay for a 1TB 960 EVO. Additionally, the 1TB PM961 is not overprovisioned, so you get 22GB more user space over the 960 EVO 1TB.
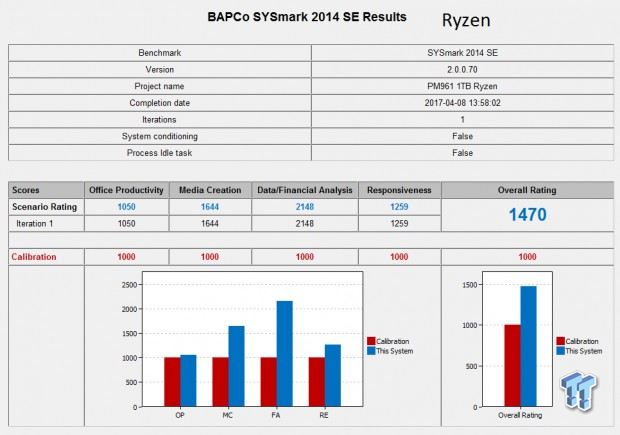
BAPCo SYSmark 2014 SE System Performance
Version and / or Patch Used: 2.0.0.70
SYSmark 2014 SE is considered the gold standard for testing system performance because it is an application based benchmark. This test gives us the ultimate in real-world results because it utilizes actual applications running on the system, instead of playing back recorded traces. If you want to know what kind of impact a particular SSD will have on your system's overall performance; this test will show you.
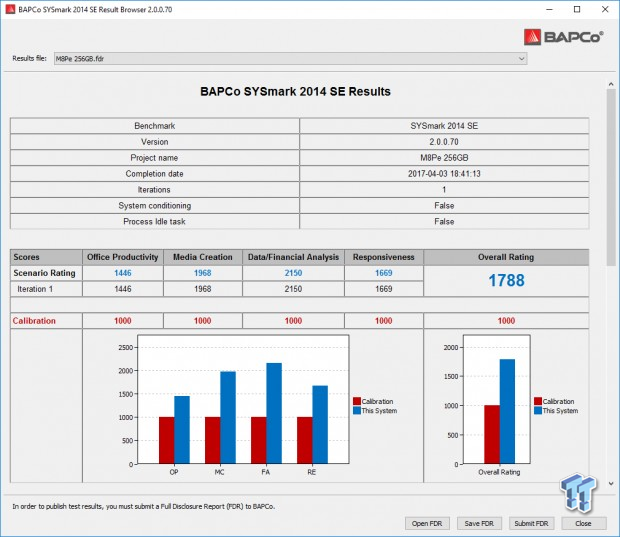
Disk performance has the greatest impact on the Responsiveness Score, so that is what we will focus on.
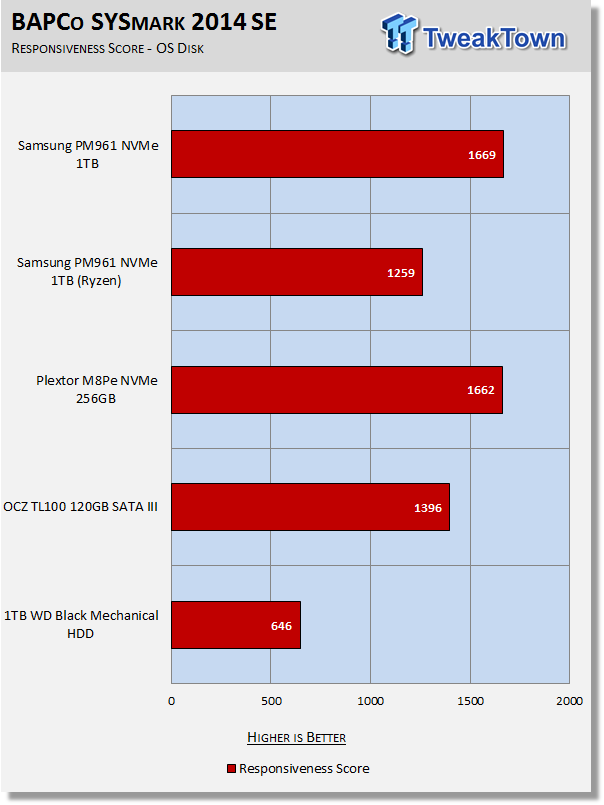
Our system is much more powerful than the calibration system (1000-point baseline) used by BAPCo, so we ran an OCZ TL100 120GB SATA III SSD to establish a comparison point relative to our test system. We will be running this test going forward, and we will add drives to our chart as we test them.
We don't have a lot of SSDs for comparison yet, but we can say that the Samsung PM961 delivers the best responsiveness score of any SSD we've tested to date. It is important to remember that this score is not solely based on the storage device and therefore it isn't a totally accurate representation of how much more responsive one storage device is over another. To demonstrate this fact just compare the PM961 running on our Ryzen platform to the same drive running on our Intel platform.
AMD has in the past stated that SYSmark is optimized for Intel, but both BAPCo and Intel deny that there is any built-in preference for Intel-based systems. We don't know who is right, but it is easy to see that Intel has a major advantage over AMD when testing with SYSmark.
Benchmarks (Secondary) - IOPS, Response & Transfer Rate
Iometer – Maximum IOPS
Version and / or Patch Used: Iometer 2014
We use Iometer to measure high queue depth performance. (No Partition)
Max IOPS Read
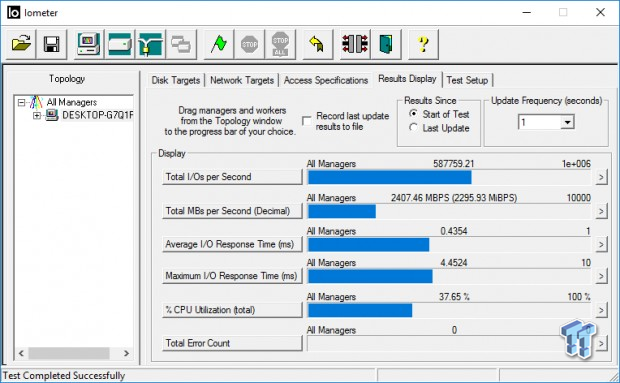
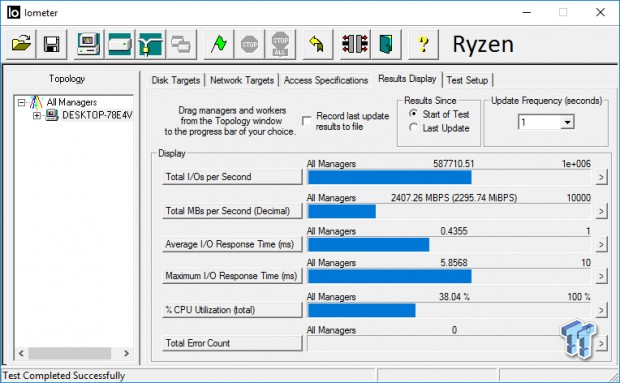
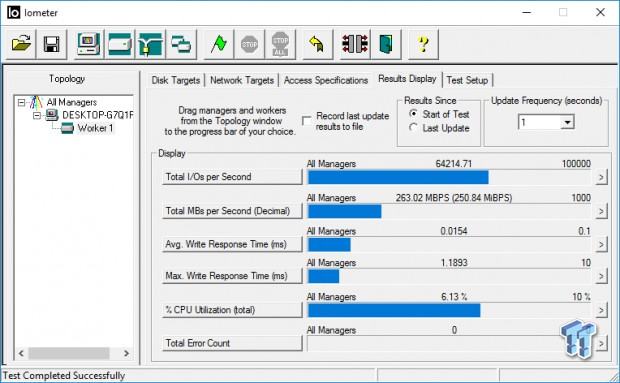
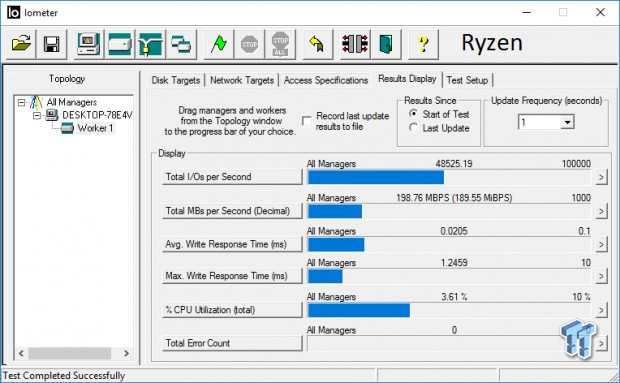
Max IOPS Write
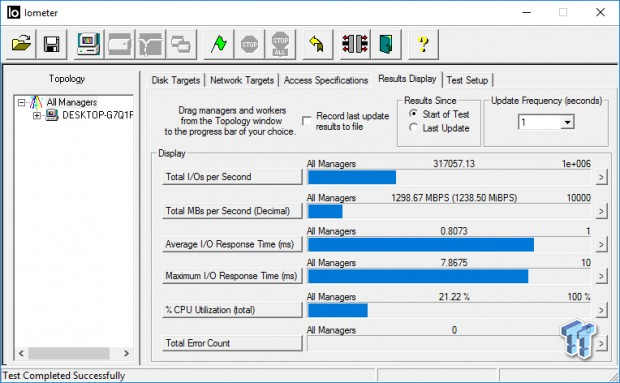
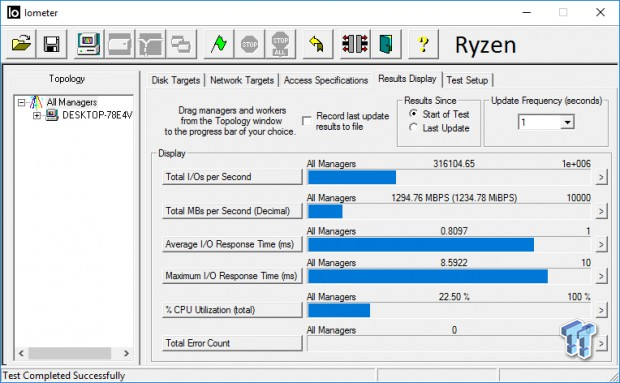
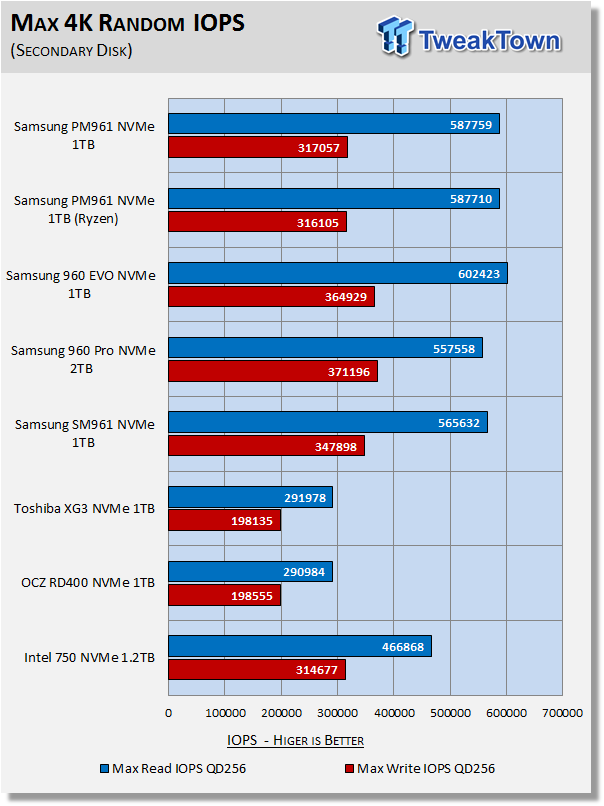
We test NVMe SSDs using eight threads at QD32, or QD256. We do this because we want to see what the drive can generate at its maximum attainable queue depth. Maximum random performance is similar between the two platforms at high queue depths, which is what we've seen throughout our testing.
Iometer – Disk Response
Version and / or Patch Used: Iometer 2014
We use Iometer to measure disk response times. Disk response times are measured at an industry accepted standard of 4K QD1 for both write and read. Each test runs twice for 30 seconds consecutively, with a 5-second ramp-up before each test. We partition the drive/array as a secondary device for this testing.
Avg. Write Response
Avg. Read Response
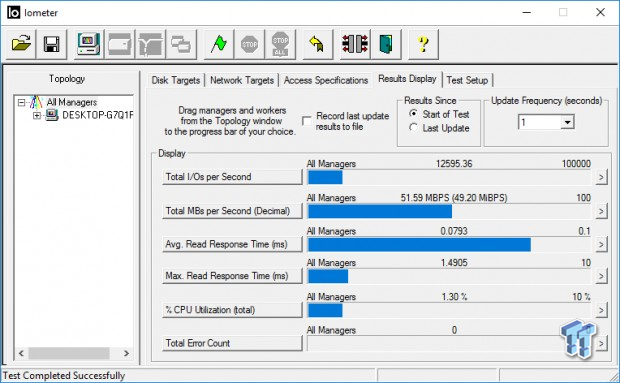
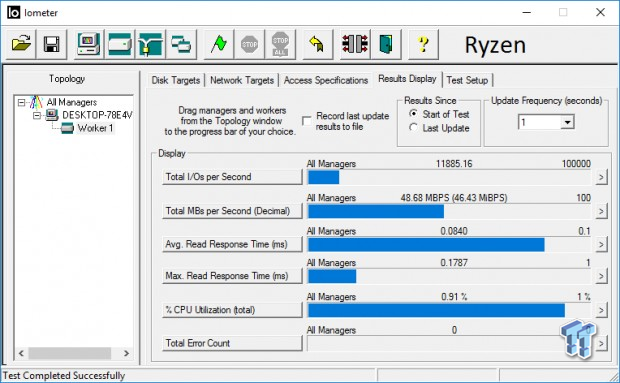
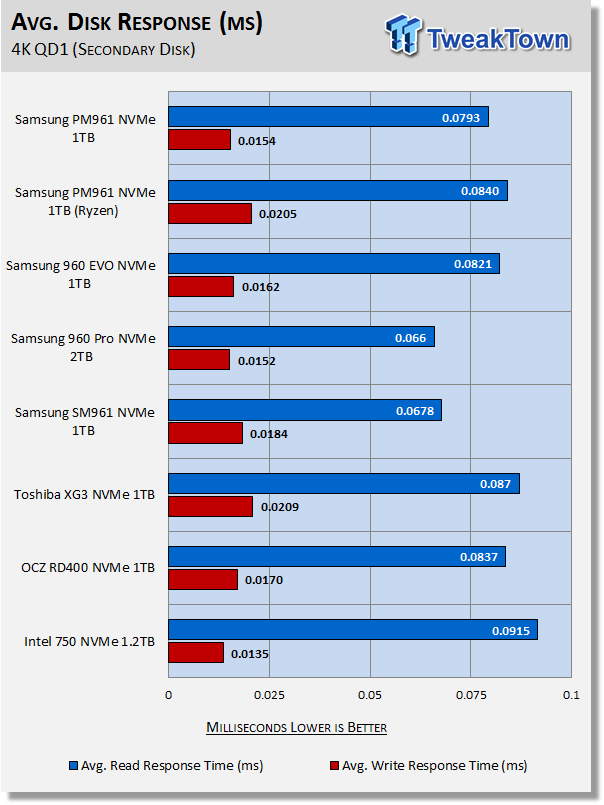
Disk response is significantly better (lower) on the Intel platform. Additionally, the results of our testing show the 1TB PM961 delivering better response than the 960 EVO 1TB.
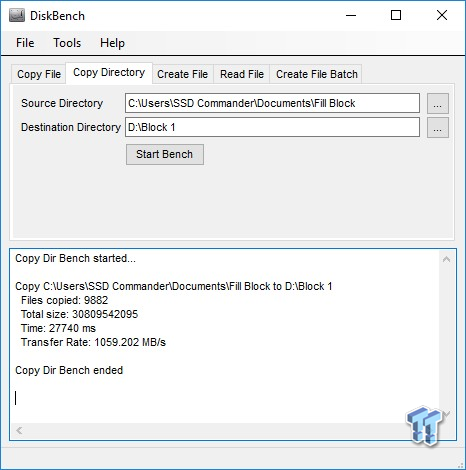
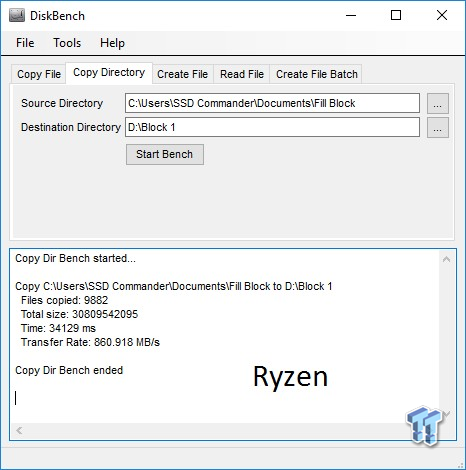
DiskBench – Transfer Rate
Version and / or Patch Used: 2.6.2.0
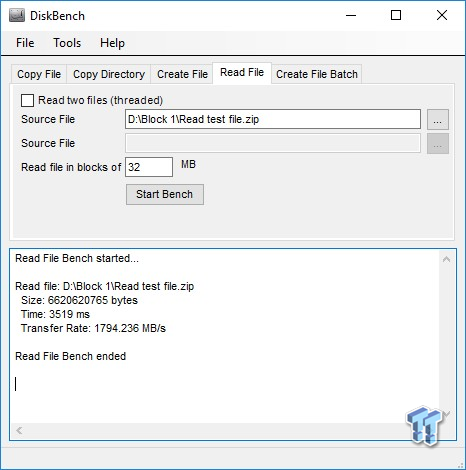
We use DiskBench to time a 28.6GB block (9,882 files in 1,247 folders) composed primarily of incompressible sequential and random data as it's transferred from our Toshiba RD400 1TB NVME SSD to our test drive. We then read from a 6GB zip file that's part of our 28.6GB data block to determine the test drive's read transfer rate. Our system is restarted prior to the read test to clear any cached data, ensuring an accurate test result.
Write Transfer Rate
Read Transfer Rate
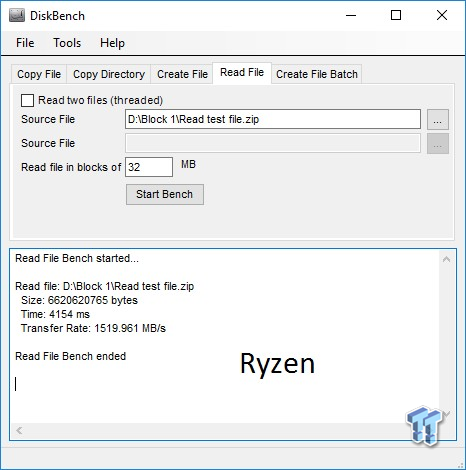
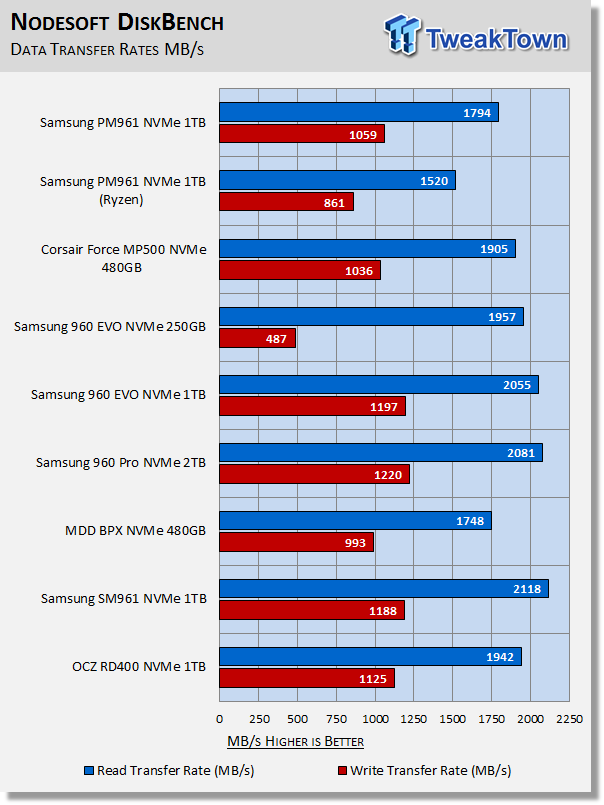
We recently upgraded our test system to Windows 10 build 14393. With that upgrade, write transfer rates almost doubled. The reason for this, as far as we know, is that CPU power switching modes have been relaxed on the latest version of Windows 10. We included the NVMe drives we've tested to date on this build of Windows 10. If you needed a good reason to upgrade to Windows 10 build 14393; this is a good reason.
Transfer rates on our Ryzen platform are a bit lower than we would like to see.
Benchmarks (Secondary Volume) – PCMark 8 Extended
Futuremark PCMark 8 Extended
Heavy Workload Model
PCMark 8's consistency test simulates an extended duration heavy workload environment. PCMark 8 has built-in, command line executed storage testing. The PCMark 8 Consistency test measures the performance consistency and the degradation tendency of a storage system.
The Storage test workloads are repeated. Between each repetition, the storage system is bombarded with a usage that causes degraded drive performance. In the first part of the test, the cycle continues until a steady degraded level of performance has been reached. (Steady State)
In the second part, the recovery of the system is tested by allowing the system to idle and measuring the performance after 5-minute long intervals. (Internal drive maintenance: Garbage Collection (GC)) The test reports the performance level at the start, the degraded steady-state, and the recovered state, as well as the number of iterations required to reach the degraded state and the recovered state.
We feel Futuremark's Consistency Test is the best test ever devised to show the true performance of solid state storage in an extended duration heavy workload environment. This test takes on average 13 to 17 hours to complete and writes somewhere between 450GB and 14,000GB of test data depending on the drive. If you want to know what an SSDs steady state performance is going to look like during a heavy workload, this test will show you.
Here's a breakdown of Futuremark's Consistency Test:
Precondition phase:
1. Write to the drive sequentially through up to the reported capacity with random data.
2. Write the drive through a second time (to take care of overprovisioning).
Degradation phase:
1. Run writes of random size between 8*512 and 2048*512 bytes on random offsets for 10 minutes.
2. Run performance test (one pass only).
3. Repeat 1 and 2 for 8 times, and on each pass increase the duration of random writes by 5 minutes.
Steady state phase:
1. Run writes of random size between 8*512 and 2048*512 bytes on random offsets for 50 minutes.
2. Run performance test (one pass only).
3. Repeat 1 and 2 for 5 times.
Recovery phase:
1. Idle for 5 minutes.
2. Run performance test (one pass only).
3. Repeat 1 and 2 for 5 times.
Storage Bandwidth
PCMark 8's Consistency test provides a ton of data output that we use to judge a drive's performance.
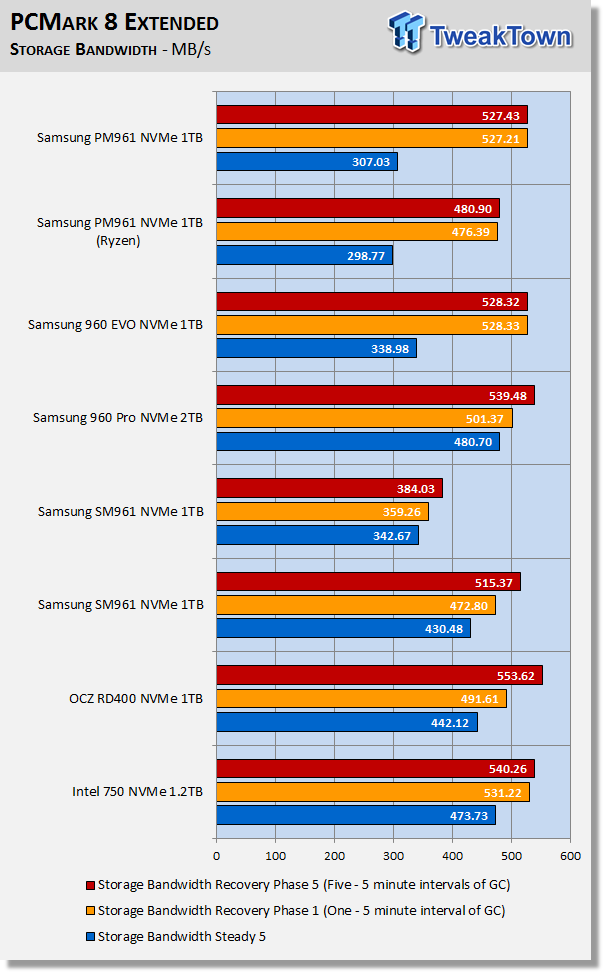
We consider steady state bandwidth (the blue bar) our test that carries the most weight in ranking a drive/arrays heavy workload performance. Performance after Garbage Collection (GC) (the orange and red bars) is what we consider the second most important consideration when ranking a drive's heavy workload performance.
In a steady-state, the PM961 performs similarly on both platforms. The Intel platform provides much better recovery performance over Ryzen. We will point out the when we ran the more powerful SM961 we did so using the in-box Windows 10 NVMe driver, which is why its recovery performance is so bad. Had we run the Samsung NVMe driver on the SM961 its performance would have been more in-line with the 960 Pro.
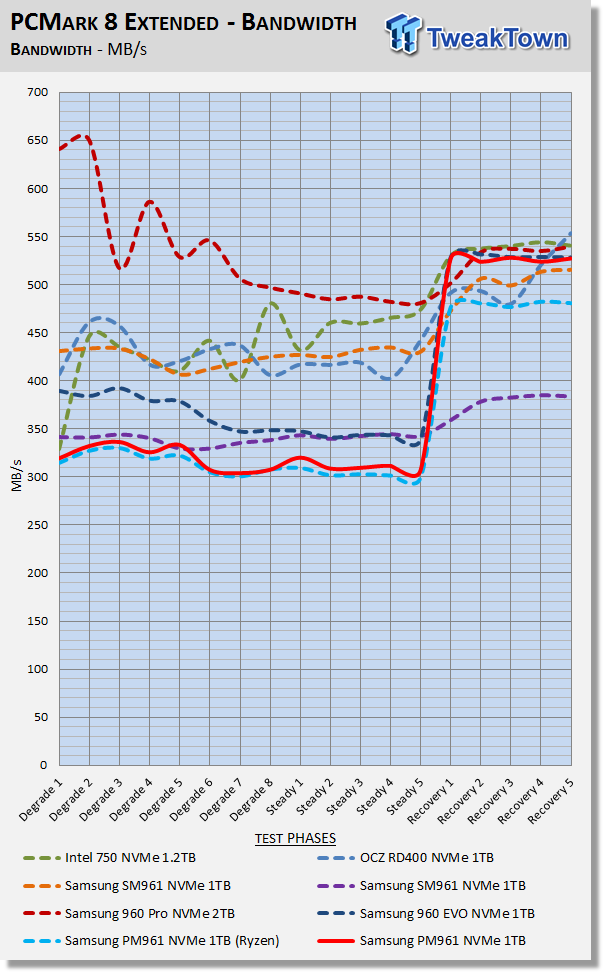
Storage Bandwidth Per Phase
We chart our test subject's storage bandwidth as reported at each of the test's 18 trace iterations. This gives us a good visual perspective of how our test subjects perform as testing progresses. This chart sheds more light on how the drives perform as they progress through the testing phases.
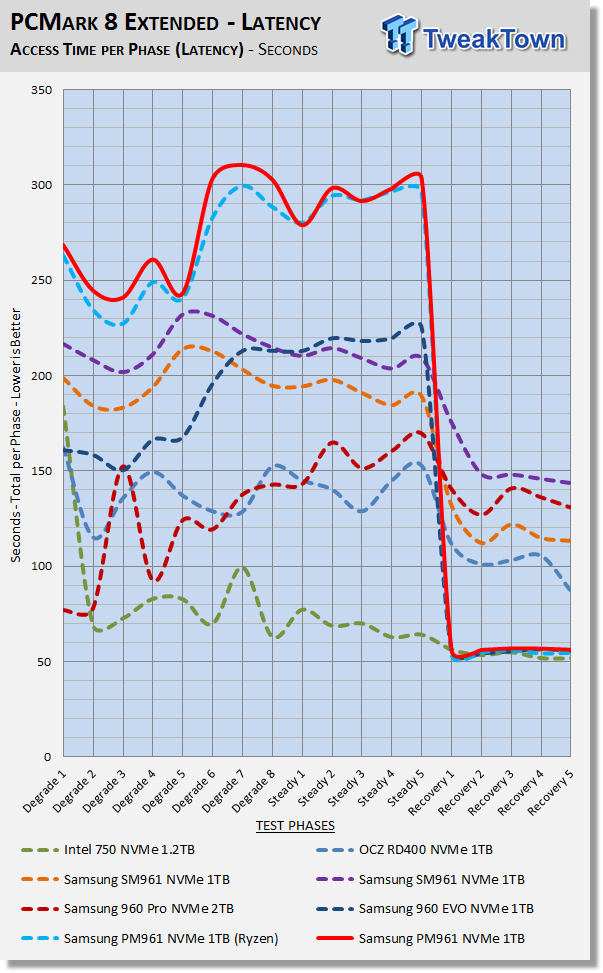
Total Access Time (Latency)
We chart the total time the disk is accessed as reported at each of the test's 18 trace iterations. This helps shed some light on how the drive performs at each of the 18 phases of this test.
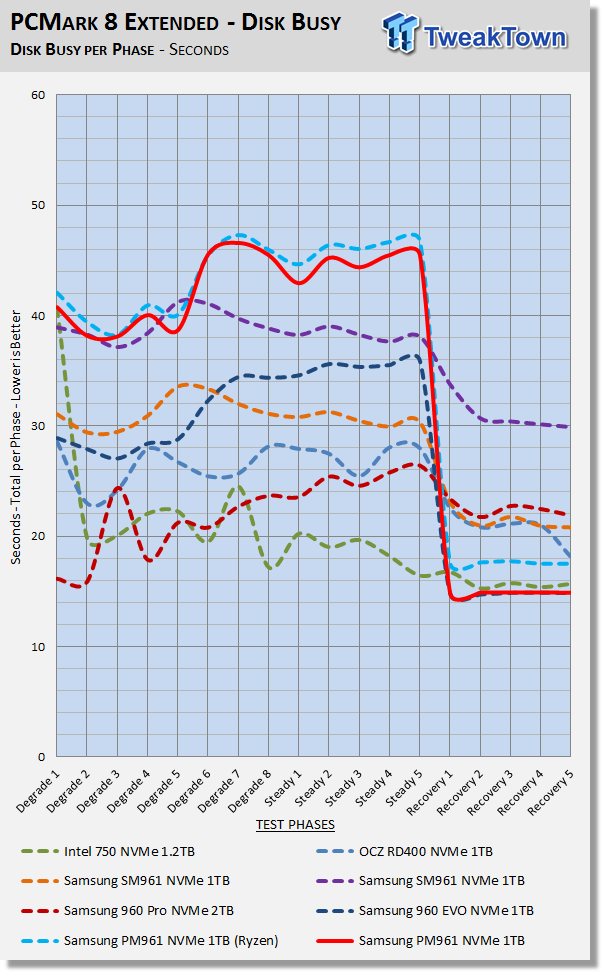
Disk Busy Time
Disk Busy Time is how long the disk is busy working. We chart the total time the disk is working as reported at each of the tests 18 trace iterations.
Data Written
We measure the total amount of random data that our test drive/array is capable of writing during the degradation phases of the consistency test. Pre-conditioning data is not included in the total. The total combined time that degradation data is written to the drive/array is 470 minutes. This can be very telling. The better a drive/array can process a continuous stream of random data; the more data will be written.
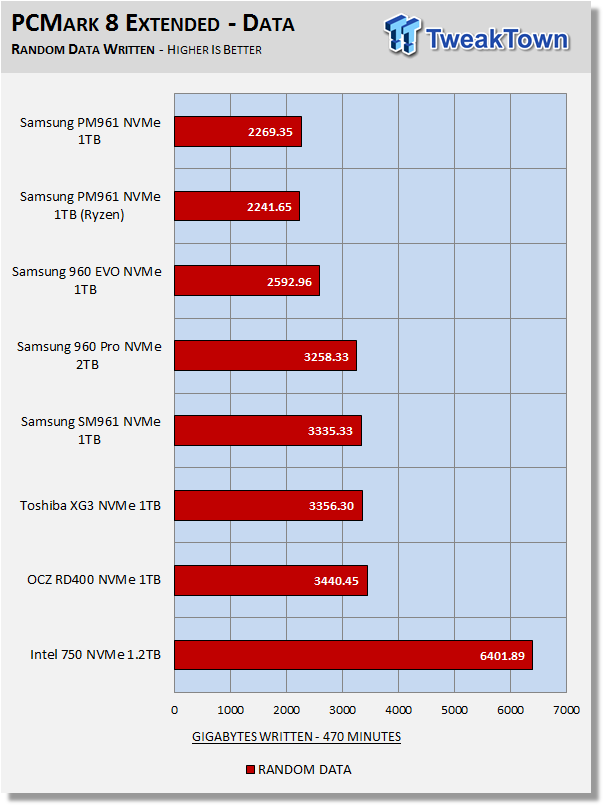
Overprovisioning and write latency are the biggest factors that determine the outcome of this portion of the test. Like we saw from the degrade and steady-state phases above, the PM961 performs similarly on both the Intel and Ryzen platforms. Intel's aging SSD 750 1.2TB dominates this test due to big-time overprovisioning and superior write latency.
Benchmarks (Secondary Volume) – 70/30 Mixed Workload
70/30 Mixed Workload Test (Sledgehammer)
Version and / or Patch Used: Iometer 2014
Heavy Workload Model
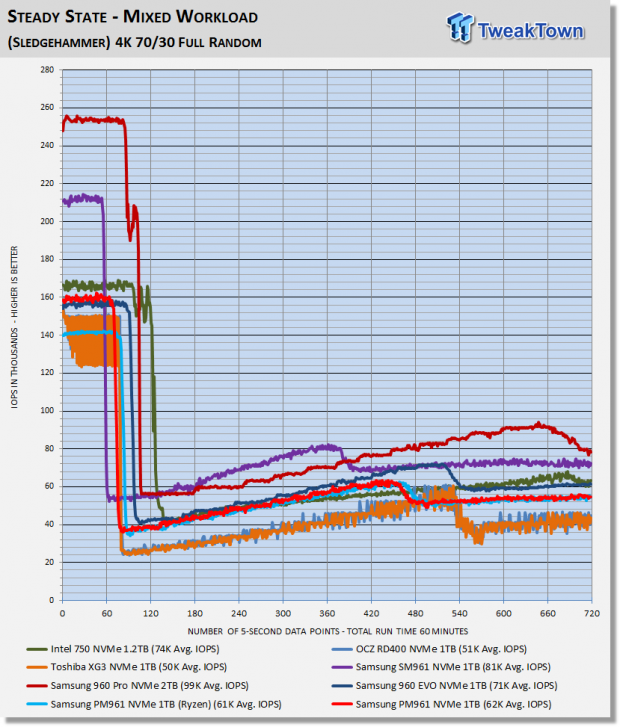
This test hammers a drive so hard we've dubbed it "Sledgehammer." Our 70/30 Mixed Workload test is designed to simulate a heavy-duty enthusiast/workstation steady-state environment. We feel that a mix of 70% read/30% write, full random 4K transfers best represents this type of user environment. Our test allows us to see the drive enter into and reach a steady state as the test progresses.
Phase one of the test preconditions the drive for 1 hour with 128K sequential writes. Phase two of the test runs a 70% read/30% write, full random 4K transfer workload on the drive for 1 hour. We log and chart (phase two) IOPS data at 5-second intervals for 1 hour (720 data points). 60 data points = 5 minutes.
What we like about this test is that it reflects reality. Everything lines up, as it should. Consumer drives don't outperform Enterprise-Class SSDs that were designed for enterprise workloads. Consumer drives based on old technology are not outperforming modern Performance-Class SSDs, etc.
Mirroring what we saw with our PCMark 8 extended testing, the PM961 starts off better on the Intel platform, but as it descends into a steady-state, the drive performs similarly on both platforms.
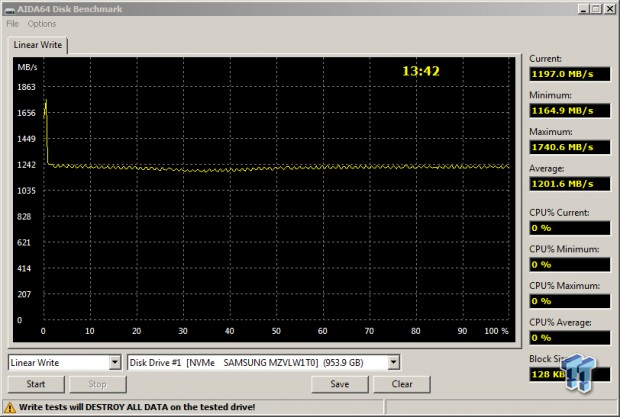
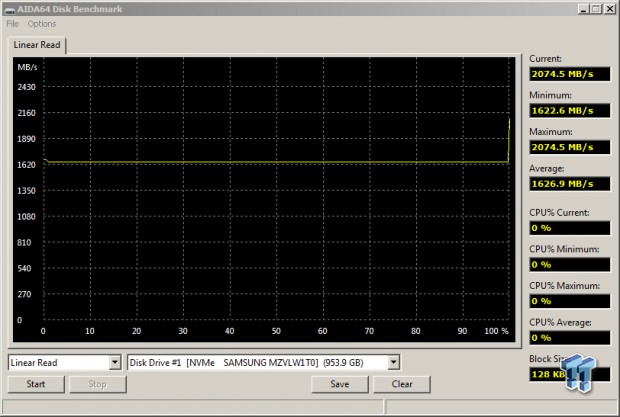
Maxed-Out Performance (MOP)
This testing is just to see what the drive is capable of in an FOB (Fresh Out of Box) state under optimal conditions. We are utilizing empty volumes of Windows 10 and Windows Server 2008 R2 64-bit for this testing.
Windows 10 MOP (Intel)
Samsung PM961 1TB M.2 NVMe PCIe SSD

Windows 10 MOP (AMD)
Samsung PM961 1TB M.2 NVMe PCIe SSD
Windows Server 2008 R2 MOP (Intel only)
Samsung PM961 1TB M.2 NVMe PCIe SSD


Final Thoughts
The purpose of this review is to show you our readers that the Samsung PM961 delivers virtually the same performance as the wildly popular 960 EVO. The PM961 also has the advantage of an additional 22GB of usable storage space over the 960 EVO. Combine this with a price tag that is $85 lower than the 1TB 960 EVO, and we feel the winner is clearly the 1TB PM961.
MyDigitalDiscount is offering you the rare opportunity to purchase the PM961 and doing so with a deeply discounted price tag. There is no question that the 1TB Samsung PM961 is an elite performing SSD, and with a full 1TB of capacity, it offers plenty of space for your super-fast storage needs.
With the BPX and Samsung PM961, MyDigitalDiscount is offering the best value in high-performance solid state storage.
Samsung's second generation NVMe SSDs are clearly the best performing full-size SSDs on the market, and if you haven't yet experienced the earth shattering performance they bring to the table first-hand, then you are missing out on the best game in town. We encourage you to go big and fast with the 1TB Samsung PM961 from MyDigitalDiscount; you will be glad you did.
Samsung PM961 1TB M.2 NVMe PCIe SSD is TweakTown recommended.
Pros:
- Synthetic Performance
- Workload performance
- VNAND
Cons:
- Green PCB
 HighPoint Rocket 1604L Gen5 x16 NVMe Software RAID AIC Review: half the price with full 59 GB/s speed
 UGREEN NASync DXP4800 GT Review: powerful 4-bay NAS with AMD Ryzen and dual 10GbE ports
 Phison E37T SSD Controller Exclusive Preview - The Fastest DRAMless SSD Platform Yet
 Seagate FireCuda X1070 4TB SSD Review - A New Mainstream Contender
 ASUSTOR Lockerstor 2 Gen2+ AS6702T v2 NAS Review - Fast Performance
 Sony CEO sells $4.7 million worth of stock days after PlayStation announces disc phase out
 Black Flag Resynced is a win for Ubisoft, pirate remaster achieves 2 million sales in 24 hours
 Giveaway: Win an NZXT H6 RGB+ Case, Kraken Elite AIO, RGB Fans and 1200W PSU
 Ubisoft responds to Black Flag Resynced DLC critics by telling them they're 'not a requirement'
 NVIDIA is reportedly preparing the GeForce RTX 5090 SE to sit between the RTX 5080 and 5090
 id founder John Carmack comments on sad fate of studio
 Report: Minecraft profits used to fund Xbox games portfolio
 Assassin's Creed Black Flag Resynced has $80 worth of cosmetics and time-saving DLC
 Need For Speed seemingly on ice as Criterion becomes a Battlefield studio
 51 Ubisoft employees who worked on the successful Assassin's Creed Black Flag Resynced have just been laid off
 Micron 6600 ION 245.76TB Enterprise SSD Review - Best in Class Programming Speeds
 MOZA MA3F EFCM Flight Control Module Review: authentic Airbus A320 autopilot panel for simulators
 Turtle Beach Stealth Pro II Wireless Gaming Headset Review - Premium Sound, Fantastic Features
 MOZA MGX1000 Instrument Panel Review: a realistic Garmin G1000 replica for immersive flight sims
 Simagic Zeus Formula Steering Wheel Review: premium build and advanced inputs for F1 racing
 GIGABYTE X870E Aero X3D Dark Wood Review - A woody goody
 The Super Mario Galaxy Movie (2026) 4K Ultra HD Blu-ray Review
 KTC H49S66 5K2K (5120x1440) 49-inch 180Hz Gaming Monitor Review
 Next Level Racing ERS3 Haptic Seat Review: immersive sim racing comfort with integrated haptics
 Don't sell your Windows laptop until you do these things
 6 PC cleaning mistakes to avoid for safer hardware maintenance
 Phison and Intel Take Aim at Local AI's Memory Wall with aiDAPTIV
 How to Remap Keyboard Keys in Windows using Microsoft PowerToys
 7 tips to organize your Windows files for faster, easier access
 Intel Arc G3 Extreme first impressions with MSI's Claw 8 EX AI+ - Incredible power for an extreme price
 How to fix Wi-Fi Adapter Not Working on Windows laptops: troubleshooting tips
 Hisense U7SG 4K TV: Modern Entertainment for the New Age
 6 underrated Microsoft Word features worth using to boost your productivity
 Level Up Your PC Gaming with these Fantastic ASUS Prime Day Deals on GPUs, Motherboards, and More