


Our Verdict
Introduction, Drive Specifications, Pricing and Availability
Toshiba first announced their XG3 series of NVMe SSDs at Flash Memory Summit last year. The XG3 family of SSDs is currently selling to OEM clients in capacities of 128GB to 1024GB. Obviously, the 1TB model is by far the most interesting of the bunch because it is double the current capacity of Samsung's competing OEM NVMe M.2 SM951 product line. The ability for consumers to order a laptop with 1TB of NVMe goodness built right in is very appealing to mobile enthusiasts and work professionals alike.
The problem with OEM drives is they are generally not sold through normal retail channels, so the chances of getting your hands-on the XG3 as a standalone piece of hardware are very limited. However, in the case of Toshiba's XG3, getting your hands-on one is really just a matter of waiting for the consumer version to launch. A consumer version of the XG3 will come via OCZ Storage Solutions (a Toshiba company) as their first consumer-based NVMe SSD, the upcoming RevoDrive 400. The RevoDrive 400 will be sold as an aftermarket product through normal retail channels.
Physically, we expect the RevoDrive 400 will utilize identical components. There will be differences, though. OCZ states they will be utilizing a different firmware, perhaps more performance oriented. And, OCZ's SSD GURU toolbox compatibility will make drive maintenance a breeze for RevoDrive 400 users. As enthusiasts, we need to be able to easily secure erase, clone, and optimize our after-market SSDs. System retailers (OEMs) and the consumers that buy their products typically have no need for user managed SSD maintenance, which is the reason Toshiba doesn't offer any "toolbox" software for the XG3.
Reliability is the number one requirement for any OEM product, and Toshiba has a reputation for building SSDs that are rock solid. One of the reasons for this reputation is Toshiba's proprietary error correction technology. The XG3 employs Toshiba's proprietary Quadruple Swing-By Code (QSBC) error-correction technology, a highly efficient error correction code (ECC), which helps protect customer data from corruption, improves reliability, and extends the life of Toshiba SSDs. QSBC is rumored to be even more efficient than LDPC.
In a notebook environment, power consumption is a primary concern. Toshiba engineered the XG3 family of SSDs for power efficiency, through lower power state modes and the use of components engineered for power efficiency.
Intel and Samsung offer a proprietary NVMe driver for their NVMe SSDs, but Toshiba does not. The XG3 utilizes the standard Microsoft NVMe driver that comes baked into Windows 8-10. This makes sense because the XG3 is an OEM SSD, and not needing an additional driver for best performance makes setup easier for OEMs. We don't know if we will see a proprietary NVMe driver with the RevoDrive 400, but we would certainly love to see an F6 NVMe driver made available for the hordes of Windows 7 users out there. An F6 driver would make it easy for Windows 7 users to utilize the XG3 and upcoming RevoDrive 400 as their boot disk. So far, only Intel seems to get this.
We've had our eyes on the XG3 ever since it was first announced, primarily because we feel that the XG3 is a drive that can give Samsung's OEM SM951 and even the consumer-based 950 Pro a run for their money when it comes to what we care about most - performance. Additionally, Toshiba's XG3 is the only non-Samsung M.2 form factor NVMe SSD on the market. It's one thing to make a blazing fast NVMe SSD like Intel's 750 Series, but it's a whole other thing to do it with a tiny M.2 "gum stick" drive.
Our Latest SSD Review Coverage
- Samsung 990 2TB SSD Review - Ninth Gen QLC at PCIe Gen4 Speeds
- Phison E37T SSD Controller Exclusive Preview - The Fastest DRAMless SSD Platform Yet
- Seagate FireCuda X1070 4TB SSD Review - A New Mainstream Contender
- Micron 3610 2TB SSD Review - DRAMless QLC at 11,000 MB/s
- SK hynix Platinum P51 2TB SSD Review - A Powerful Gen5 Alternative
We've finally got the XG3, at the capacity point we most desire, on our bench; so let's see what Toshiba's latest and greatest client SSD is capable of delivering.
Specifications
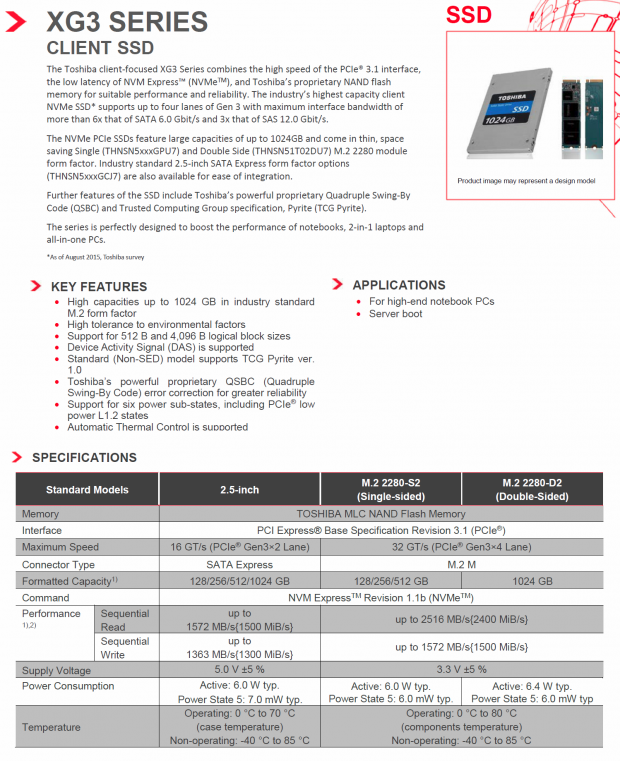
The XG3 is available in four capacities: 128GB, 256GB, 512GB, and 1024GB (1-terabyte). There are two versions: a 2-lane 2.5" form factor SATA Express version and the 4-lane M.2 2280 form factor version we have on the bench today.
Sequential specifications show read up to 2516MB/s and write up to 1572MB/s. Toshiba does not specify random performance. Power consumption for the 1TB M.2 is Active 6.4W typical and Low Power State 6.0mW typical.
Drive Details
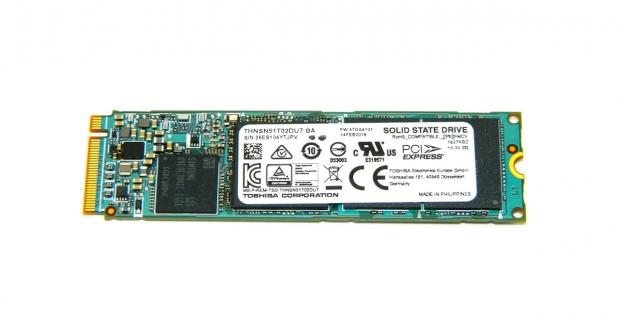
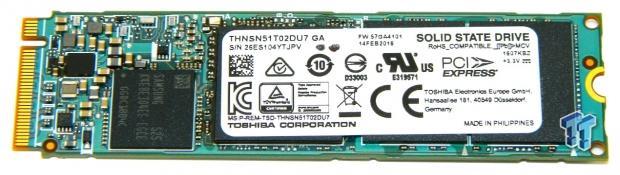
Toshiba XG3 1TB M.2 NVMe PCIe SSD
This side of the PCB features a manufacturer's label. The label covers the drive's controller and two of the drive's four flash packages. The label lists the drive's part number, serial number, shipping firmware, and date of manufacture along with various bits of other relevant information.

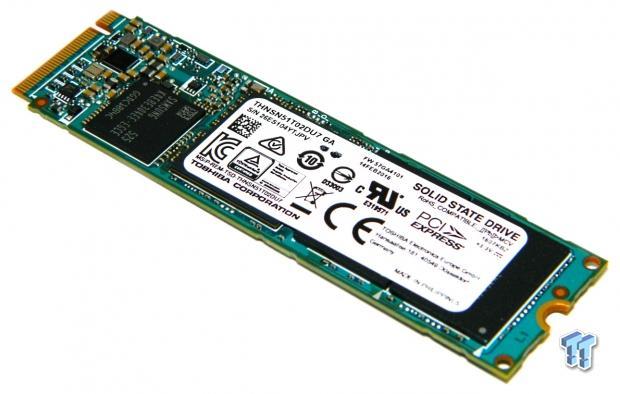
This side of the PCB features two of the drive's four flash packages.
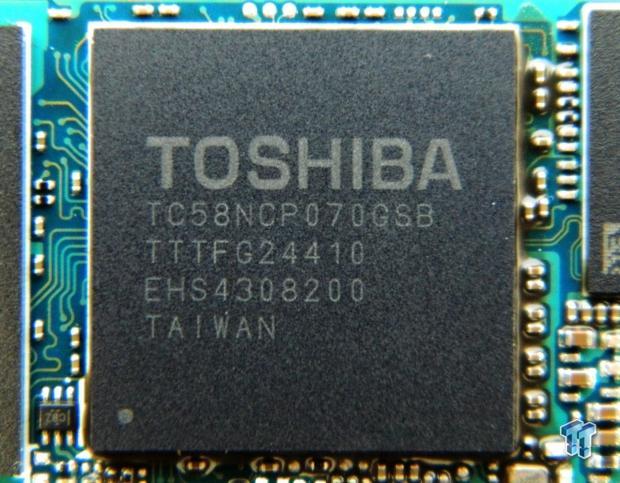
The drive's proprietary NVMe controller.
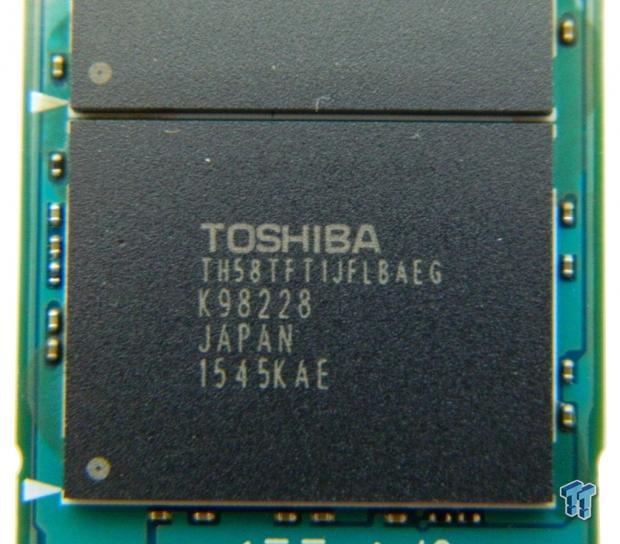
One of the drive's four 256GB Toshiba 15nm MLC NAND flash packages.
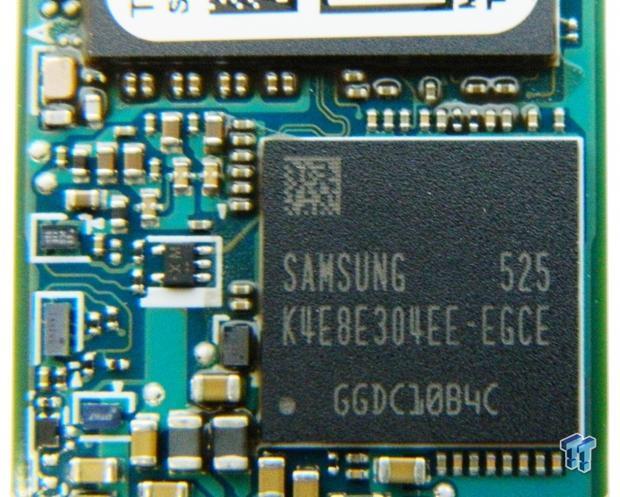
The drive's 1GB DDR3 DRAM cache package.
Test System Setup and Drive Properties
Jon's Consumer PCIe SSD Review Test System Specifications
- Motherboard: ASRock OC Formula Z170 - Buy from Amazon / Read our review
- CPU: Intel Core i7 6700K @ 4.7GHz - Buy from Amazon / Read our review
- Cooler: Swiftech H2O-320 Edge - Buy from Amazon / Read our review
- Memory: Corsair Vengeance LPX DDR4 16GB 3200MHz - Buy from Amazon
- Video Card: Onboard Video
- Case: IN WIN X-Frame - Buy from Amazon / Read our review
- Power Supply: Seasonic Platinum 1000 Watt Modular - Buy from Amazon / Read our review
- OS: Microsoft Windows 10 Professional 64-bit - Buy from Amazon
- Drivers: Intel RAID option ROM version 14.6.0.1029 and MS standard NVMe driver
We would like to thank ASRock, Crucial, Intel, Corsair, RamCity, IN WIN, and Seasonic for making our test system possible.
Drive Properties
The majority of our testing is performed with our test drive as our boot volume. Our boot volume is 75% full for all OS Disk "C" drive testing to replicate a typical consumer OS volume implementation. We feel that most of you will be utilizing your SSDs for your boot volume and that presenting you with results from an OS volume is more relevant than presenting you with empty secondary volume results.
System settings: Cstates and Speed stepping are both disabled in our systems BIOS. Windows High-Performance power plan is enabled. Windows write caching is enabled, and Windows buffer flushing is disabled. We are utilizing Windows 10 Pro 64-bit OS for all of our testing except for our MOP (Maxed-Out Performance) benchmarks where we switch to Windows Server 2012 R2 64-bit.
Synthetic Benchmarks – ATTO & Anvil Storage Utilities
ATTO
Version and / or Patch Used: 2.47
ATTO is a timeless benchmark used to provide manufacturers with data used for marketing storage products.

Sequential read/write transfers max out at an impressive 2,697/1644 MB/s. Keep in mind this is our OS volume, and it is filled to 75% of its total capacity.
Sequential Write

Zotac's Sonix runs away with this test, because of the way it handles ATTO's compressible data. The XG3 is able to deliver the second highest sequential write rate.
Sequential Read
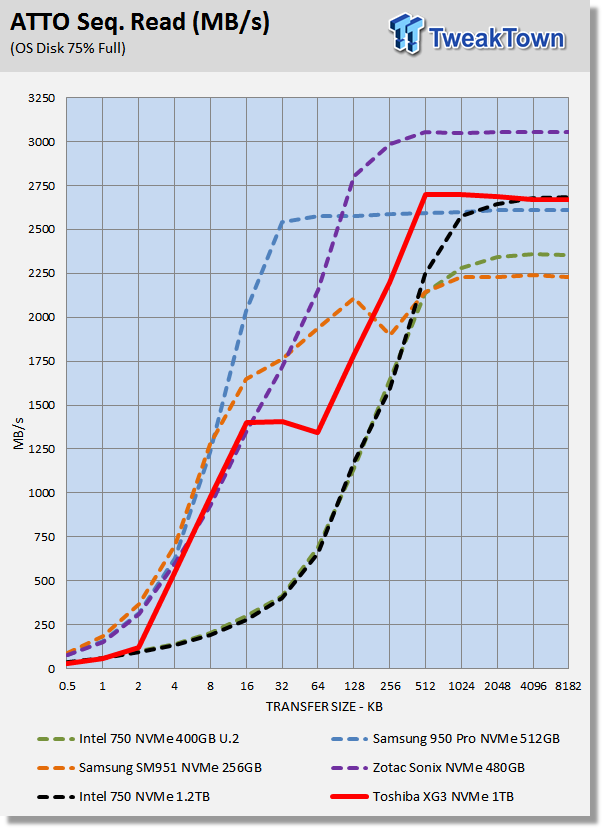
The XG3 displays a much better performance curve than the Intel drives. We observe a momentary lapse in performance at 32-64KB transfers. This is likely because we just finished filling the SSD with data before running this test. The Samsung drive's display better small-file performance up to 512KB.
Anvil Storage Utilities
Version and / or Patch Used: 1.1.0
Anvil's Storage Utilities is a storage benchmark designed to measure the storage performance of SSDs. The Standard Storage Benchmark performs a series of tests; you can run a full test or just the read or write test, or you can run a single test, i.e. 4k QD16.

Scoring
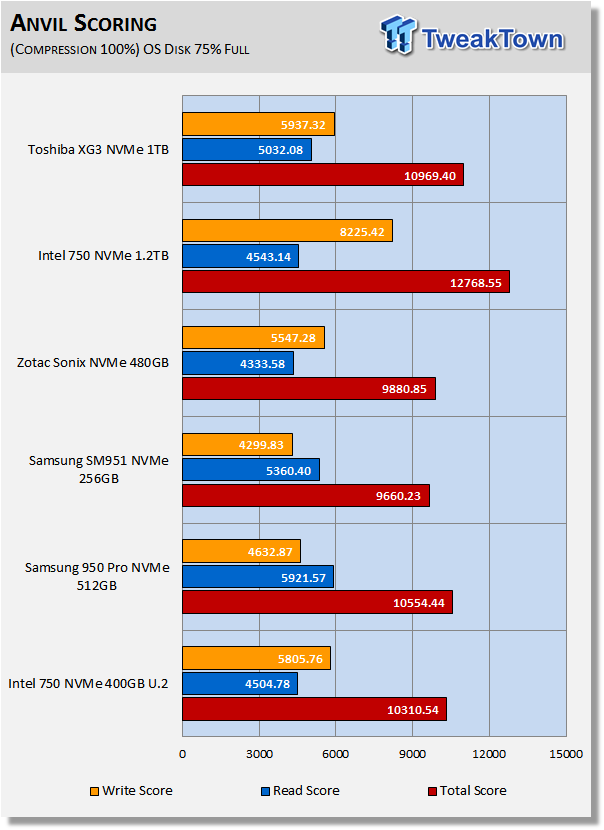
Anvil's scoring gives a good indication of a drive's overall performance. In terms of overall scoring, the XG3 is able to best Samsung's competing solutions as well as Intel's 750 Series 400GB U.2 SSD. This lends credence to our original assumption that the XG3 might be capable of battling it out with the SM951 for the best performing OEM consumer SSD crown.
(Anvil) Read IOPS through Queue Depth Scale

The XG3 slightly outperforms the Intel 750's up to QD16 (consumer queue depth). The Samsung drives display the best performance up to QD32.
(Anvil) Write IOPS through Queue Scale
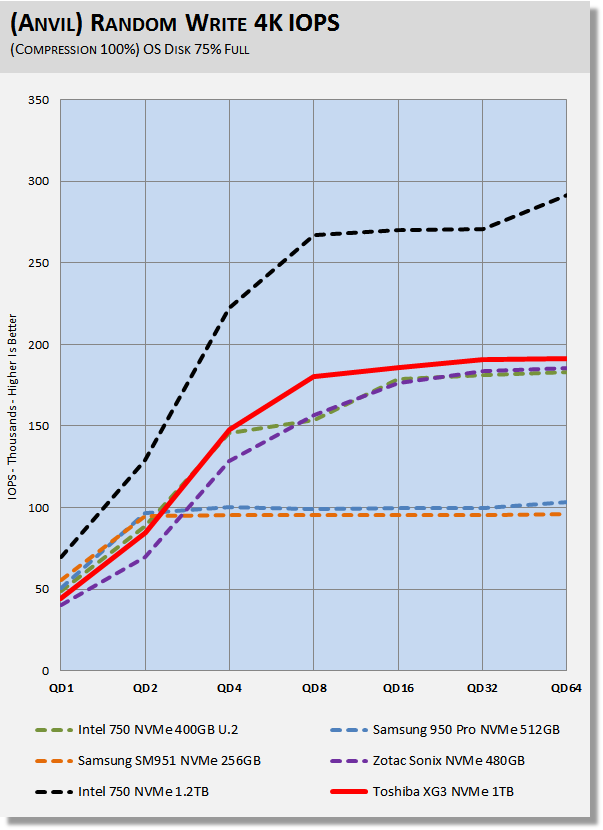
Intel's 1.2 TB 750 easily wins this test. The Samsung SSDs max out at QD2-4. At QD4 and above, the XG3 outperforms all but the 1.2TB Intel 750.
Synthetic Benchmarks – CrystalDiskMark & AS SSD
CrystalDiskMark
Version and / or Patch Used: 3.0 Technical Preview
CrystalDiskMark is disk benchmark software that allows us to benchmark 4k and 4k queue depths with accuracy. Note: Crystal Disk Mark 3.0 Technical Preview was used for these tests since it offers the ability to measure native command queuing at QD4.
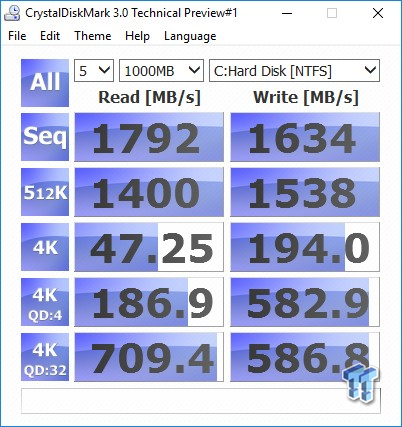
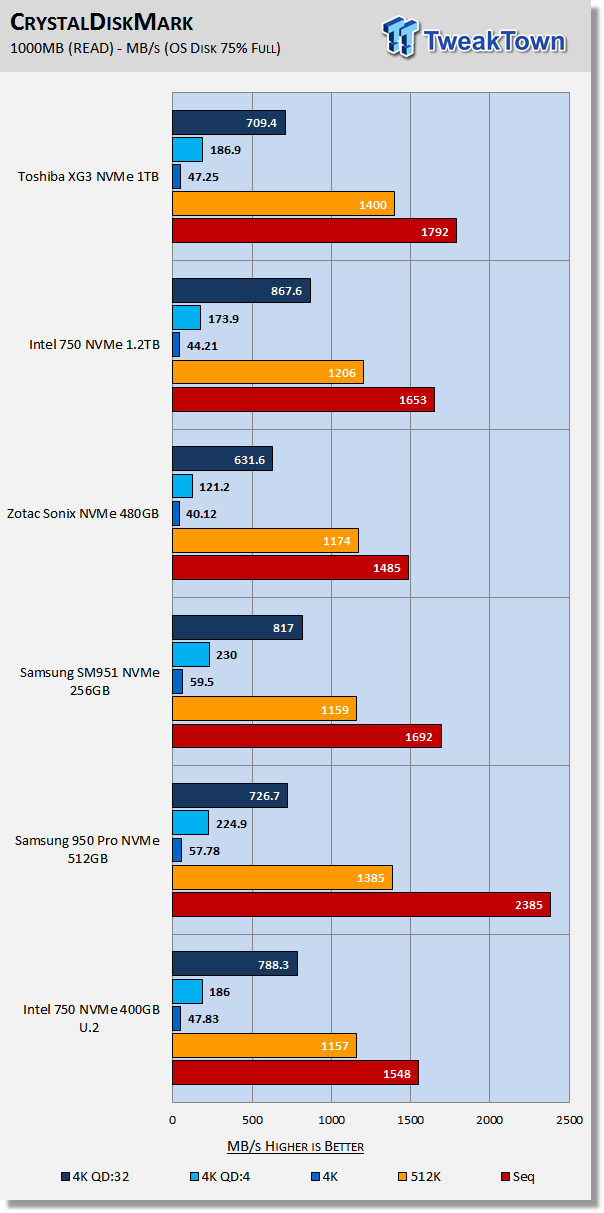
The XG3 is capable of delivering performance that overall exceeds that of Intel's monster 1.2TB 750 Series SSD. The 950 Pro wins this test, but the XG3 is right on its heels.

We will notch this as a win for the XG3. It has far better sequential write performance than Intel's 750 series, and better random 4K QD4 & QD32 write performance than the Samsung offerings.
AS SSD
Version and / or Patch Used: 1.7.4739.38088
AS SSD determines the performance of SSDs. The tool contains four synthetic as well as three practice tests. The synthetic tests are to determine the sequential and random read and write performance of the SSD.
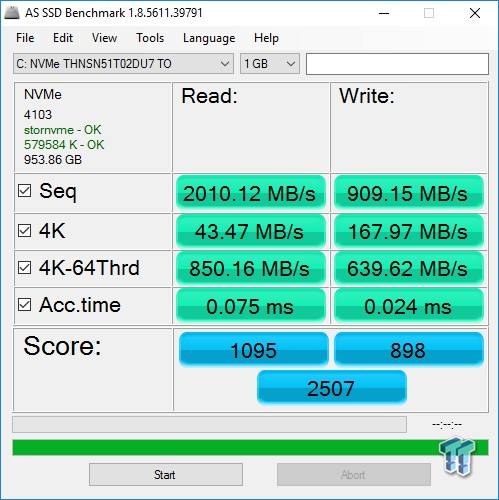

AS SSD is a demanding test, and the XG3 loses a significant amount of sequential write performance in comparison to CDM. This is because the drive is loaded up with data. Intel's 750 Series SSDs dominate this test. The XG3 outscores the 950 Pro and SM951 on the write portion of this test, however, they both outperform the XG3 on the read portion of the test.
Benchmarks (OS) - PCMark Vantage, PCMark 7 & PCMark 8
Moderate Workload Model
We categorize these tests as indicative of a moderate workload environment.
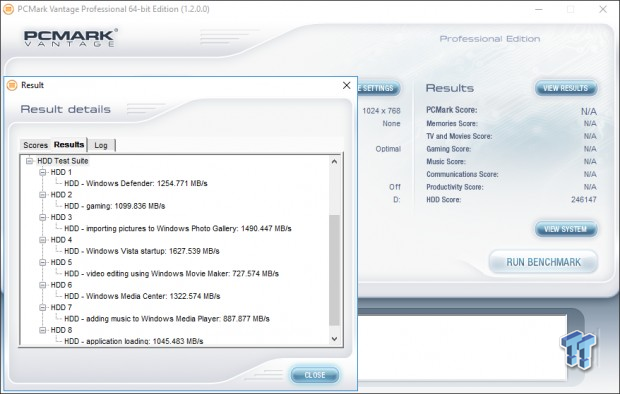
PCMark Vantage - Hard Disk Tests
Version and / or Patch Used: 1.2.0.0
The reason we like PCMark Vantage is because the recorded traces are played back without system stops. What we see is the raw performance of the drive. This allows us to see a marked difference between scoring that other trace-based benchmarks do not exhibit. An example of a marked difference in scoring on the same drive would be empty vs. filled vs. steady state.
We run Vantage three ways. The first run is with the OS drive 75% full to simulate a lightly used OS volume filled with data to an amount we feel is common for most users. The second run is with the OS volume written into a "Steady State" utilizing SNIA's guidelines. Steady state testing simulates a drive's performance similar to that of a drive that been subjected to consumer workloads for extensive amounts of time. The third run is a Vantage HDD test with the test drive attached as an empty, lightly used secondary device.
OS Volume 75% Full - Lightly Used

OS Volume 75% Full - Steady State

Secondary Volume Empty - FOB
There's a big difference between an empty drive, one that's 75% full/used, and one that's in a steady state.
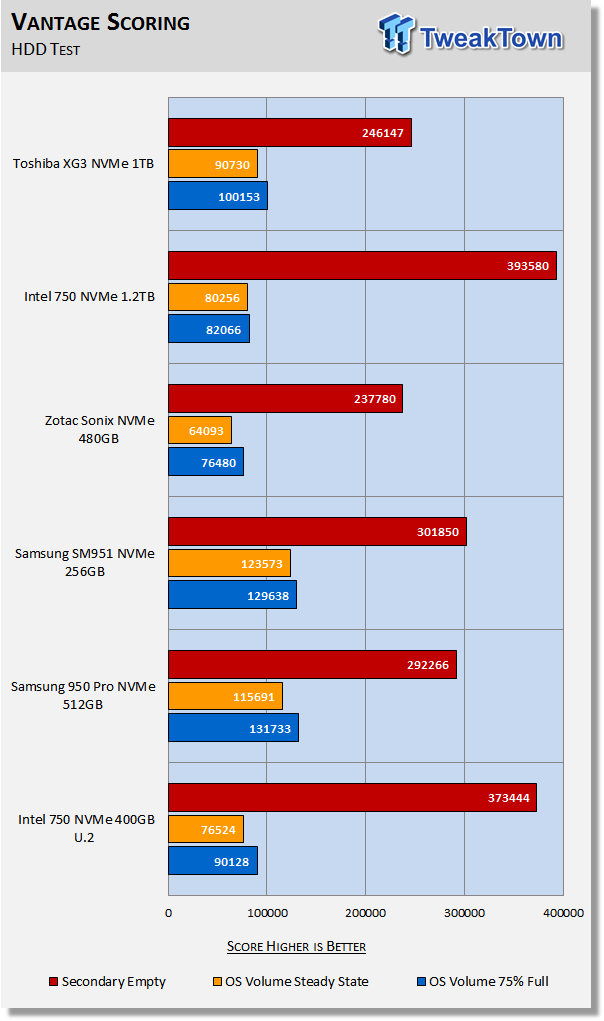
The important scores to pay attention to are "OS Volume Steady State" and "OS Volume 75% full." These two categories are most important because they are indicative of typical of consumer user states. When a drive is in a steady state, it means garbage collection is running at the same time it's reading/writing. This is exactly why we focus on steady state performance.
This is the first time a non-Samsung consumer-based SSD has been able to hit 100K at 75% full. Steady-state performance checks in at 90K, which is 10K better than Intel's 1.2TB 750 SSD. Samsung's NVMe SSDs have always dominated our moderate workload testing, and it looks like this trend will continue albeit with much less of a cushion than before.
PCMark 7 - System Storage
Version and / or Patch Used: 1.4.0
We will look to Raw System Storage scoring for evaluation because it's done without system stops and, therefore, allows us to see significant scoring differences between drives.
OS Volume 75% Full - Lightly Used
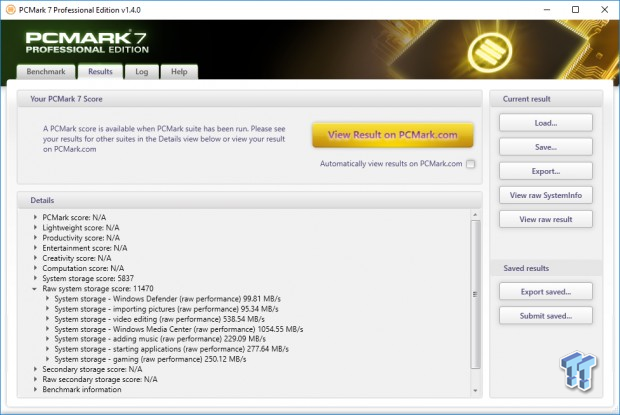
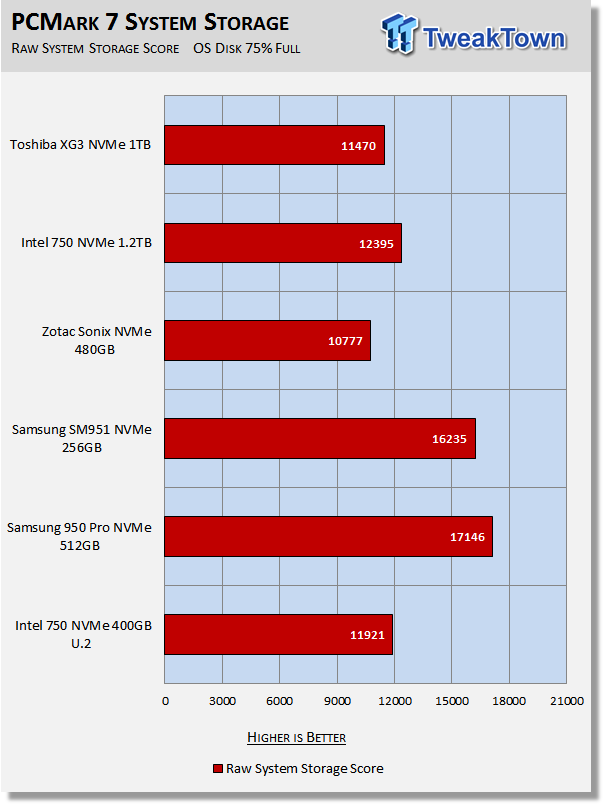
This time, Intel's 750 series is able to best Toshiba's XG3. It's not by much, though. Samsung's offerings continue to display class-leading moderate workload performance due to their superior 4K QD1 read performance.
PCMark 8 - Storage Bandwidth
Version and / or Patch Used: 2.4.304
We use PCMark 8 Storage benchmark to test the performance of SSDs, HDDs, and hybrid drives with traces recorded from Adobe Creative Suite, Microsoft Office, and a selection of popular games. You can test the system drive or any other recognized storage device, including local external drives. Unlike synthetic storage tests, the PCMark 8 Storage benchmark highlights real-world performance differences between storage devices.
OS Volume 75% Full - Lightly Used

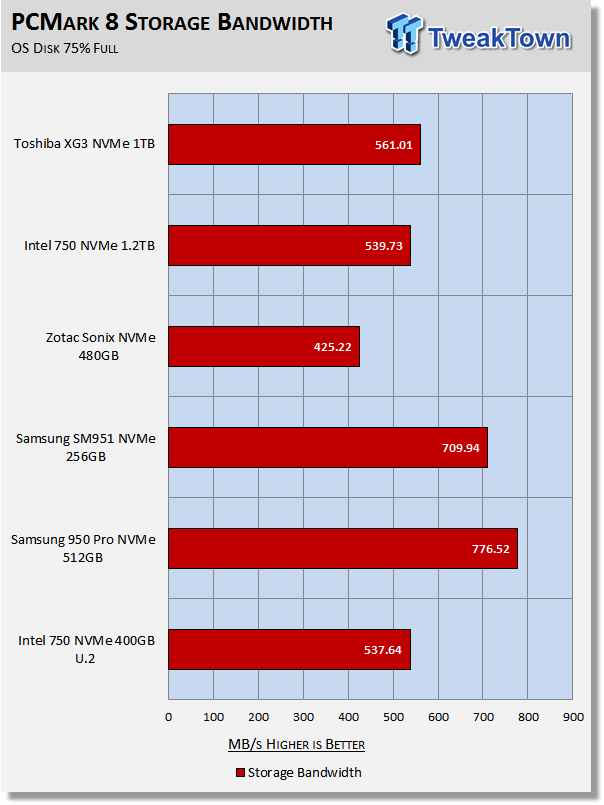
PCMark 8 is the most intensive moderate workload simulation we run. With respect to moderate consumer type workloads, this test is what we consider the best indicator of a drive's performance.
The XG3 cannot catch Samsung's offerings, but the XG3 once again outperforms Intel's 750 Series SSDs. Based on our moderate workload testing, we feel the XG3 is the third best performing consumer-based NVMe SSD on the market today, only slightly outperformed by the SM951 and 950 Pro.
Benchmarks (Secondary) - IOPS, Response & Transfer Rate
Iometer – Maximum IOPS
Version and / or Patch Used: Iometer 2014
We use Iometer to measure high queue depth performance. (No Partition)
Max IOPS Read

Max IOPS Write

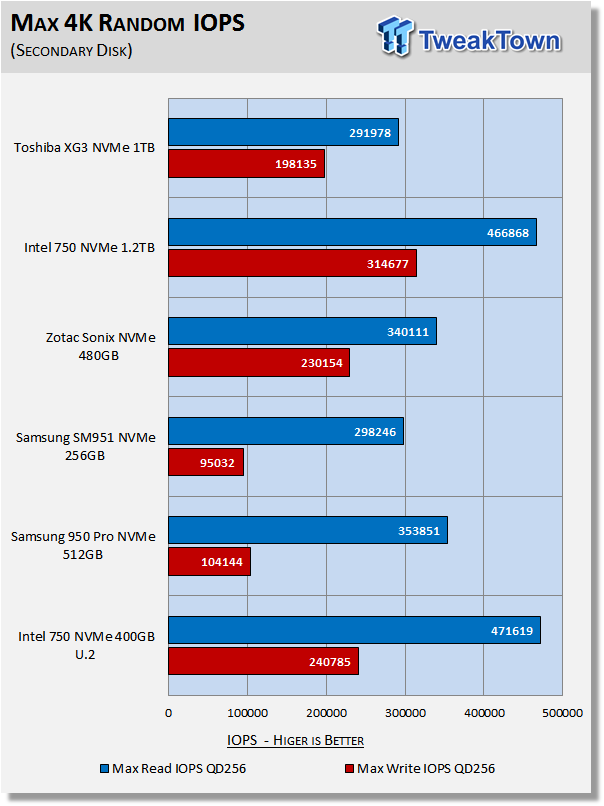
We could not find any XG3 factory specifications for 4K random performance, so we don't know how our configuration compares. We are able to hit 291K/198K with our configuration. The XG3 delivers double the maximum write IOPS of Samsung's SM951.
Iometer – Disk Response
Version and / or Patch Used: Iometer 2014
We use Iometer to measure disk response times. Disk response times are measured at an industry accepted standard of 4K QD1 for both write and read. Each test runs twice for 30 seconds consecutively, with a 5-second ramp-up before each test. We partition the drive/array as a secondary device for this testing.
Avg. Write Response

Avg. Read Response

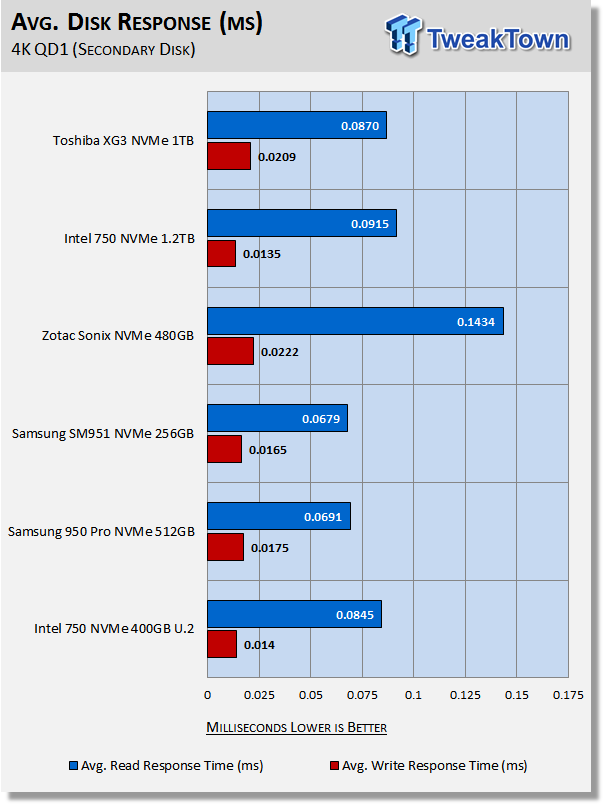
The Samsung drives in our test pool deliver the best (lowest) latency at QD1. The XG3 is able to outperform Zotac's Sonix with both read and write and Intel's 1.2TB 750 Series with read.
DiskBench – Transfer Rate
Version and / or Patch Used: 2.6.2.0
We use DiskBench to time a 28.6GB block (9,882 files in 1,247 folders) composed primarily of incompressible sequential and random data as it's transferred from our DC P3700 PCIe NVME SSD to our test drive. We then read from a 6GB zip file that's part of our 28.6GB data block to determine the test drive's read transfer rate. Our system is restarted prior to the read test to clear any cached data, ensuring an accurate test result.
Write Transfer Rate

Read Transfer Rate

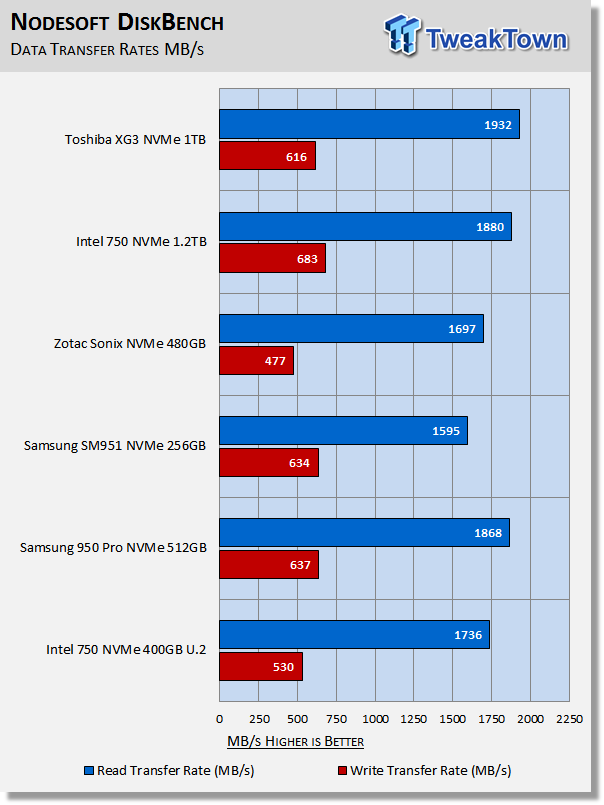
The XG3 delivers excellent read transfer performance, as do all the drives in our test pool. The XG3 outperforms all of the competition with read transfers, delivering nearly 2TB/s!
Benchmarks (Secondary Volume) – PCMark 8 Extended
Futuremark PCMark 8 Extended
Heavy Workload Model
PCMark 8's consistency test simulates an extended duration heavy workload environment. PCMark 8 has built-in, command line executed storage testing. The PCMark 8 Consistency test measures the performance consistency and the degradation tendency of a storage system.
The Storage test workloads are repeated. Between each repetition, the storage system is bombarded with a usage that causes degraded drive performance. In the first part of the test, the cycle continues until a steady degraded level of performance has been reached. (Steady State)
In the second part, the recovery of the system is tested by allowing the system to idle and measuring the performance after 5-minute long intervals. (Internal drive maintenance: Garbage Collection (GC)) The test reports the performance level at the start, the degraded steady-state, and the recovered state, as well as the number of iterations required to reach the degraded state and the recovered state.
We feel Futuremark's Consistency Test is the best test ever devised to show the true performance of solid state storage in an extended duration heavy workload environment. This test takes on average 13 to 17 hours to complete and writes somewhere between 450GB and 14,000GB of test data depending on the drive. If you want to know what an SSDs steady state performance is going to look like during a heavy workload, this test will show you.
Here's a breakdown of Futuremark's Consistency Test:
Precondition phase:
1. Write to the drive sequentially through up to the reported capacity with random data.
2. Write the drive through a second time (to take care of overprovisioning).
Degradation phase:
1. Run writes of random size between 8*512 and 2048*512 bytes on random offsets for 10 minutes.
2. Run performance test (one pass only).
3. Repeat 1 and 2 for 8 times, and on each pass increase the duration of random writes by 5 minutes.
Steady state phase:
1. Run writes of random size between 8*512 and 2048*512 bytes on random offsets for 50 minutes.
2. Run performance test (one pass only).
3. Repeat 1 and 2 for 5 times.
Recovery phase:
1. Idle for 5 minutes.
2. Run performance test (one pass only).
3. Repeat 1 and 2 for 5 times.
Storage Bandwidth
PCMark 8's Consistency test provides a ton of data output that we use to judge a drive's performance.

We consider steady state bandwidth (the blue bar) our test that carries the most weight in ranking a drive/arrays heavy workload performance. Performance after Garbage Collection (GC) (the orange and red bars) is what we consider the second most important consideration when ranking a drive's performance. Trace-based steady state testing is where true high performing SSDs are separated from the rest of the pack.
In a steady state, the XG3 is able to muster a quite respectable 424 MB/s storage bandwidth. This is just below that of the 256GB SM951 and the 400GB Intel 750 Series U.2 SSD.
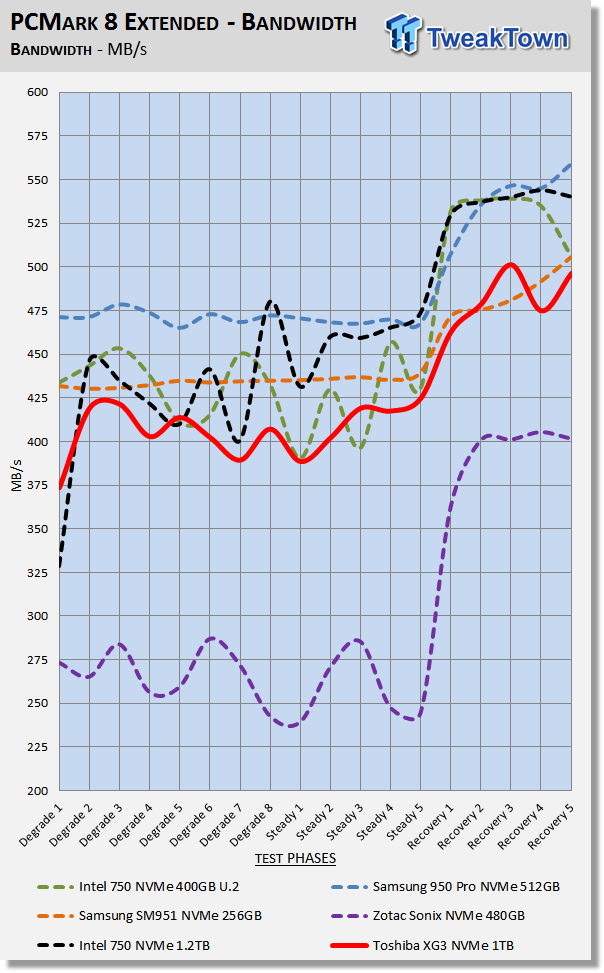
We chart our test subject's storage bandwidth as reported at each of the test's 18 trace iterations. This gives us a good visual perspective of how our test subjects perform as testing progresses. This chart sheds more light on how the drives perform as they progress through the testing phases.
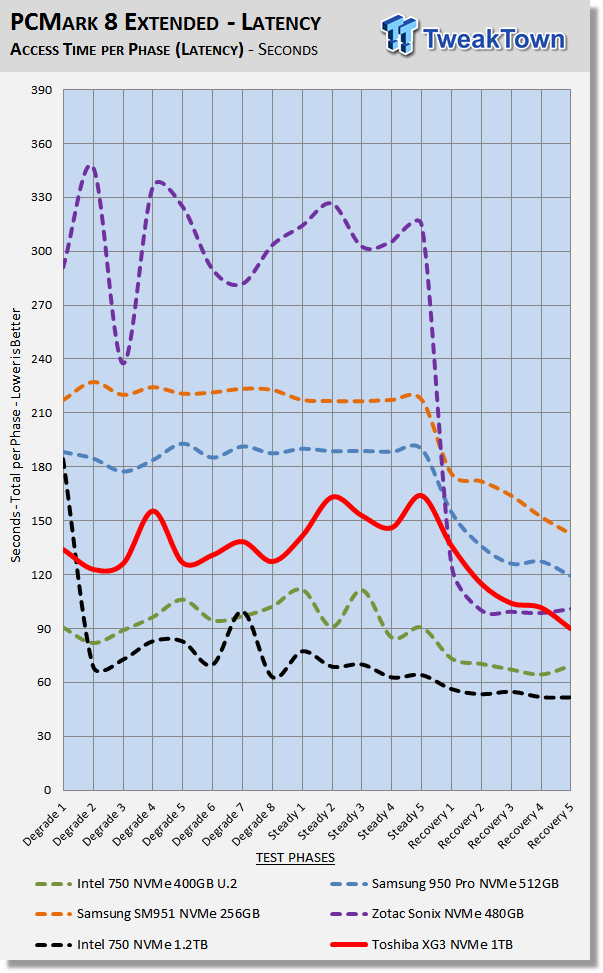
Total Access Time (Latency)
We chart the total time the disk is accessed as reported at each of the test's 18 trace iterations. This chart piques our interest when we look at the recovery phases. In terms of total latency, the XG3 really delivers. The XG3 displays better latency than both the SM951 and 950 Pro, which should be reflected in our data written results. Intel's 750 Series SSDs deliver the lowest overall latency.
Disk Busy Time
Disk Busy Time is how long the disk is busy working. We chart the total time the disk is working as reported at each of the tests 18 trace iterations.
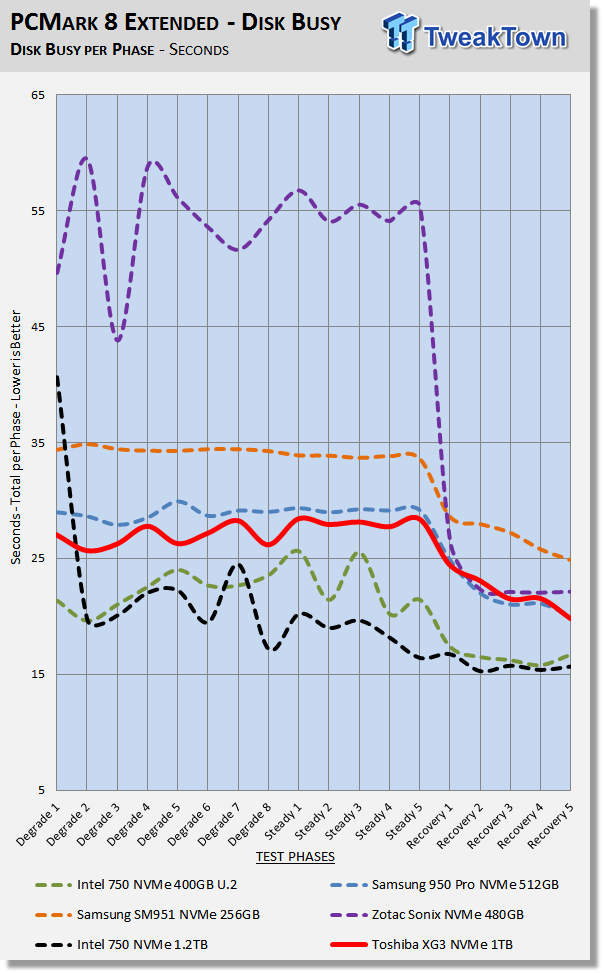
When latency is low, disk busy time is low as well.
Data Written
We measure the total amount of random data that our test drive/array is capable of writing during the degradation phases of the consistency test. Pre-conditioning data is not included in the total. The total combined time that degradation data is written to the drive/array is 470 minutes. This can be very telling. The better a drive/array can process a continuous stream of random data; the more data will be written.
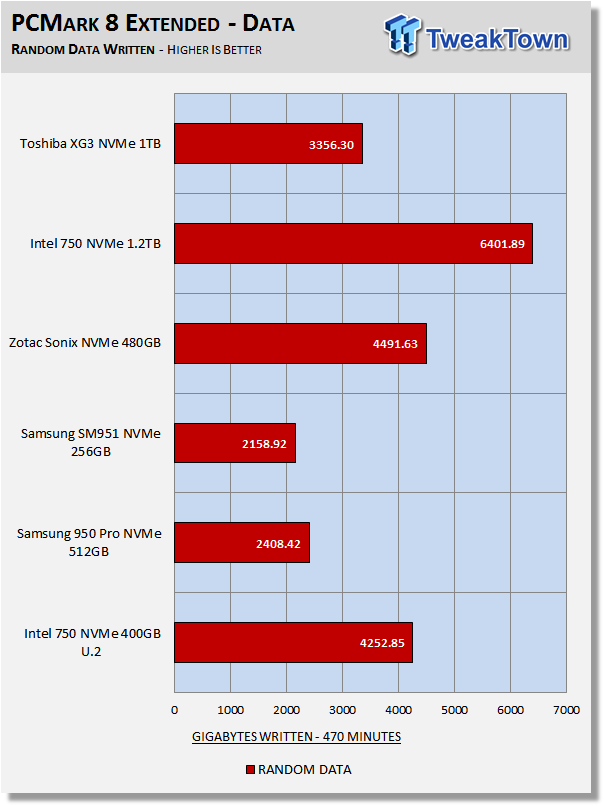
Combined read/write latency, capacity and overprovisioning are the biggest factors that determine the outcome of this portion of the test. As suspected, the XG3 is able to write the most data for a non-overprovisioned drive. The Sonix is able to write more random data in the same amount of time because it enjoys an advantage of 7% overprovisioning.
Benchmarks (Secondary Volume) – 70/30 Mixed Workload
70/30 Mixed Workload Test (Sledgehammer)
Version and / or Patch Used: Iometer 2014
Heavy Workload Model
This test hammers a drive so hard we've dubbed it "Sledgehammer". Our 70/30 Mixed Workload test is designed to simulate a heavy-duty enthusiast/workstation steady-state environment. We feel that a mix of 70% read/30% write, full random 4K transfers best represents this type of user environment. Our test allows us to see the drive enter into and reach a steady state as the test progresses.
Phase one of the test preconditions the drive for 1 hour with 128K sequential writes. Phase two of the test runs a 70% read/30% write, full random 4K transfer workload on the drive for 1 hour. We log and chart (phase two) IOPS data at 5-second intervals for 1 hour (720 data points). 60 data points = 5 minutes.
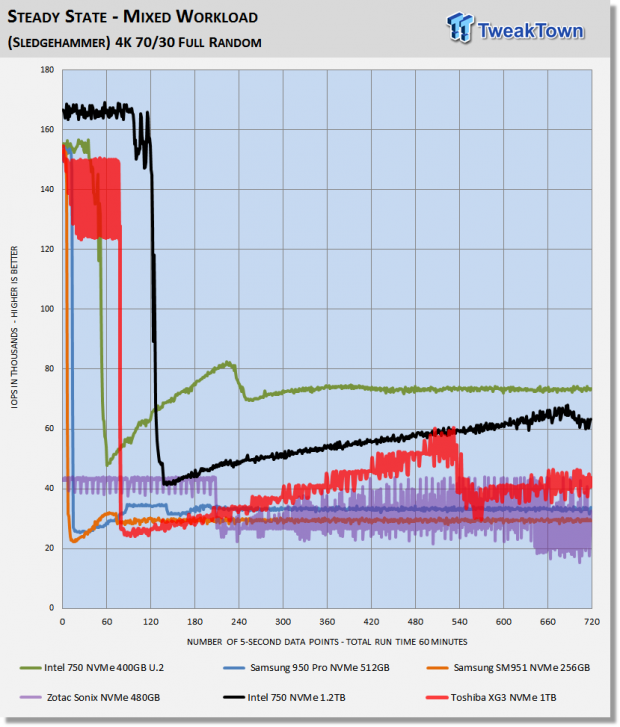
What we like about this test is that it reflects reality. Everything lines up, as it should. Consumer drives don't outperform Enterprise-Class SSDs that were designed for enterprise workloads. Consumer drives based on old technology are not outperforming modern Performance-Class SSDs, etc.
Intel's 750 Series SSDs dominate this brutal test. The XG3 outperforms both the SM951 and the 950 Pro. This is a very good indicator that the XG3 can deliver better heavy workload performance in certain scenarios than Samsung's M.2 NVMe SSDs.
Maxed-Out Performance (MOP)
This testing is just to see what the drive is capable of in an FOB (Fresh Out of Box) state under optimal conditions. We are utilizing Windows Server 2012 R2 64-bit for this testing. Same Hardware, just an OS change.


This testing shows us two things. Windows 10 4K QD1 random performance is vastly inferior to Server 2012, and that the XG3 is the new performance leader in terms of sequential write performance.
Final Thoughts

The Toshiba XG3 is a drive that we've been chasing for a long time now. Testing confirms our suspicion that the XG3 is an absolute beast in terms of performance. Samsung's M.2 NVMe SSDs remain the performance leader, but the XG3 shrinks that lead considerably. The XG3 performs so well that we feel an end-user will not notice a difference between it and a 950 Pro or SM951. Toshiba's 1TB XG3 is more than just about massive performance; it's also about massive capacity on an NVME M.2 SSD. Twice the capacity of current competing M.2 NVMe solutions is very attractive to notebook enthusiasts.
Outside of a one-off sale on eBay, our readers will likely never be able to do an after-market upgrade utilizing a Toshiba XG3 1TB SSD, but not to worry because OCZ's RevoDrive 400 is right around the corner. We fully expect that OCZ's RevoDrive 400 will deliver even better performance than the XG3, and it will also have the advantage of a fully functional SSD toolbox for drive maintenance. To top it off, the RevoDrive 400 will be backed by OCZ's exclusive ShieldPlus warranty. Needless to say, we are very excited about the upcoming retail version of Toshiba's XG3.
Our user experience while running the XG3 as our OS disk was outstanding. The 1TB XG3 is notably snappier than Intel's 750 series SSDs. Boot times are second only to the 950 Pro, and once inside the OS, there is no way to tell the difference between it and Samsung's M.2 NVMe SSDs. You cannot notice a performance difference, but there is no mistaking the 1TB XG3's massive capacity advantage. Overall, we feel that a 1TB NVMe M.2 SSD with the performance that the XG3 can deliver is the most appealing consumer-based SSD ever made.
Toshiba's 1TB XG3 M.2 NVMe SSD is TweakTown recommended.
Pros:
- Performance
- Capacity
- Build Quality
- Most Appealing Form Factor
Cons:
- Availability
 Samsung 990 2TB SSD Review - Ninth Gen QLC at PCIe Gen4 Speeds
 HighPoint Rocket 1604L Gen5 x16 NVMe Software RAID AIC Review: half the price with full 59 GB/s speed
 UGREEN NASync DXP4800 GT Review: powerful 4-bay NAS with AMD Ryzen and dual 10GbE ports
 Phison E37T SSD Controller Exclusive Preview - The Fastest DRAMless SSD Platform Yet
 Seagate FireCuda X1070 4TB SSD Review - A New Mainstream Contender
 Giveaway: Win an ASRock B850 Riptide WiFi and Phantom Gaming PG-850G PSU
 China's CXMT is on track to nearly match Micron's DRAM production capacity by the end of 2026
 NVIDIA's RTX 50 Super GPUs have reached board partners, but launch is on hold over 3GB GDDR7 pricing
 Amazon's God of War series is recasting Kratos after Ryan Hurst suffered an on-set injury
 Physical games don't matter to GameStop, CEO says
 GameStop CEO Ryan Cohen wants to buy eBay and build out an in-game digital marketplace
 KB5101650 Windows 11 update is causing some Dell PCs to shut down unexpectedly
 Bethesda on Elder Scrolls VI, Fallout 5 Xbox exclusivity: 'It's too early to comment'
 Assassin's Creed Black Flag Resynced makes in one day what Shadows took four days to earn
 Bethesda gives news on Elder Scrolls 6, confirms 4 Fallout projects, new Starfield content
 SteelSeries Arctis Nova 7 Wireless Gen 2 Headset Review - New and Improved, But Is It Enough?
 AMD Ryzen 7 7700X3D Review - Days of Future Past
 ASUS ExpertBook Ultra (Panther Lake) 14" Business Laptop Review
 ASUS ROG Raikiri II Xbox Wireless Controller Review - Ready to Take Control
 MOZA FMP18 Panel Bundle Review: authentic F/A-18 Hornet cockpit controls for flight sims
 Micron 6600 ION 245.76TB Enterprise SSD Review - Best in Class Programming Speeds
 MOZA MA3F EFCM Flight Control Module Review: authentic Airbus A320 autopilot panel for simulators
 Turtle Beach Stealth Pro II Wireless Gaming Headset Review - Premium Sound, Fantastic Features
 MOZA MGX1000 Instrument Panel Review: a realistic Garmin G1000 replica for immersive flight sims
 Hisense U6SF 65-inch MiniLED TV: High Performance Meets Leisurely Convenience
 I stopped digging through Windows menus after I set up this one folder
 Don't sell your Windows laptop until you do these things
 6 PC cleaning mistakes to avoid for safer hardware maintenance
 Phison and Intel Take Aim at Local AI's Memory Wall with aiDAPTIV
 How to Remap Keyboard Keys in Windows using Microsoft PowerToys
 7 tips to organize your Windows files for faster, easier access
 Intel Arc G3 Extreme first impressions with MSI's Claw 8 EX AI+ - Incredible power for an extreme price
 How to fix Wi-Fi Adapter Not Working on Windows laptops: troubleshooting tips
 Hisense U7SG 4K TV: Modern Entertainment for the New Age