The Bottom Line
Pros
- + New Socket AM5
- + DDR5 and PCIe 5.0 support
- + Efficiency (performance per watt)
- + Price
- + Gaming performance
Cons
- - IPC still falls short of ADL
- - Half duplex memory controller
Should you buy it?
AvoidConsiderShortlistBuyIntroduction and Pricing
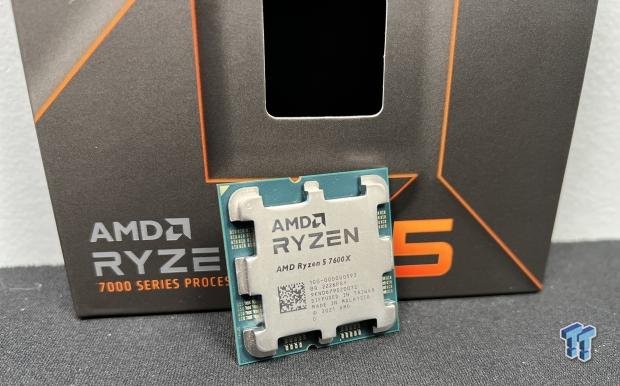
And... we're back, this time exploring the performance of the new AMD Ryzen 5 7600X processor. It aims to be the entry-level solution in the AMD Zen 4 family, replacing the now two-year-old Ryzen 5 5600X and competing against Intel's 12600K and not far off 13600K.
The Zen 4 Ryzen 5 7600X is a six-core part with SMT giving 12 threads. It supports all of the new platform features, including DDR5 and PCIe 5.0, while also now having its integrated GPU.
Pricing
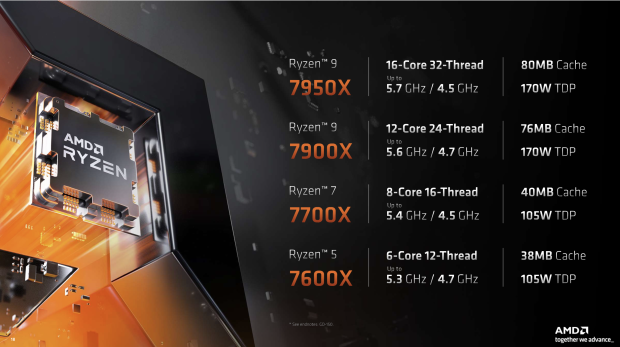
As we mentioned in our 7900X review, AMD has four SKUs hitting shelves for launch day, all 7000 series parts. At the top, we have the 7950X at 16c32t; it houses an impressive 80MB cache, 170 TDP, and carries the $699 price tag. The 7600X is the next SKU down the line with 12 cores, 24 threads, base clock at 4.7GHz with a boost to 5.6GHz. 75MB of cache with the same 170W TDP. The 7600X carries a price tag of $549.
Moving on to the single CCD processors, the 7700X and 7600X share a 105W TDP; the 7700X offers a slightly higher boost clock and a bit more cache over the 7600X. The 7700X carries an MSRP of $399, while the 7600X comes in at $299.

Zen 4 Architecture
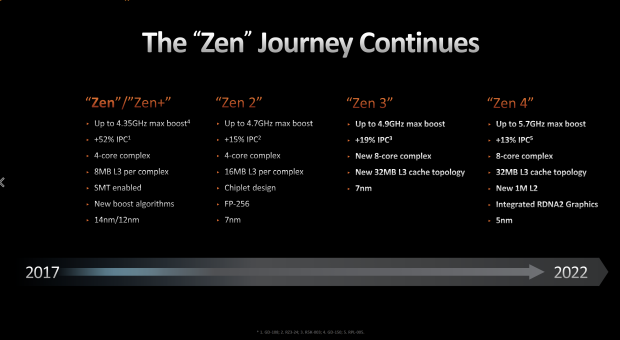
Zen 4 uses much of the design AMD launched with Zen 3, including the eight-core complex and cache topology. That said, there have been significant improvements in the design, allowing for higher boost clocks, up to 5.7GHz on the 7950X, a larger L2 cache, and finally, integrated graphics from the RDNA2 family.
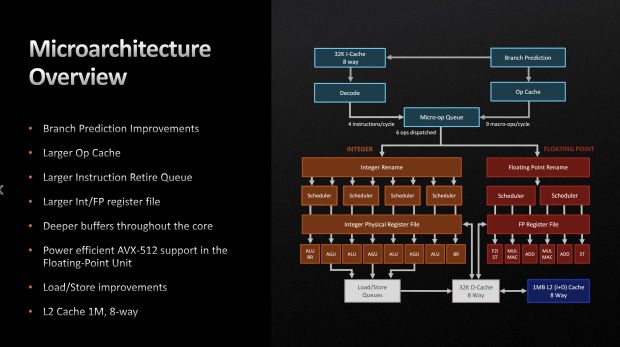
Moving to Zen 4, the CPU design was tweaked to add larger Op caches, IRQ, and larger FP registers. AMD has also introduced deeper buffers into the design and added AVX512 support.
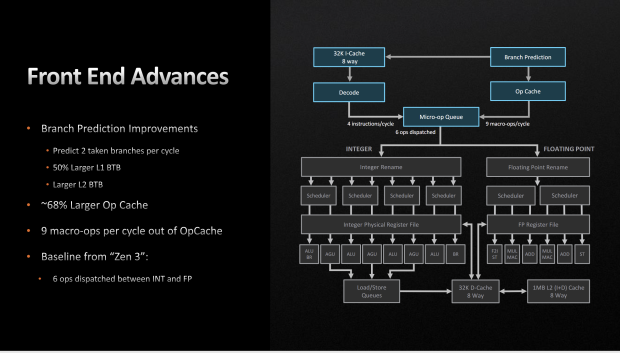
Zen 4 includes branch prediction improvement on the front end with 50% larger L1 and an overall 68% larger Op cache.
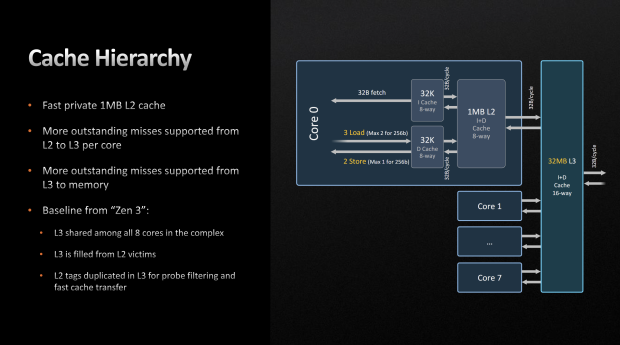
Digging more into the cache, based on Zen 3, each Core for Zen 4 has its own 1M L2 sharing the L3 across the core complex.
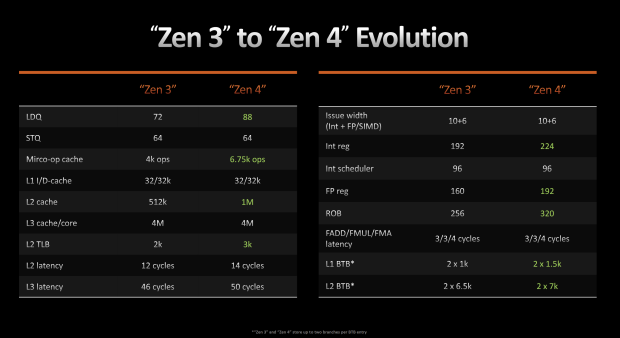
Evolution from Zen 3 to Zen 4 shows the advancement in each CPU part.
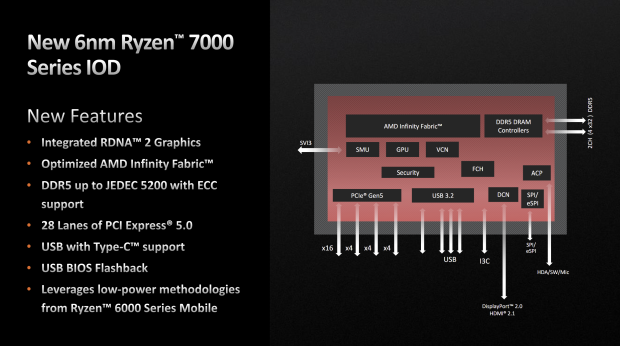
With Zen 4, we do finally get a better IOD. This is a much smaller 6nm design with RDNA2 graphics, support for DDR5, and 28 PCIe 5.0 lanes.
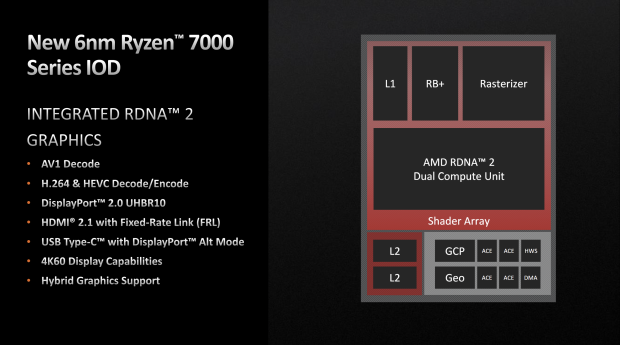
Above, we have the layout of the Integrated RDNA2 solution. This is likely based on the same model found in the 5700G.
Packaging and Test System
Packaging
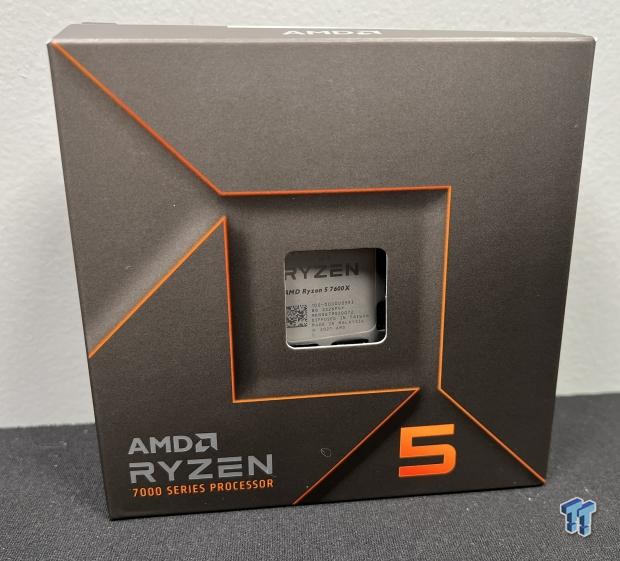
Packaging for the 7600X follows what we saw when we unboxed the 7900X. The centered window gives the consumer a look at the CPU model and branding along the bottom of the box.
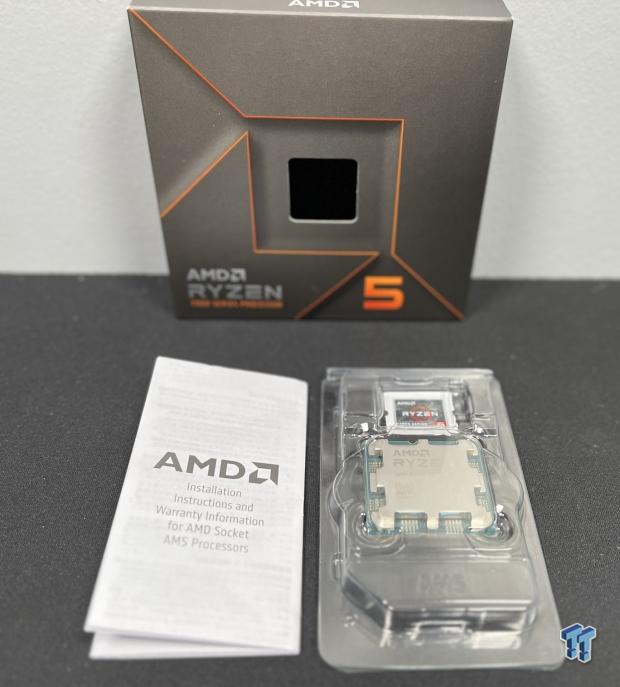
Included in the box with the 7600X, we have the COA and Ryzen 5 sticker for our chassis. No cooling is included with this model either.
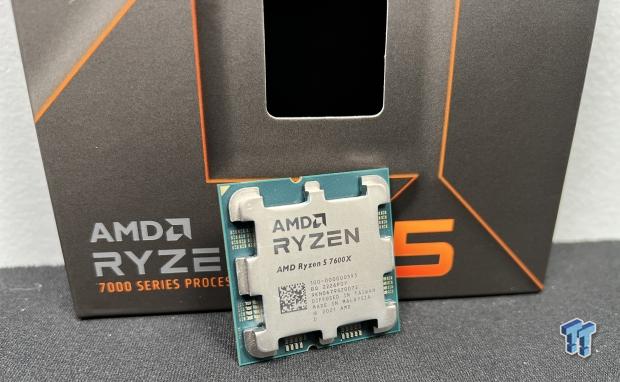
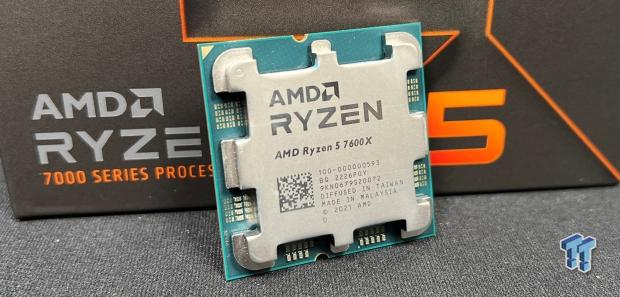
As for the CPU, you can see it has its new design, with AMD choosing to push all of the SMD capacitors to the top of the CPU, protecting them with the HIS.
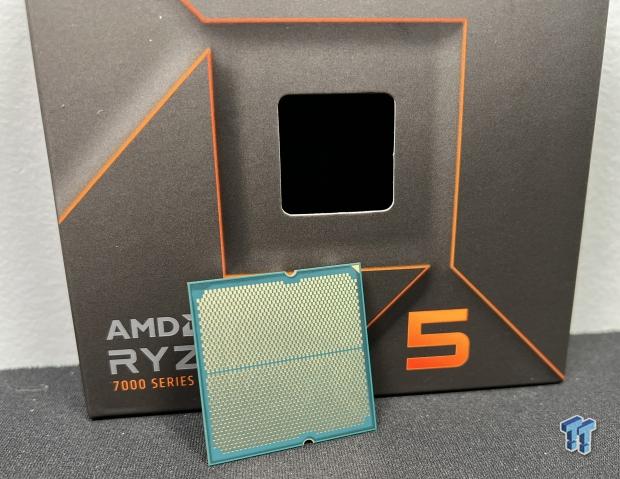
All SMD caps are on the top, leaving smooth 1718 gold pads on the bottom.
Test System
- Motherboard: X670E AORUS Master BIOS 813b
- GPU: Radeon RX 6800 XT
- RAM: Corsair Dominator RGB DDR5 6000 CL30
- Cooler: 3x140mm Custom Water
- OS Storage: Sabrent Rocket 4 Plus 2TB
- Power Supply: AORUS GP AP1200PM
- OS: Microsoft Windows 11
Cinebench, Crossmark and AIDA64
Cinebench R23
Cinebench is a long-standing render benchmark that has been heavily relied upon by both Intel and AMD to showcase their newest platforms during unveils. The benchmark has two tests, a single-core workload that will utilize one thread or 1T. There is also a multi-threaded test that uses all threads or nT of a tested CPU.
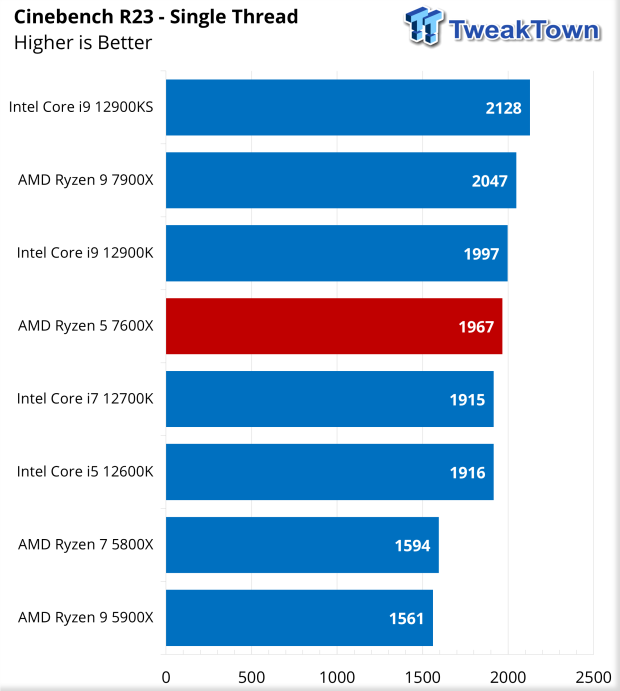
Getting into our test results with the 7600X, we start with R23 as per standard. In this workload, the 7600X land middle top in the charts, score at 1967, a good 50 points higher than the 12600k.
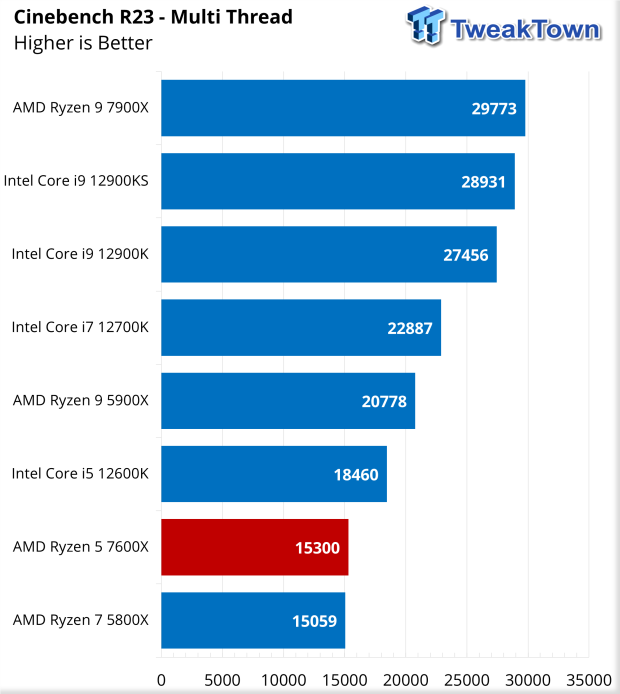
Over to multi-thread, the 7600X feels a bit hurt, scoring just 15300; it falls shy of the performance set by the 12600K.
Cinebench R20 IPC

Cinebench is commonly used as a test to show IPC gains in processors normalized to a certain clock speed. We have normalized to 4GHz for several generations and can deliver the increases over the years. With Zen 4, we have a sizable gain over Zen 3, roughly 40 points. This lands Zen 4 at 558, though it still trails Alder Lake IPC.
Crossmark
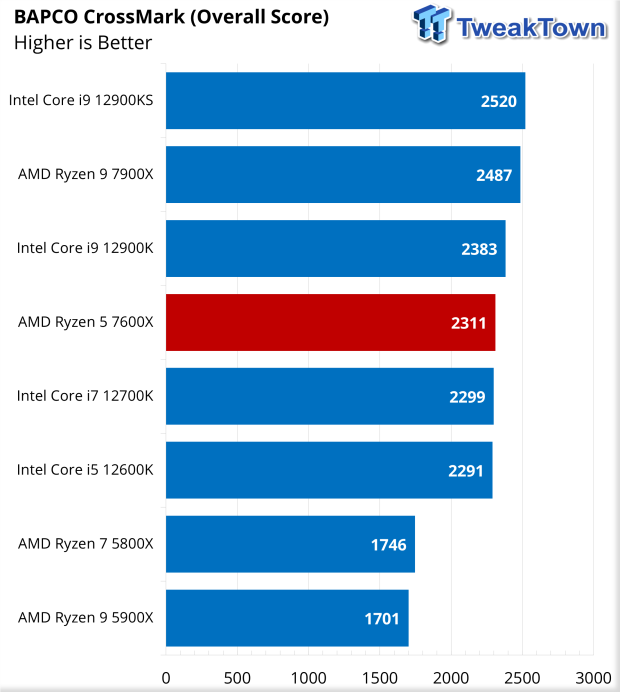
Switching workloads to CrossMark, the 7600X scores 2311 overall, quite a bit more than the 5800 and 5900X, surpassing the 12600 and 12700K.
AIDA64
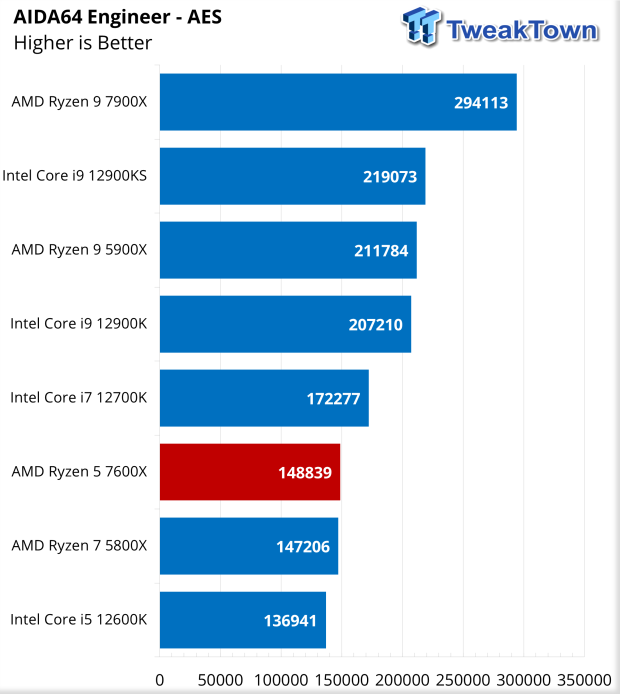
Zen 4 has been chewing up the AES and SHA3 workloads since we started testing. In AES, we grabbed a score of 148839; this beats out the 5800X from the last gen alongside the 12600K by a fair margin.
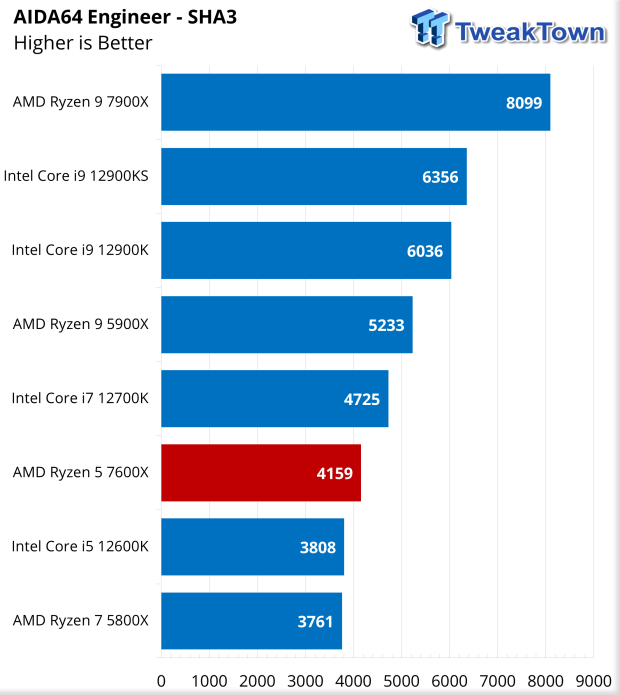
SHA3 is very similar, the 7600X taking a score of 4159.
UL Benchmarks
Procyon and 3DMark
UL Procyon Suite
The UL Procyon Office Productivity Benchmark uses Microsoft Office apps to measure PC performance for office productivity work.
The Photo Editing benchmark uses Adobe® Lightroom® to import, process, and modify a selection of images. In the second part of the test, multiple edits and layer effects are applied to a photograph in Adobe® Photoshop®.
The Video editing benchmark uses Adobe® Premiere® Pro to export video project files to common formats. Each video project includes various edits, adjustments, and effects. The benchmark score is based on the time taken to export the videos.
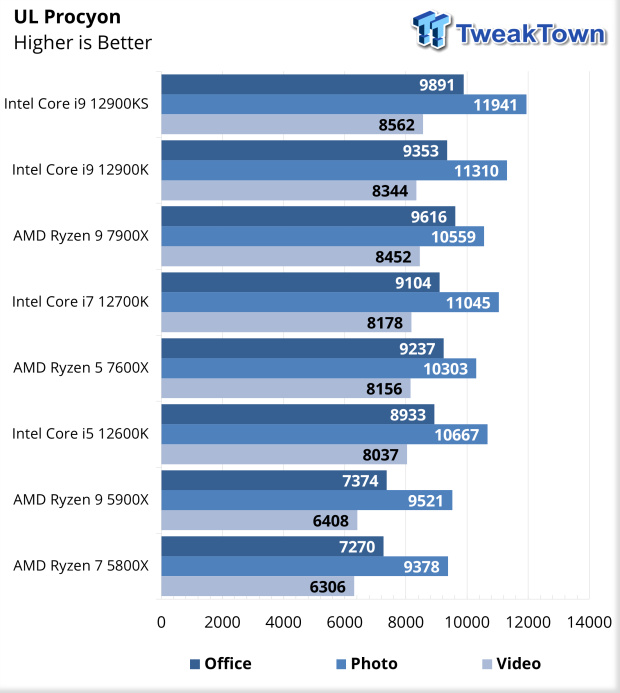
In each of the workloads within Procyon, the 7600X offers solid increases over the 5800X. For instance, we see a near 2000-point jump in office; 7270 to 9237. Photo workloads moved from 9378 with the 5800X to 10303 with 7600X, and video saw a sizable uptick to 8156.
3DMark
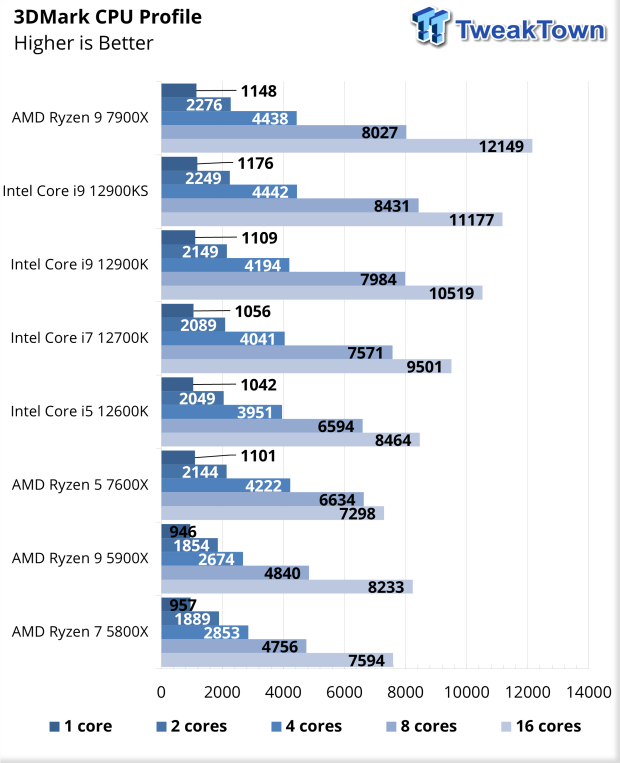
The first of our 3DMark workloads has us in CPU Profile. With this workload, the 7600X peaks at 7298 with 16 threads. In the single thread, we see 1101.
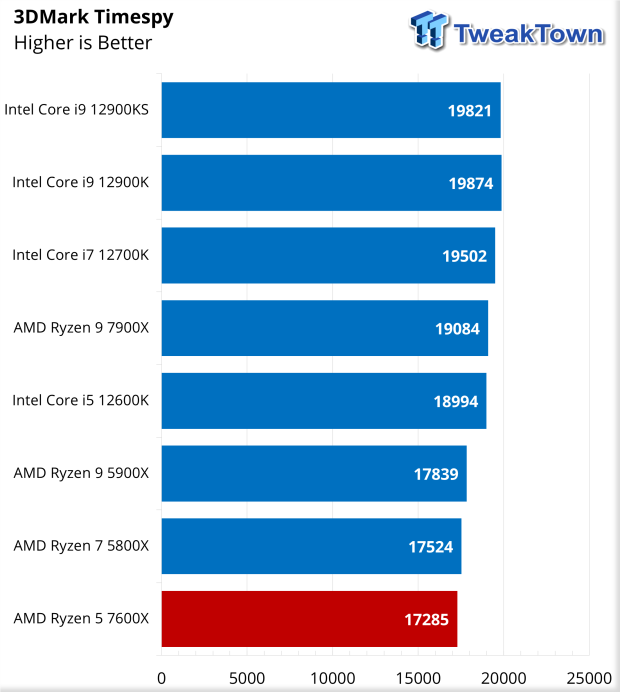
Our first "gaming" scenario lands at 17285 in Timespy with our 6800 XT. This doesn't seem to beat out the last-gen 5800X nor the 12600K.
Gaming and Power Consumption
Gaming Performance
Diving into gaming, we added a few new games to our list, keeping Tomb Raider as its cornerstone at this point. We also stayed with Horizon Zero Dawn but added CyberPunk 2077, and AC Valhalla swapped out Far Cry New Dawn for Far Cry 6 and then paid homage to Rockstar by adding GTAV. With some of these new scenarios, we only have results moving forward.
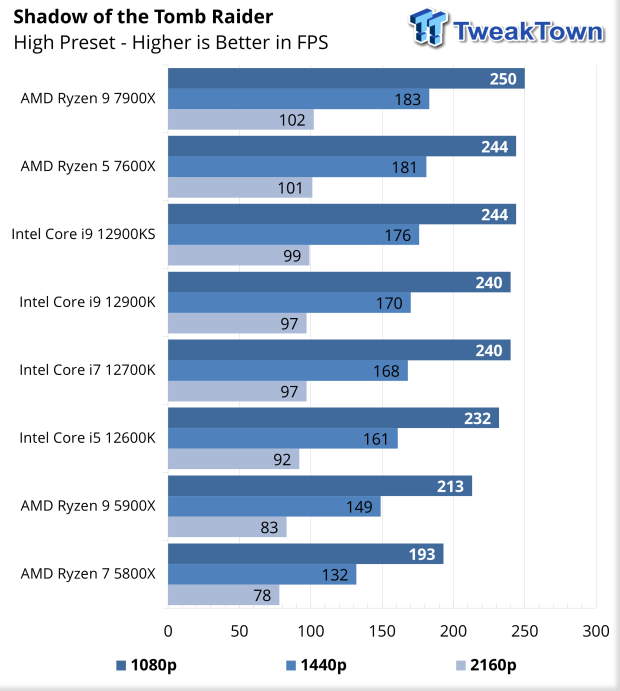
Starting things off with Tomb Raider, the 7600X was running right behind our 7900X in the charts. 244 FPS in 1080p and 102 FPS in 4K.
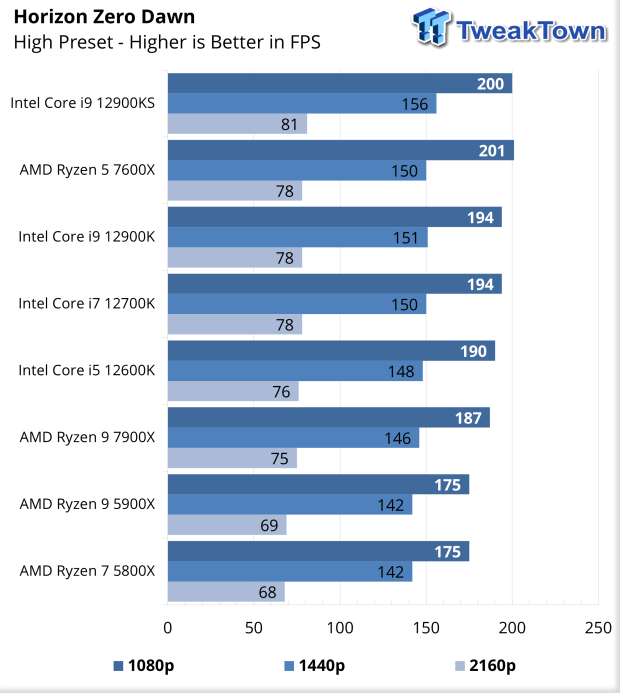
Horizon showed more love for the 7600X than we found with the 7900X. In this case, 1080p gave us 201 FPS, and 4K landed at 78 FPS.
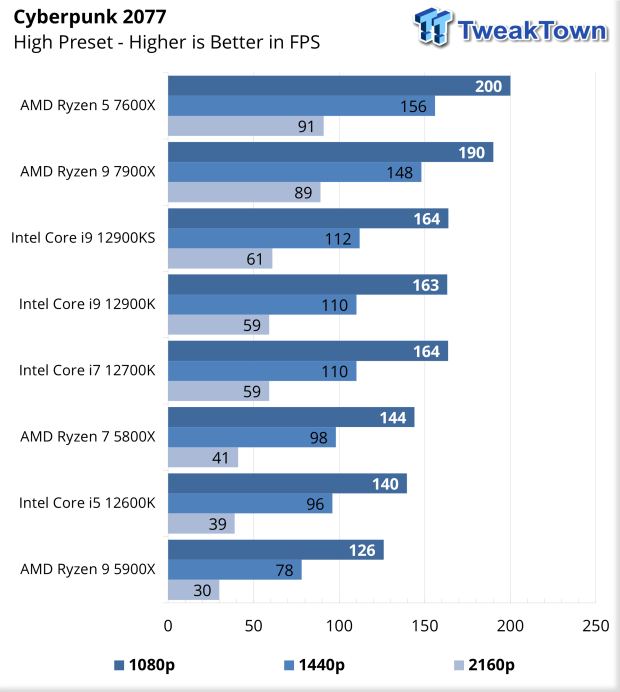
Cyberpunk pushes the 7600X to 200 FPS and the top spot in this chart. At 4K, we see a drop to 91 FPS.
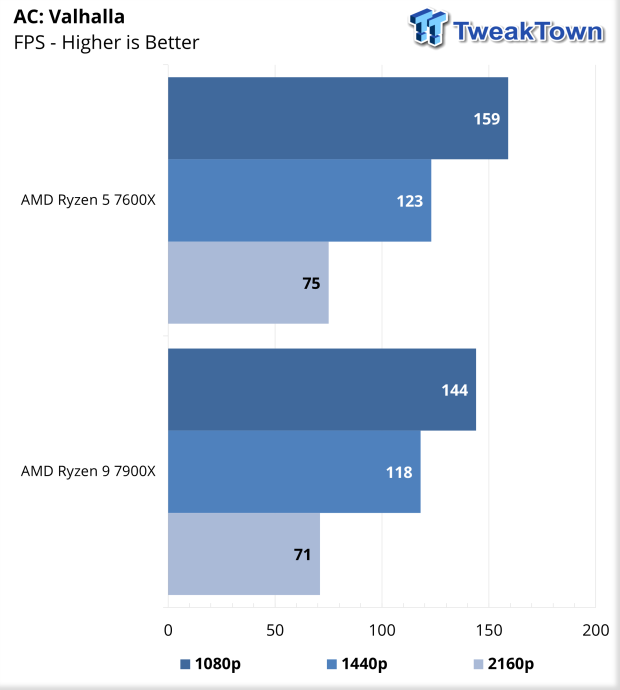
Getting into our new benches, the 7600X grabbed 159 FPS in 1080p and 75 FPS at 4K, making it the better chip compared to the 7900X.
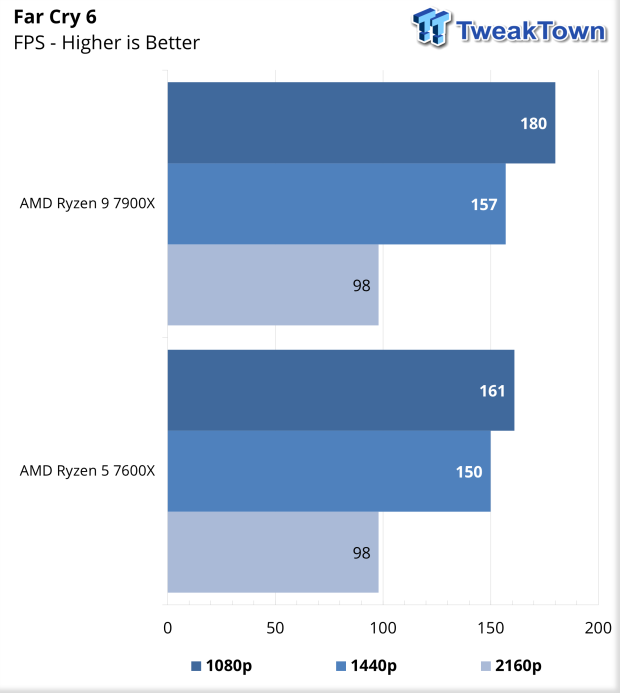
FC6 peaks at 161 FPS for the 7600X, putting it behind the 7900X.
Power, Value, and Final Thoughts
Power Consumption
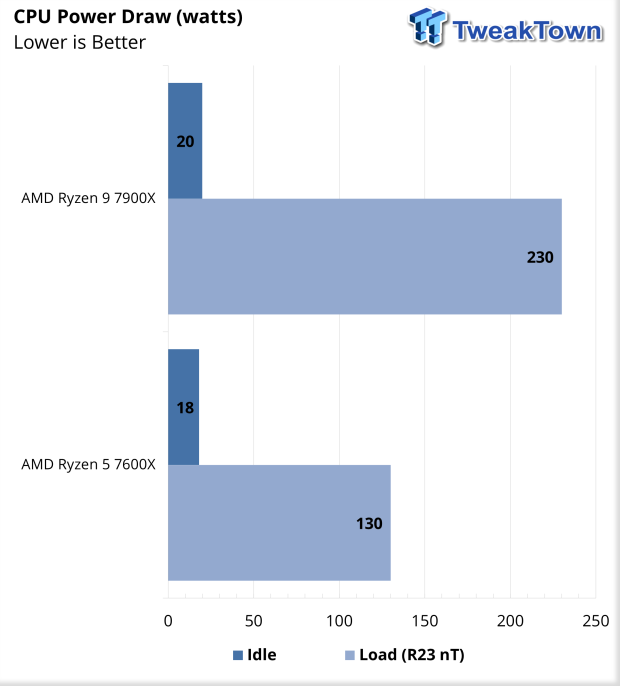
Power consumption is measured directly from the dual eight-pin connections. At peak, the 7600X pulls an impressive 130W, and during idle, it was down to 18w.
Value
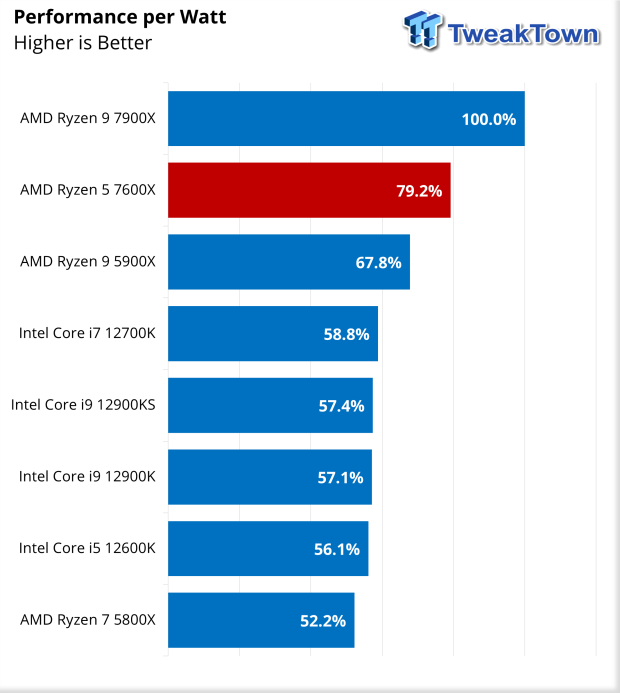
Looking at Performance per Watt, the 7600X offers the best performance per watt next to the 7900X.
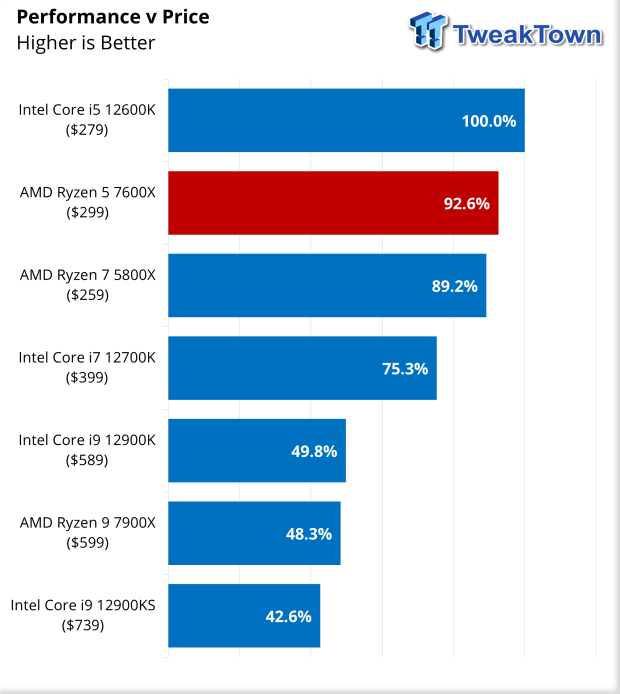
Adding in cost to the equation using current market pricing as of this writing, the 7600X ends up at the top of this chart alongside the 12600K.
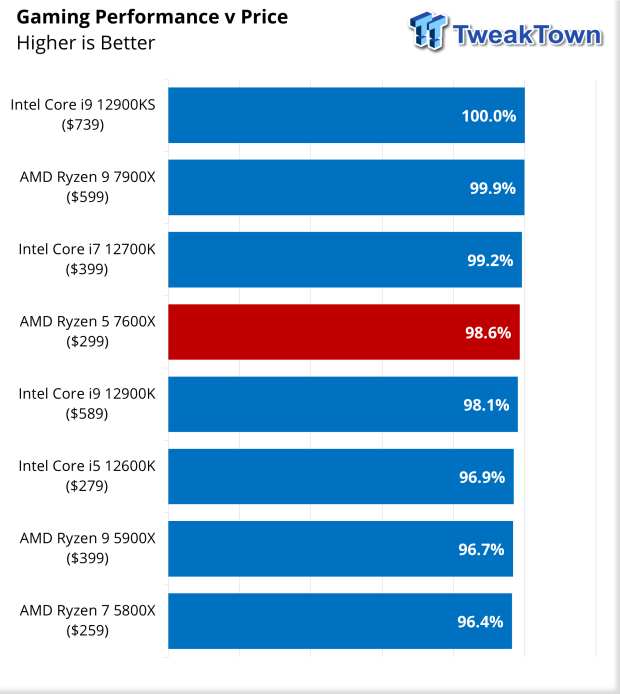
Taking a second jab at Price v Performance, this time using gaming as the performance metric. The 7600X lands near the top, just behind the 7900X and 12700K.
Final Thoughts
Coming at you from a PC gamers perspective, the 7600X is exactly what AMD designed Zen 4 for. It handles PC gaming like no other and is consistent, at least in our testing, either number one in our charts or a close two to the 7900X.
It pushes past the 12600K in nearly every benchmark, even outside of gaming, giving me pause to think perhaps the 7700X could be the sweet spot for gaming this gen, so we may have to venture down that road when we can get our hands on one.
Outside of gaming, the 7600X dominates its current market quite easily. I have just a few benchmarks that show the 12600K ahead of the 7600X; these include UL Procyon Photo workload, 3DMark CPU Profile, and Timespy.
Adding to this, the 7600X still suffers from the half-duplex memory controller issue stemming from its single CCD design, so while your read and copy throughput should reach upwards of 80K when writing, your writes will be in the hole closer to 50k. This doesn't seem to affect daily work, but any workload that centers heavily on writing activity will have you wanting a two CCD Zen 4 CPU like the 7900X or 7950X.

