The Bottom Line
Pros
- + LGA Socket AM5
- + DDR5 and PCIe 5.0
- + Efficiency (Performance per Watt)
- + Improved performance
- + Gaming performance
Cons
- - IPC still falls short of ADL
- - CPU runs hot
Should you buy it?
AvoidConsiderShortlistBuyIntroduction and Pricing
Here we are, nearly two years since the launch of Zen 3, a rather successful generation for AMD that boosted them back in front of Intel's 10th Gen CPUs and added overall market share. Zen 3 also gave us a taste of what's to come with future CPUs from AMD, including 3D VCache, with the launch of the Ryzen 7 5800X3D in April of this year.
That said, in the last two years, Intel has refocused and has come storming back to the competition, pushing out 11th and 12th Gen platforms, the latter, Alder Lake, taking the performance crown from AMD, albeit with some impressive power usage.
This brings us to the task at hand; we spent a little over a week with the new AMD Ryzen 7900X and Ryzen 7600X - the 7600X will be reviewed in a second article that follows this. This review will describe our experience with the 7900X and detail the tests we accomplished.
Pricing
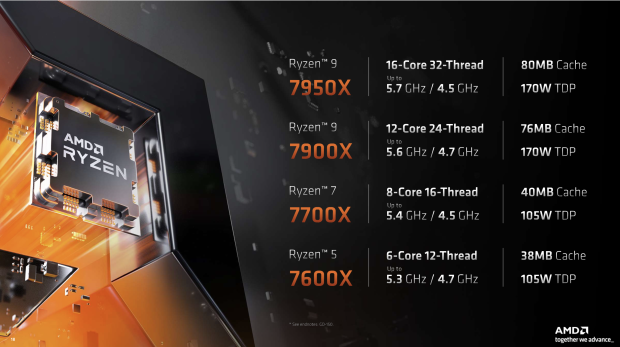
AMD has four SKUs hitting shelves for launch day, all Ryzen 7000 series parts. At the top, we have the 7950X at 16c32t, which houses an impressive 80MB cache, 170 TDP, and carries the $699 price tag. Our 7900X is the next SKU down the line with 12 cores, 24 threads, and a base clock at 4.7GHz with a boost to 5.6GHz. 75MB of cache with the same 170W TDP, and the 7900X carries a price tag of $549.
Moving on to the single CCD processors, the 7700X and 7600X share a 105W TDP; the 7700X offers a slightly higher boost clock and a bit more cache over the 7600X. The 7700X carries an MSRP of $399, while the 7600X comes in at $299.

Zen 4 Architecture
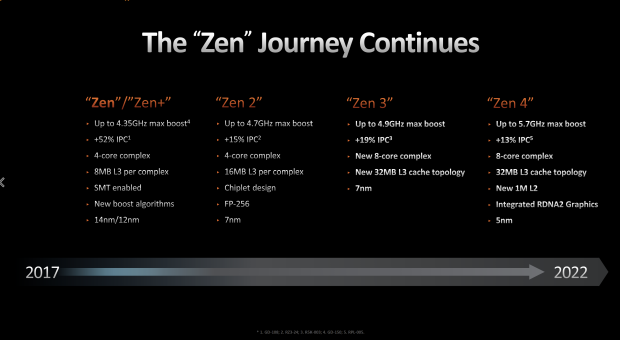
Zen 4 uses much of the design AMD launched with Zen 3, including the eight-core complex and cache topology. That said, there have been significant improvements in the design, allowing for higher boost clocks, up to 5.7GHz on the 7950X, a larger L2 cache, and finally, integrated graphics from the RDNA2 family.
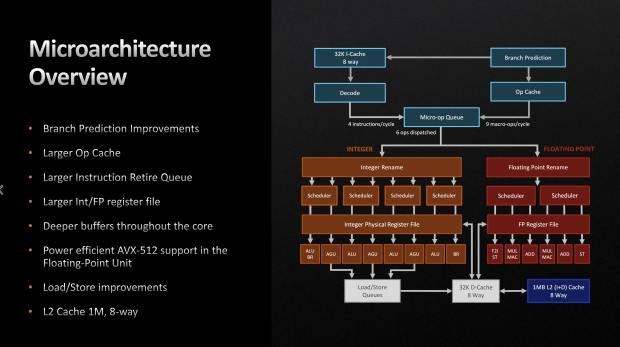
Moving to Zen 4, the CPU design was tweaked to add larger Op caches, IRQ, and larger FP registers. AMD has also introduced deeper buffers into the design and added AVX512 support.
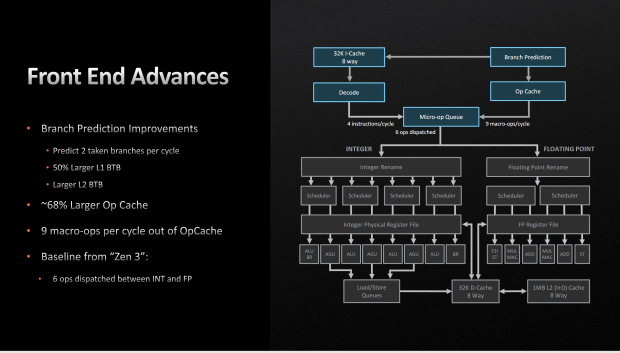
Zen 4 includes branch prediction improvement on the front end with 50% larger L1 and an overall 68% larger Op cache.
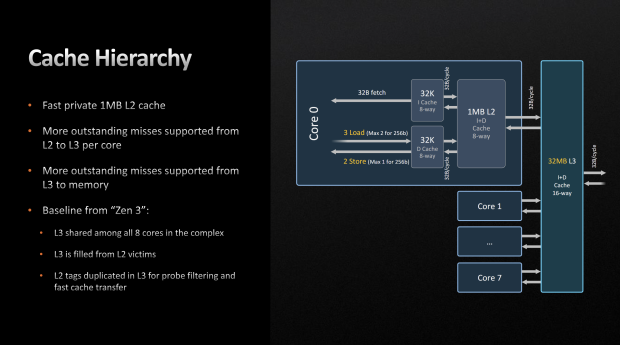
Digging more into the cache, based on Zen 3, each core for Zen 4 has its own 1M L2 sharing the L3 across the core complex.
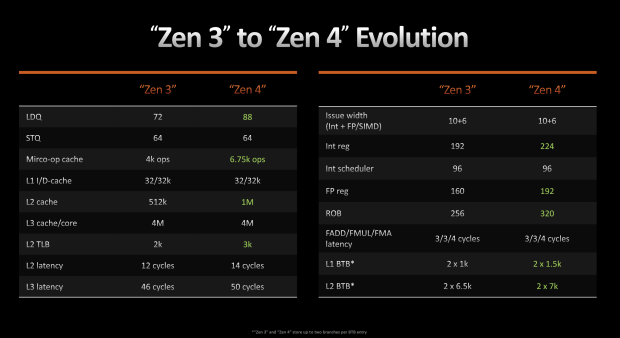
Evolution from Zen 3 to Zen 4 shows the advancement in each CPU part.
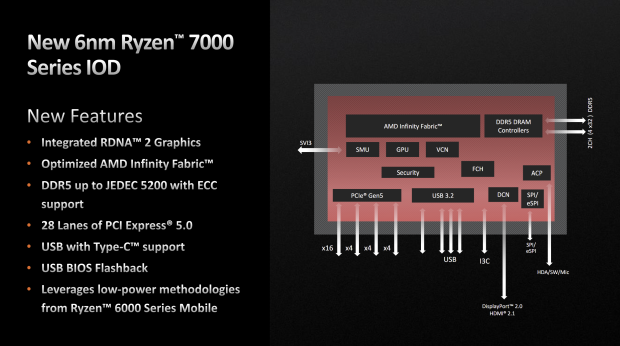
With Zen 4, we finally get a better IOD - a much smaller 6nm design with RDNA2 graphics, support for DDR5, and 28 PCIe 5.0 lanes.
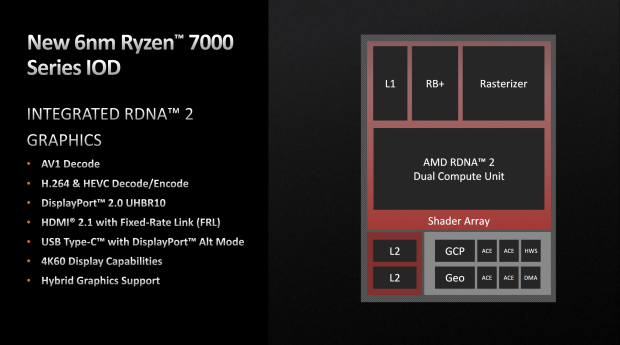
Above, we have the layout of the integrated RDNA2 solution, likely based on the same model found in the 5700G.
Packaging and Test System
Packaging
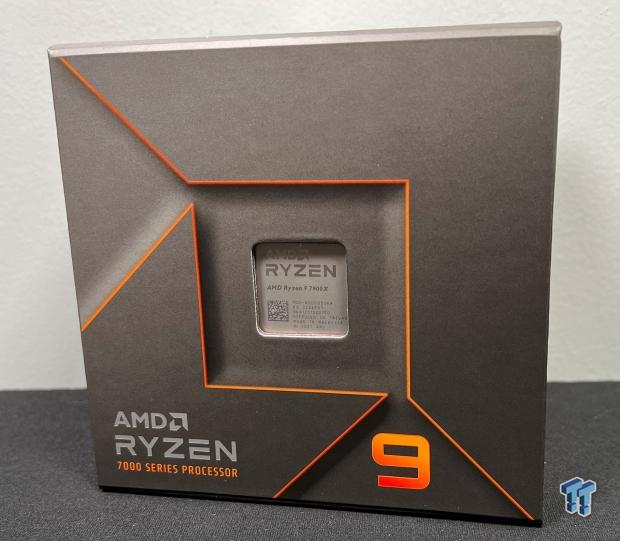
Packaging is all new for Zen 4 - the CPU peeks out of a central window in the box. The model and family are found along the bottom.
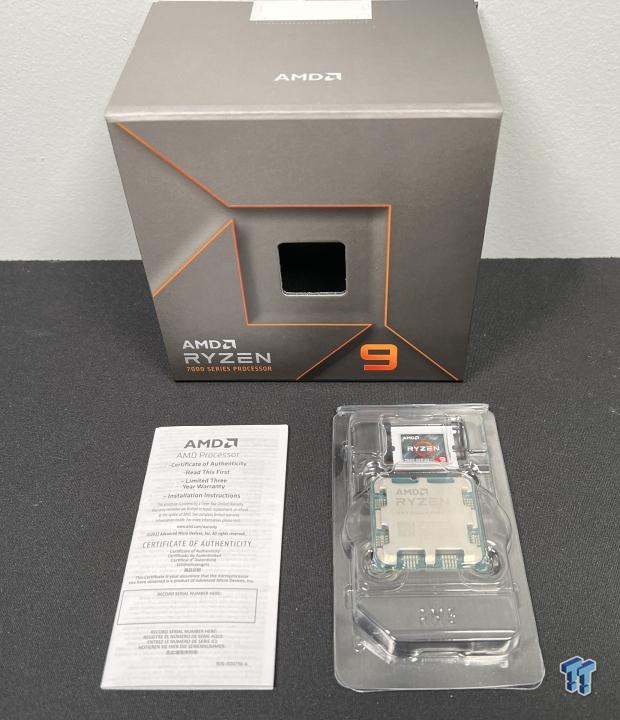
Included in the box with the 7900X, we have the COA and Ryzen 9 sticker for our chassis. No cooling is included with this model.
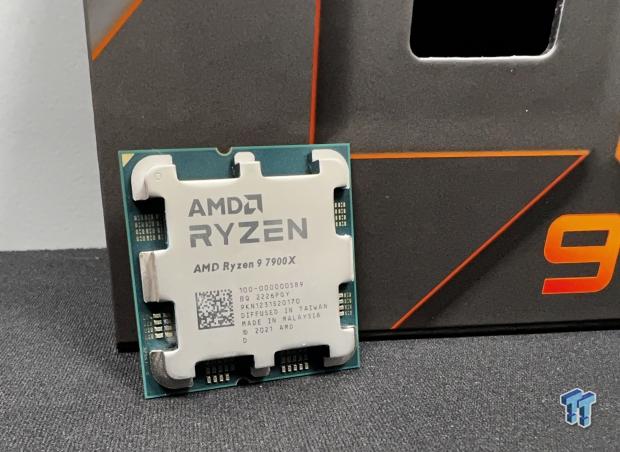
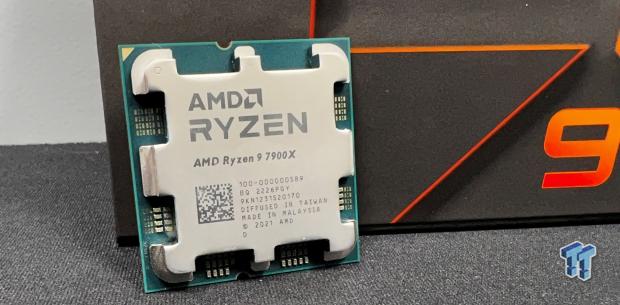
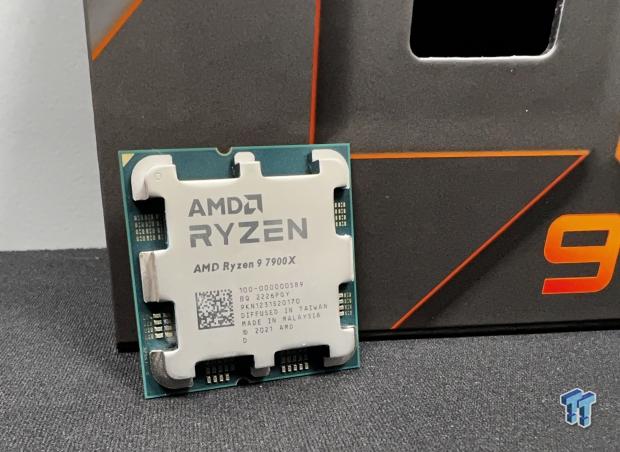
As for the CPU, you can see it has its new design, with AMD choosing to push all of the SMD capacitors to the top of the CPU, protecting them with the HIS.
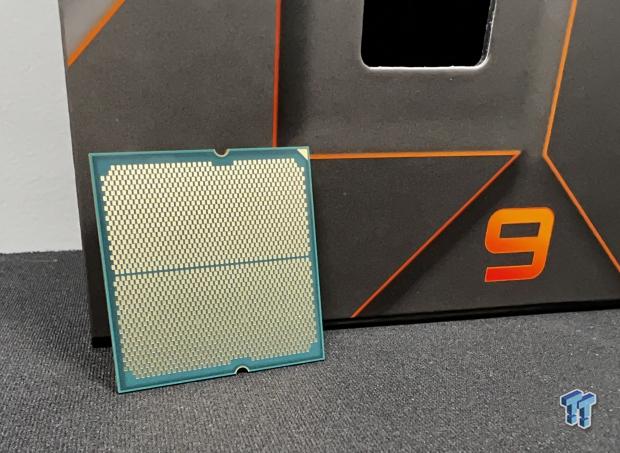
All SMD caps are on the top, leaving smooth 1718 gold pads on the bottom.
Test System
- Motherboard: X670E AORUS Master BIOS 813b
- GPU: Radeon RX 6800 XT
- RAM: Corsair Dominator RGB DDR5 6000 CL30
- Cooler: 3x140mm Custom Water
- OS Storage: Sabrent Rocket 4 Plus 2TB
- Power Supply: AORUS GP AP1200PM
- OS: Microsoft Windows 11
Cinebench, Crossmark and AIDA64
Cinebench R23
Cinebench is a long-standing render benchmark that has been heavily relied upon by both Intel and AMD to showcase their newest platforms during unveils. The benchmark has two tests, a single-core workload that will utilize one thread or 1T. There is also a multi-threaded test that uses all threads or nT of a tested CPU.
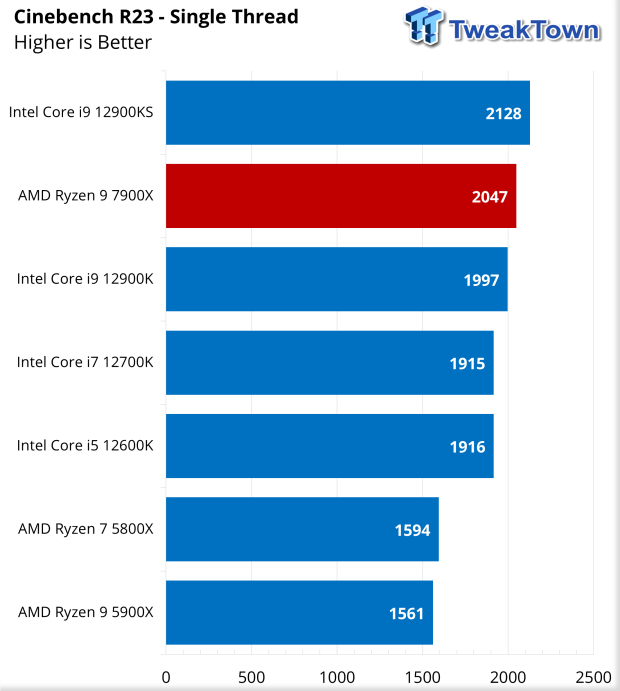
Getting into our test results with the 7900X, we start with R23. 1T the 7900X scored 2047; this puts it ahead of our 12900K by ~50 points but just behind the 12900KS.
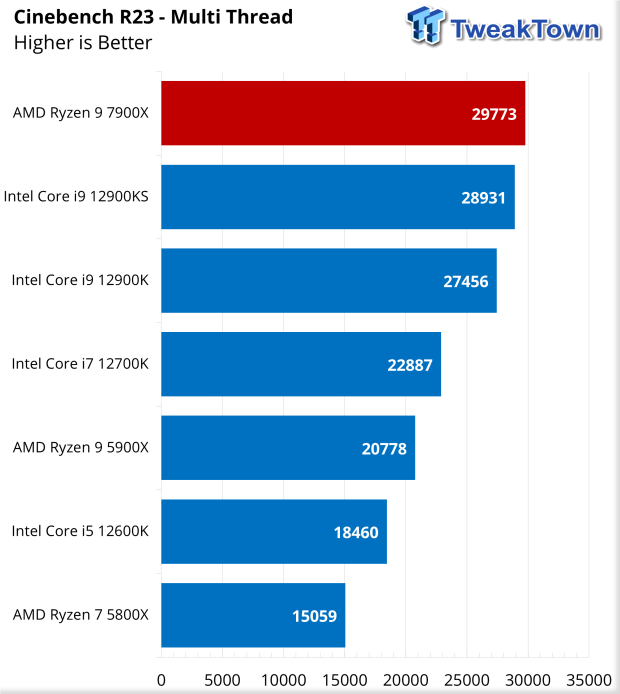
Over to multi-thread, the 7900X beat out the 12900K SKUs while offering a huge boost over its Zen 3 counterpart. The score here was 29773.
Cinebench R20 IPC
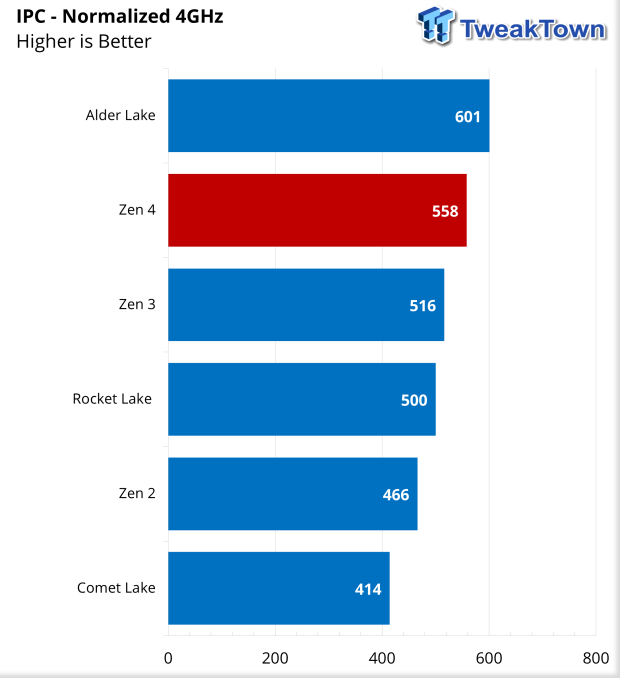
Cinebench is commonly used as a test to show IPC gains in processors normalized to a certain clock speed. We have normalized to 4GHz for several generations and can deliver the increases over the years. With Zen 4, we have a sizable gain over Zen 3, roughly 40 points. This lands Zen 4 at 558, though it trails Alder Lake IPC fairly.
Crossmark
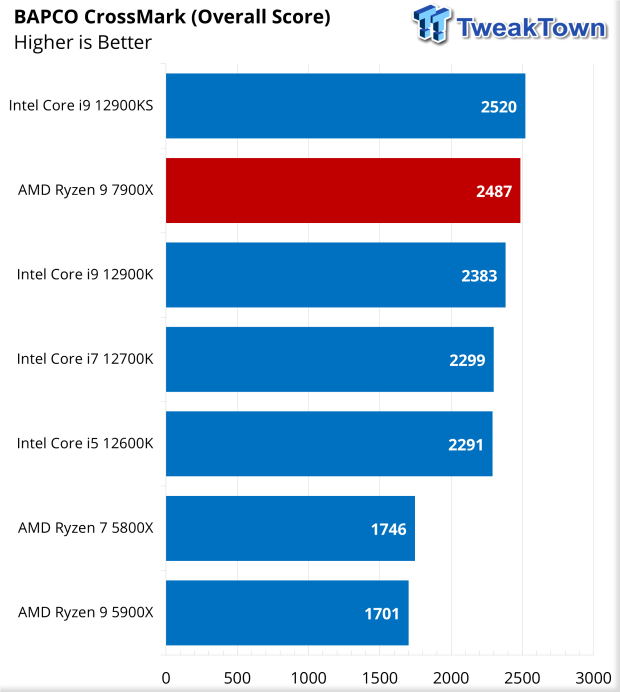
Switching workloads to CrossMark, the 7900X takes a score of 2487, a huge gain over the 5900X.
AIDA64
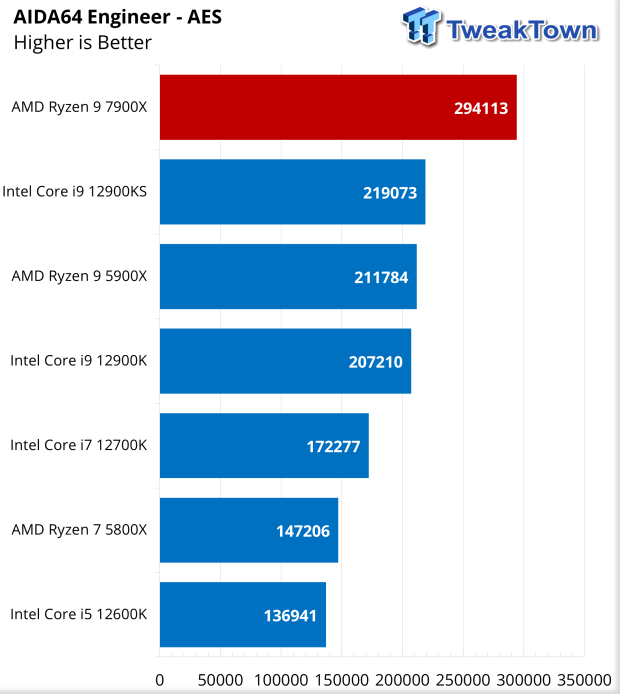
Tasks using AES certainly benefit from Zen 4. As seen above, the 7900X has no competition here as it pulls a huge 294,113 score.
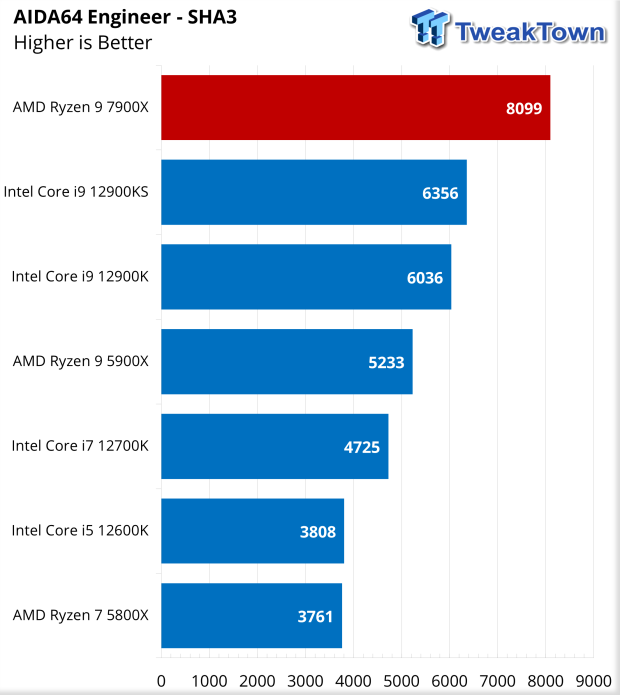
SHA3 is a very similar story, with the 7900X scoring 8099, a massive bump over the 5900X.
UL Benchmarks
Procyon and 3DMark
UL Procyon Suite
The UL Procyon Office Productivity Benchmark uses Microsoft Office apps to measure PC performance for office productivity work.
The Photo Editing benchmark uses Adobe® Lightroom® to import, process, and modify a selection of images. In the second part of the test, multiple edits and layer effects are applied to a photograph in Adobe® Photoshop®.
The Video editing benchmark uses Adobe® Premiere® Pro to export video project files to common formats. Each video project includes various edits, adjustments, and effects. The benchmark score is based on the time taken to export the videos.
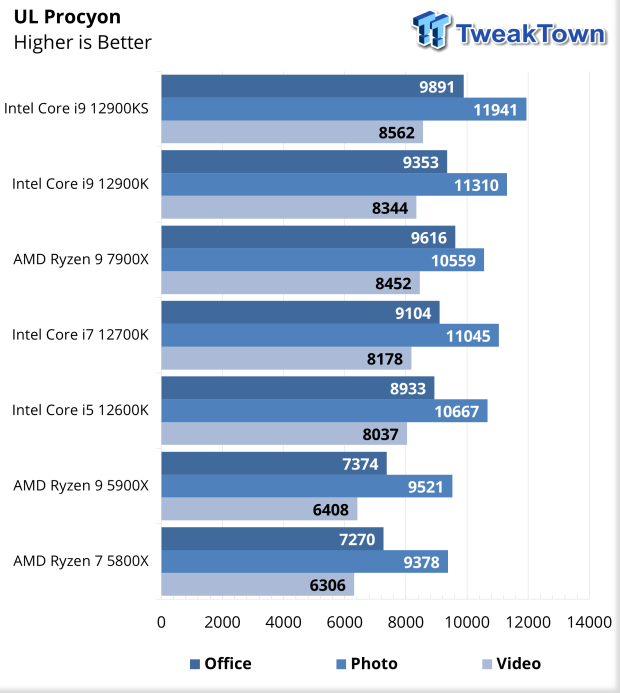
In each of the workloads within Procyon, the 7900X offers solid increases over the 5900X. For instance, we see a near 2300-point jump in office; 7374 to 9616. Photo workloads move from 9521 with the 5900X to 10559 with 7900X, and video moves from 6408 to 8452.
3DMark
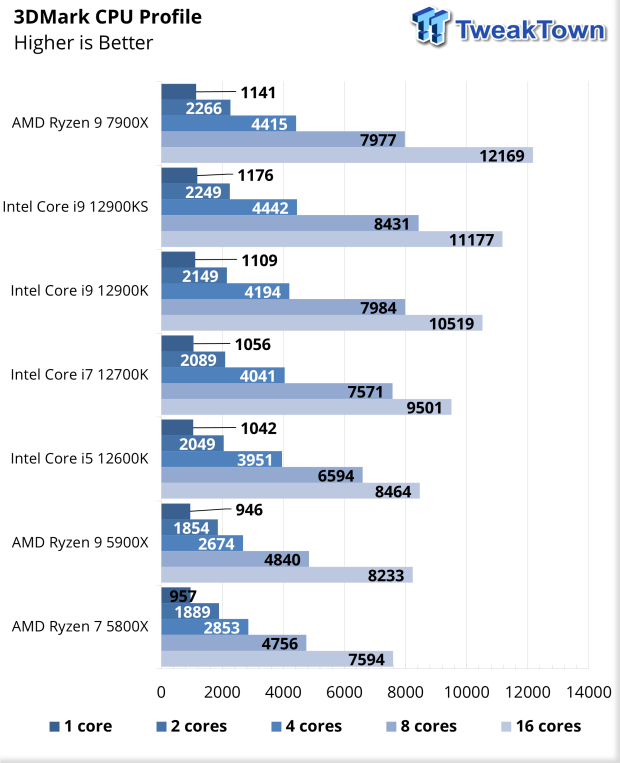
The first of our 3DMark workloads has us in CPU Profile. In this scenario, the 7900X offers us a single thread score of 1141 alongside its 16-thread score of 12169.
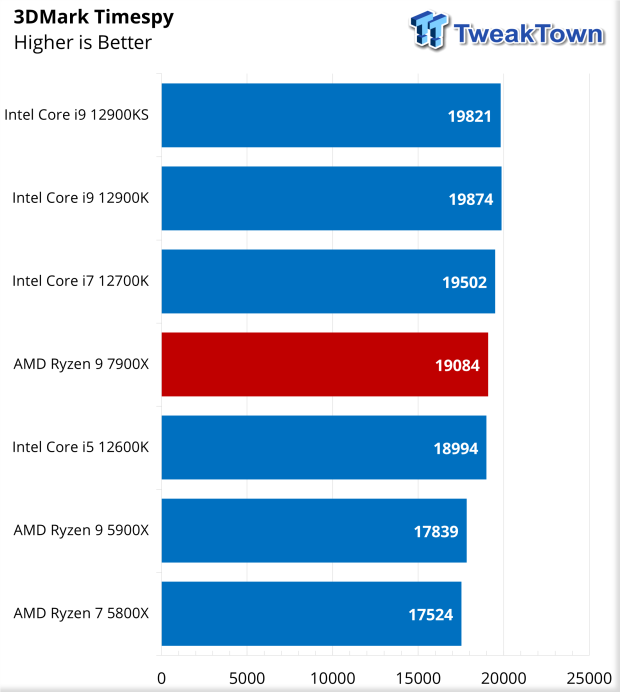
Our first "gaming" scenario lands us a score of 19084 in Timespy with our 6800 XT.
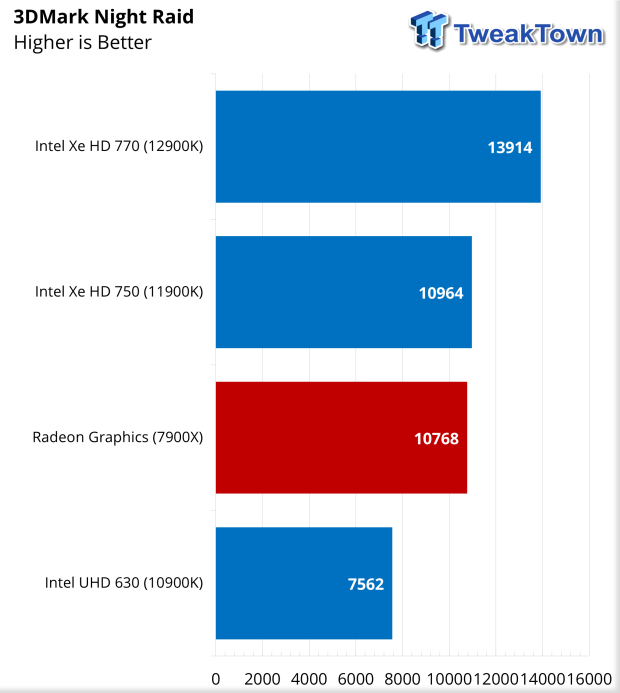
Night Raid allowed us to remove the 6800 XT discrete solution from our test machine and run just the integrated RDNA2 solution. With this setup, we scored 10768, landing between 10th and 11th Gen Intel integrated solutions.
Gaming and Power Consumption
Gaming Performance
Diving into gaming, we added a few new games to our list, keeping Tomb Raider as its cornerstone at this point. We also stayed with Horizon Zero Daw but added CyberPunk 2077 and AC Valhalla, swapped out Far Cry New Dawn for Far Cry 6, and then paid homage to Rockstar by adding GTAV. With some of these new scenarios, we only have results moving forward.
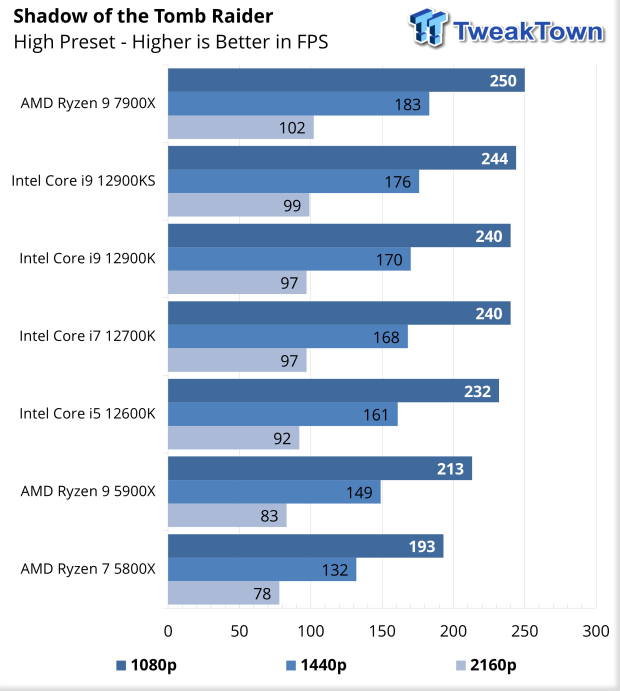
Starting with Tomb Raider, the 7900X produces 250 FPS at 1080p, a solid 37 FPS gain over 5900X, and 6 FPS over the 12900KS. At 4K, things bunch up a bit more; the 7900X offers 102 FPS while the 12900KS is right behind at 99 FPS.
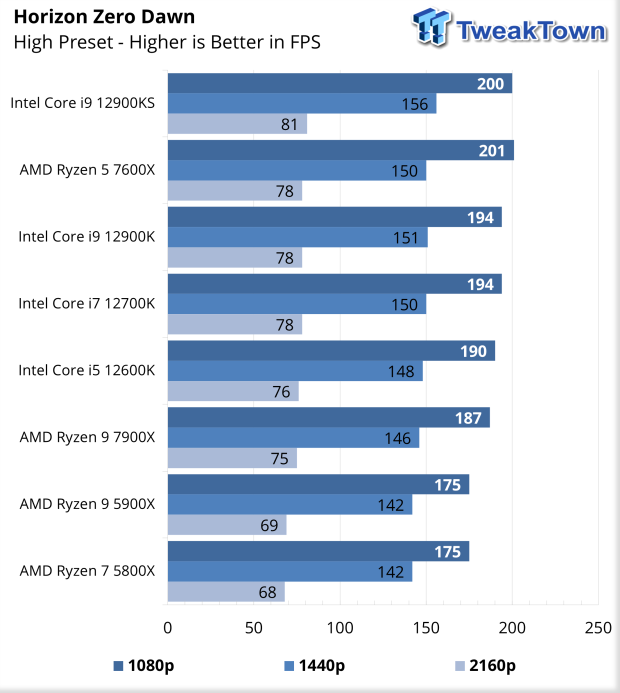
Horizon ZD offers up 187 FPS to the 7900X at 1080p and drops to 75 FPS at 4K.
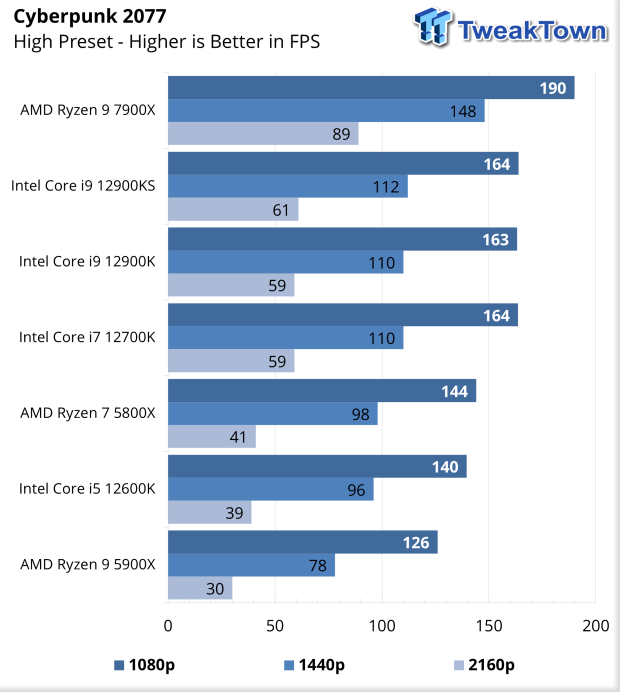
Cyberpunk pushes the 7900X to 190 FPS at 1080p, a near 70 FPS improvement over 5900X. 4K lands at 89 FPS, giving Zen 4 a good 28 FPS advantage over the Intel solution and doubling the frame rate of the 5900X.
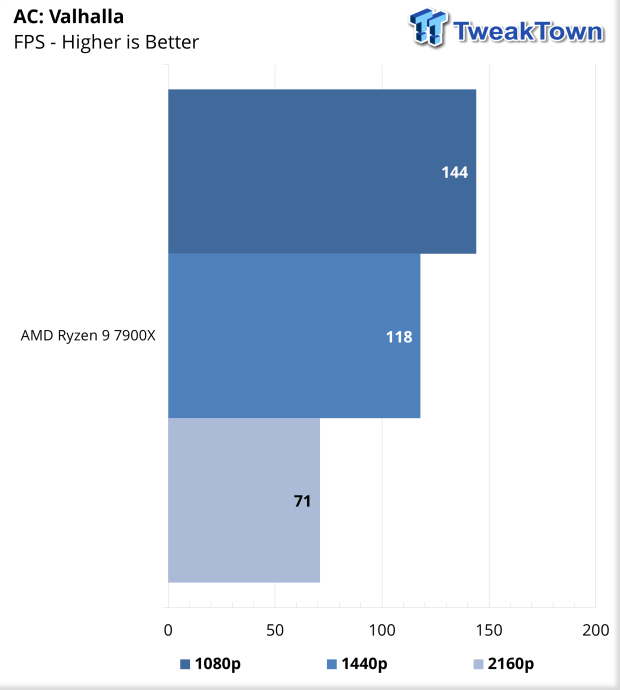
Getting into our new benches, the 7900X grabbed 144 FPS in Valhalla at 1080p and dropped to 71 FPS at 4K.
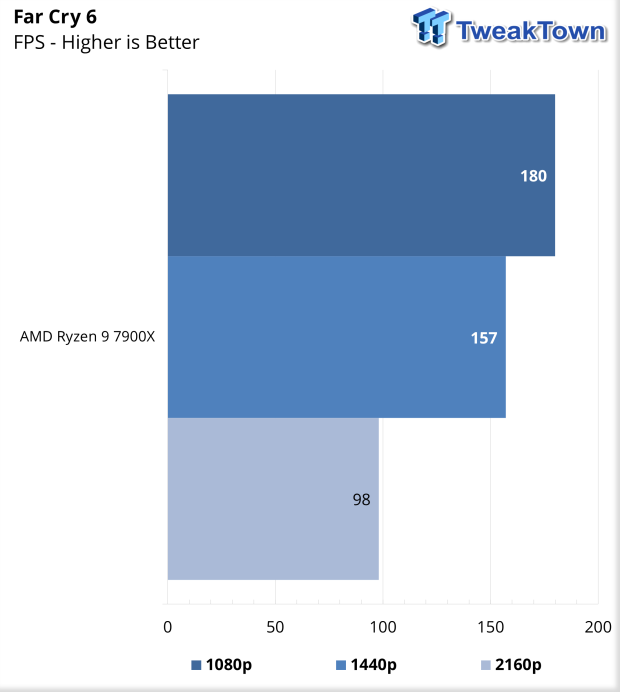
FC6 peaks at 180 FPS for the 7900X with a low of 98 FPS at 4K.
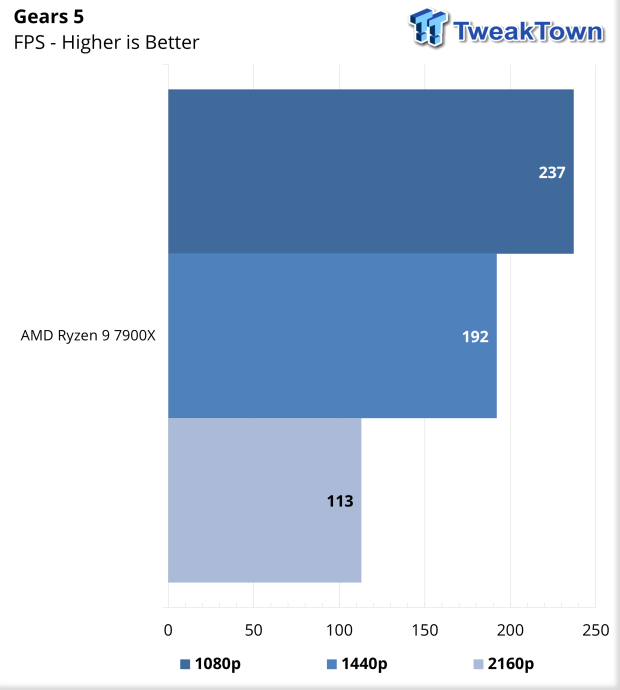
Gears 5 offers a massive 237 FPS at 1080p, moving to 192 FPS at 1440p and 113 FPS at 4K.
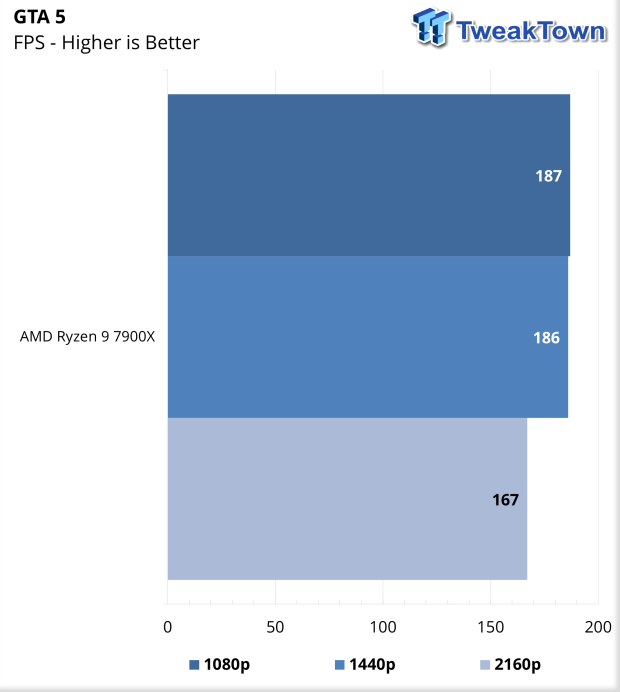
GTA5 shares framerates for 1080p and 1440p at 187 FPS, and 4K drops to 167 FPS.
Power, Value, and Final Thoughts
Power Consumption
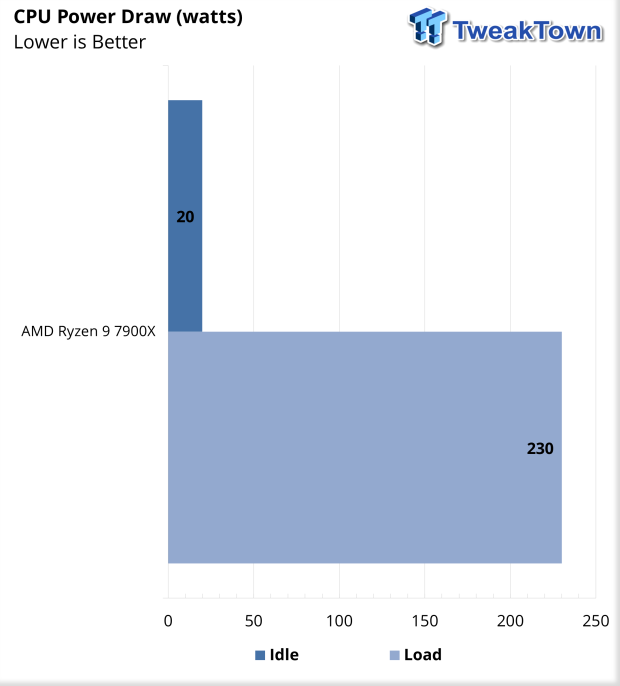
Power consumption is measured directly from the dual eight-pin connections. At peak, the 7900X pulled the socket limit of 230W, while during idle, we saw just 20W.
Value
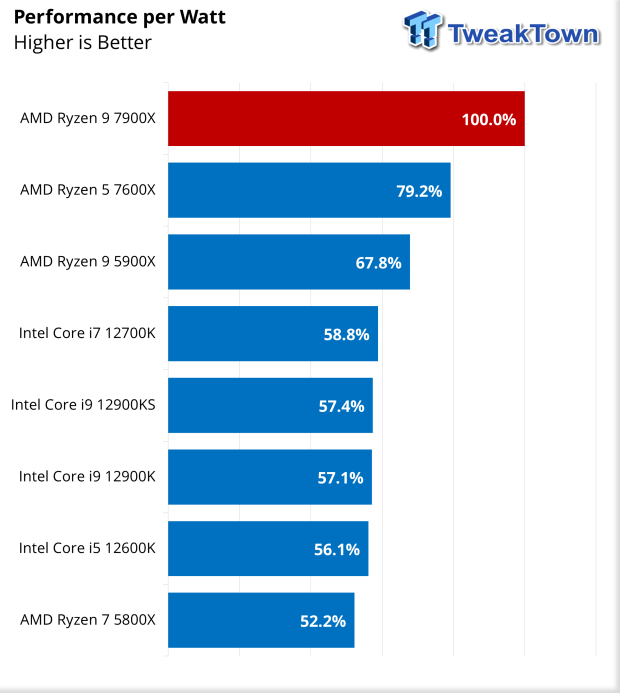
Looking at Performance per Watt, the 7900X offers the best performance per watt of the CPUs we have tested.
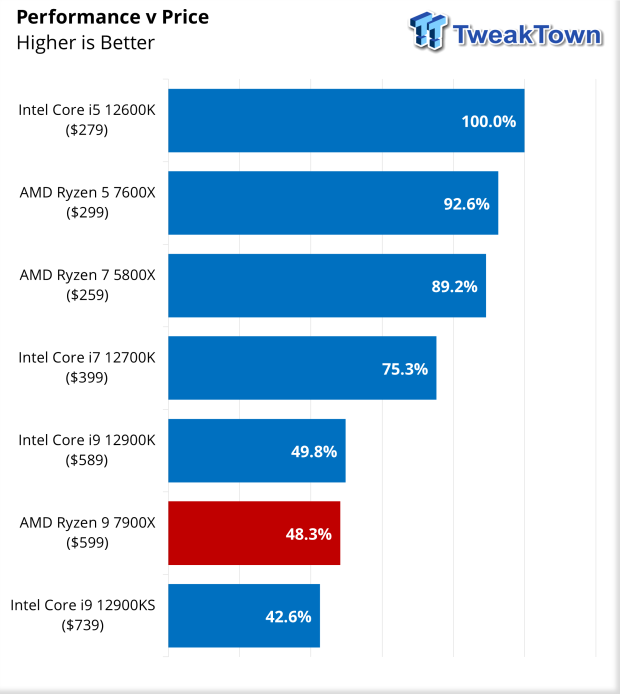
Adding in cost to the equation using current market pricing as of this writing, the 7900X lands near the bottom at 48% in the realm of the 12900K and KS.
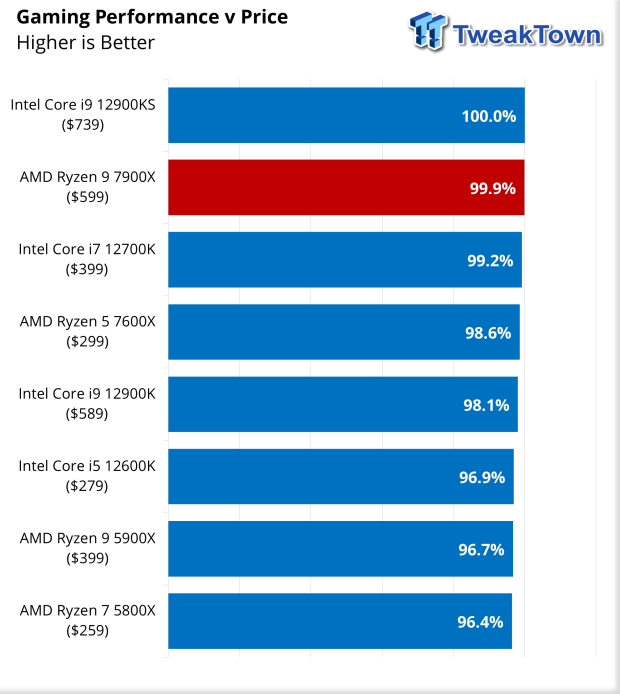
Taking a second jab at Price vs. Performance, this time using gaming as the performance metric. The 7900X lands at the top of this chart, with the 12900KS as the best gaming CPU for the money.
Final Thoughts
"Don't believe the hype" should probably be the tagline for this review. Still, we get sucked into this same scenario launch after launch, and it's mostly the media sites, hell, even TweakTown, that gets us all fired up for huge gains and the never-ending Intel vs. AMD war.
Unless we will purpose-build CPUs for whatever scenario a consumer wants to use the machine for, any given CPU isn't going to land at the top of all benchmark charts. All that behind me, after spending time with Zen 4, I'm relatively impressed with what AMD has done. Gen over gen, the 7900X beats the hell out of the 5900X, and with a new platform underneath it, consumers finally get to see what DDR5 and PCIe Gen 5 has in store for AMD.
At the top, we started with single-thread performance and found it has increased immensely, offering a near 500-point gain in R23 and near 200 points in CPU Profile. Multi-thread shows an improvement of 9000 points in R23 and nearly 4000 points in CPU Profile. If we move over to workload scenarios, CrossMark enjoys a 700+ point gain going from 5900X to 7900X, and Procyon moves AMD from the bottom of our charts with 5900X to the top with 7900X.
Switching focus to gaming, Zen 4 does quite well paired with our 6800 XT. Tomb Raider saw peaks of 250 FPS in 1080p - around a 35 FPS improvement when looking at the 5900X. Horizon saw 187 FPS, about 10 FPS over 5900X, and Cyberpunk showed 190FPS vs. 126 FPS with the 5900X.
In this same vein, we look at power numbers from the 7900X, which measuring direct gave us a 20-watt idle draw and a peak at 230 watts, which is the socket limit. Adding these numbers to those charts, we have just above given the 7900X the best performance per watt of any CPU we have tested.

