


Our Verdict
Pros
- Platform upgrade
- Performance
- Efficiency (performance per watt)
- Cores and threads
Cons
- IPC
- CPU runs hot
- Price ($100 more than 13900K)
Should you buy it?
AvoidConsiderShortlistBuyIntroduction and Pricing
Admittedly, we are a bit late to the party with our AMD Ryzen 9 7950X processor review, but I didn't want to rush my testing, and we didn't receive this chip until launch day. At any rate, we were able to spend a few days testing and tuning with the 7950X, populating our charts with some impressive numbers. That said, up to this point, I'm not hugely impressed with Zen 4; though it does offer a significant boost over Zen 3, it doesn't give enough headroom to AMD for Intel's 13th Gen launch, which is coming up quickly.
Can the 7950X change this? Let's find out!
Specifications and Pricing
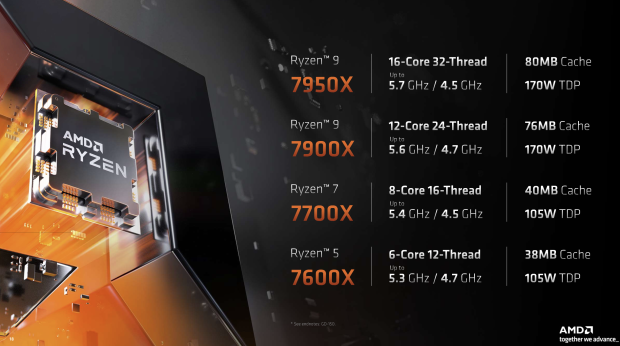
We have gone over this in each of the four Zen 4 reviews we have now published; the product stack for Zen 4, seen above, includes four SKUs hitting shelves for launch day, which was the 26th of Sept. Starting from the bottom, the 7600X is the six core 12 thread part, 105W TDP and 38MB cache with a 4.7GHz base and 5.3GHz boost clock. The 7700X is next with its full single CCD design, eight cores, 16 threads, a 4.5GHz base, and a 5.4GHz boost. It has the same 105W TDP but slightly more cache at 40M.
The 7900X, which we covered on launch day, is a 12-core 24-thread design at the higher 170W TDP; it has a larger cache at 76M and a higher base clock at 4.7GHz and boosts at 5.6GHz. The top-end SKU and our focus for this review is the Ryzen 9 7950X; it is the full enchilada, 16 core 32 thread, 170W TDP with 80M caches. Its base clock is 4.5GHz, with the highest boost of all Zen 4 parts at 5.7GHz.

Best Deals: AMD Ryzen 9 7950X 16-Core, 32-Thread Unlocked Desktop Processor
Price Trend:
Prices last scanned 1 hour and 18 minutes ago
7 days ago: $501 USD30 days ago: $442.04 USD
7 days ago: $704.99 CAD30 days ago: $675 CAD
7 days ago: £45030 days ago: £462.99
Pricing has the 7600X coming in at $299, with the 7700X right behind at $399. The 7900X and 7950X are listed at $549 and $699, respectively.
Ryzen 9 7950X and Test System
For those wanting information on the AMD Zen 4 Architecture, you can read that here.
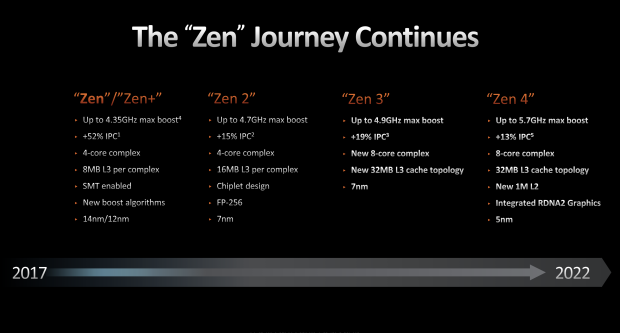
Zen 4 uses much of the design AMD launched with Zen 3, including the eight-core complex and cache topology. That said, there have been significant improvements in the design, allowing for higher boost clocks, up to 5.7GHz on the 7950X, a larger L2 cache, and finally, Integrated graphics from the RDNA2 family.
Our Latest AMD CPUs Review Coverage
- AMD Ryzen 7 9850X3D Review - The best gaming chip just got better
- AMD Ryzen 9 9950X3D Review - The all-round X3D chip we've been waiting for
- AMD Ryzen 7 9800X3D Processor Review - All of the gaming goodness without compromise
- AMD Ryzen 9 9900X CPU Review
- AMD Ryzen 9 9950X CPU Review - Top Dog Zen 5 Tested
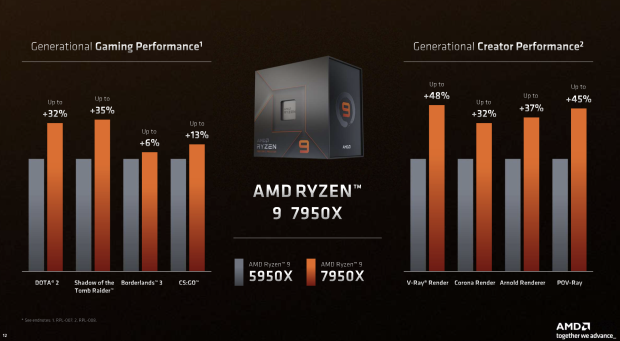
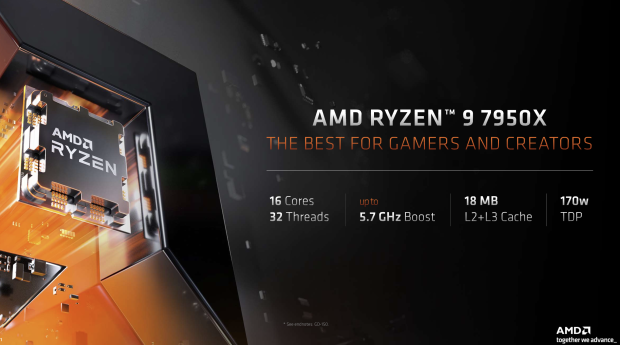
AMD has really put much of its hype on the 7950X, the above slide showing both Gaming and Creator performance uplifts over the 5950X.
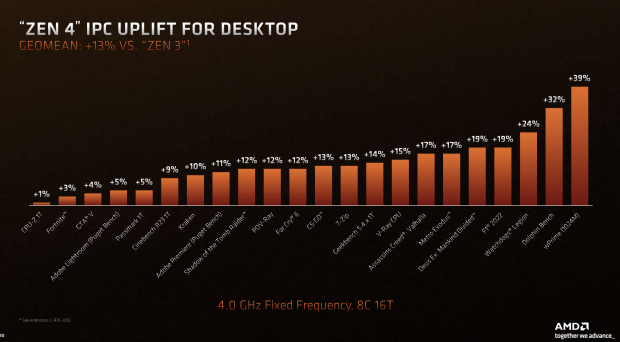
AMD Zen 4 offers a good boost to IPC, as seen in its chart above, vs. Zen 3.
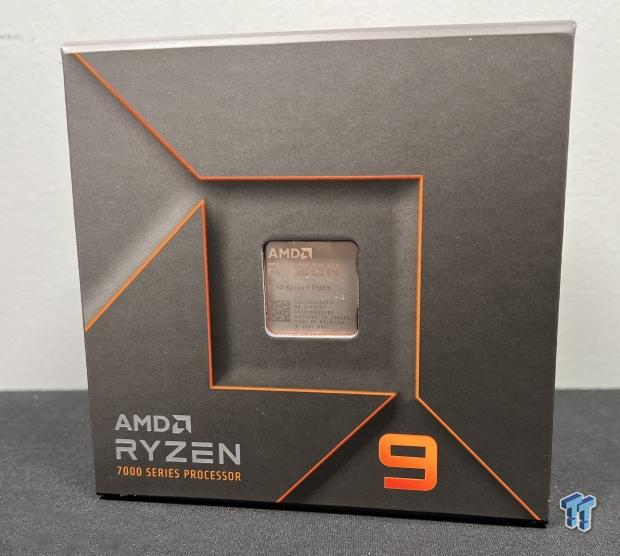
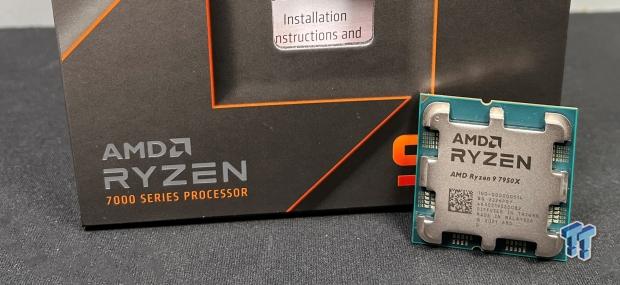
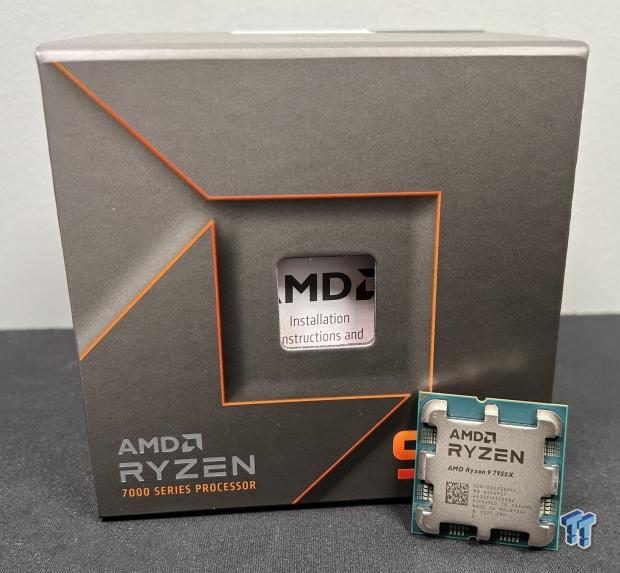
Packaging includes the new box art seen above; branding includes the Ryzen 9 logo and a window to the CPU.
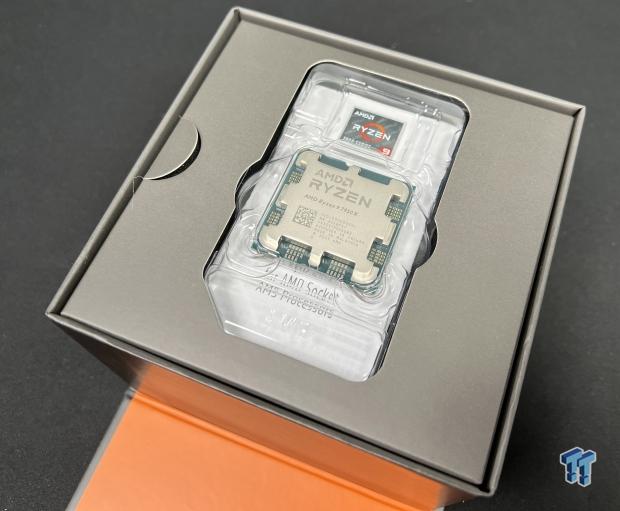
Unboxing, the 7950X is secured in its plastic retainer with a Ryzen 9 sticker for your chassis and reading materials underneath.
As with past Zen 4 articles, the 7950X has the same HIS design, shielding the SMD caps.
On the bottom, we have a smooth surface with the 1718 pads for AM5.
Test System
- Motherboard: X670E AORUS Master BIOS 813b
- GPU: Radeon RX 6800 XT
- RAM: Corsair Dominator RGB DDR5 6000 CL30
- Cooler: 3x140mm Custom Water
- OS Storage: Sabrent Rocket 4 Plus 2TB
- Power Supply: AORUS GP AP1200PM
- OS: Microsoft Windows 11
Cinebench, Crossmark and AIDA64
Cinebench R23
Cinebench is a long-standing render benchmark that has been heavily relied upon by both Intel and AMD to showcase their newest platforms during unveils. The benchmark has two tests, a single-core workload that will utilize one thread or 1T. There is also a multi-threaded test that uses all threads or nT of a tested CPU.
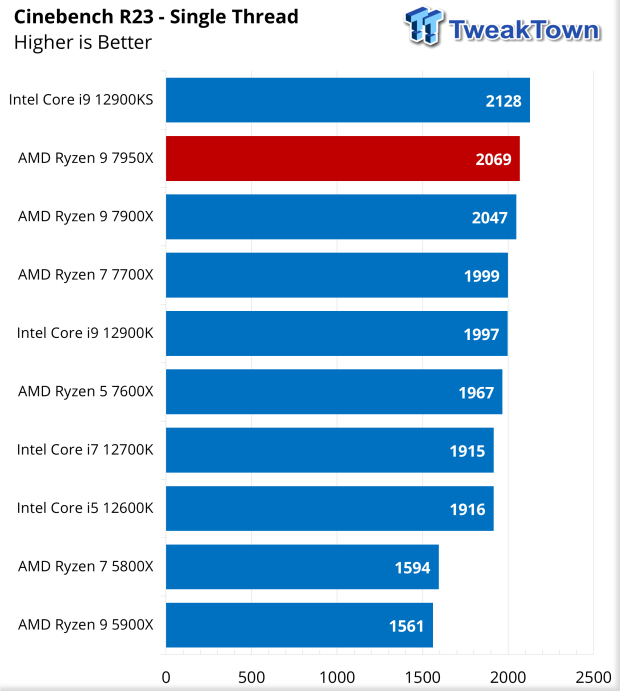
In single thread, the 7950X creeps closer to the 12900KS with a score of 2069.
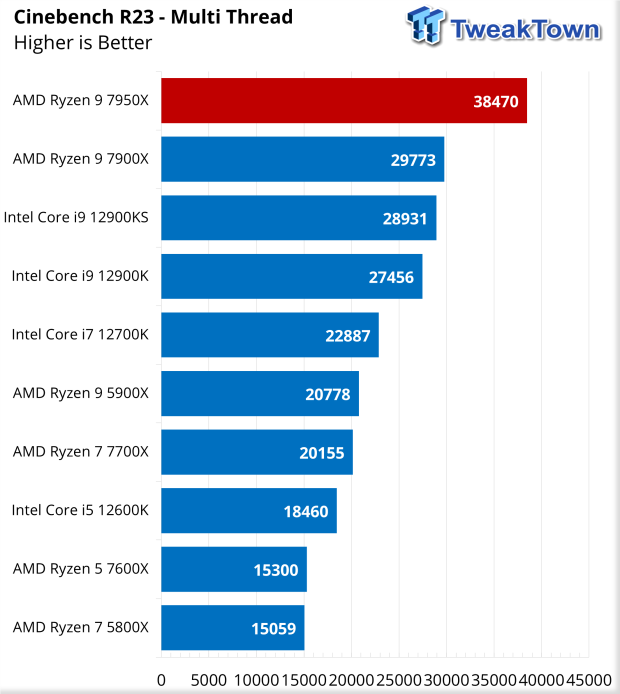
Over in multi-thread, the 7950X goes to work, landing a huge score of 38470.
For those wanting information on Zen 4 IPC, you can read here.
Crossmark
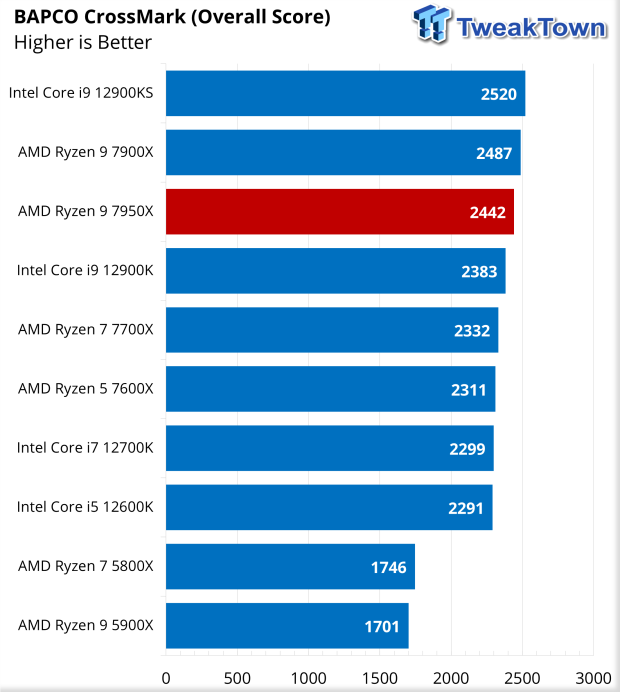
CrossMark landed the 7950X with an overall score of 2442, right behind the 7900X and just in from of the 12900K.
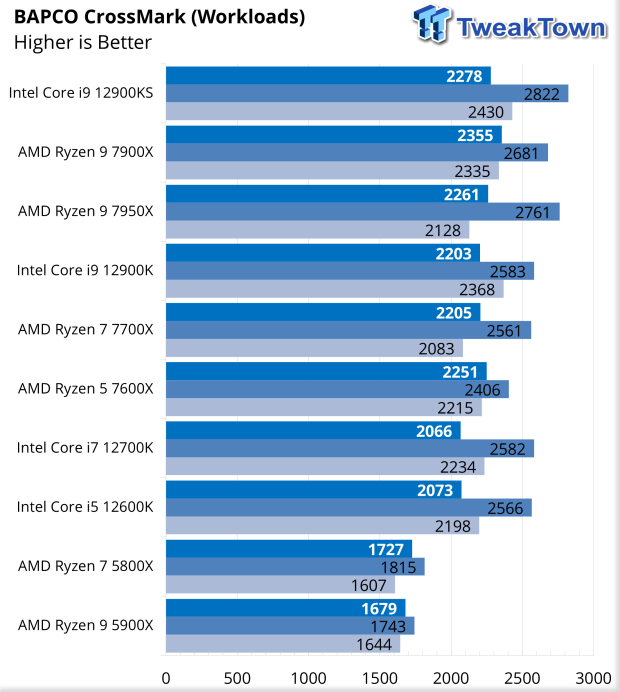
Above, we have a quick look at the workload breakdown.
AIDA64
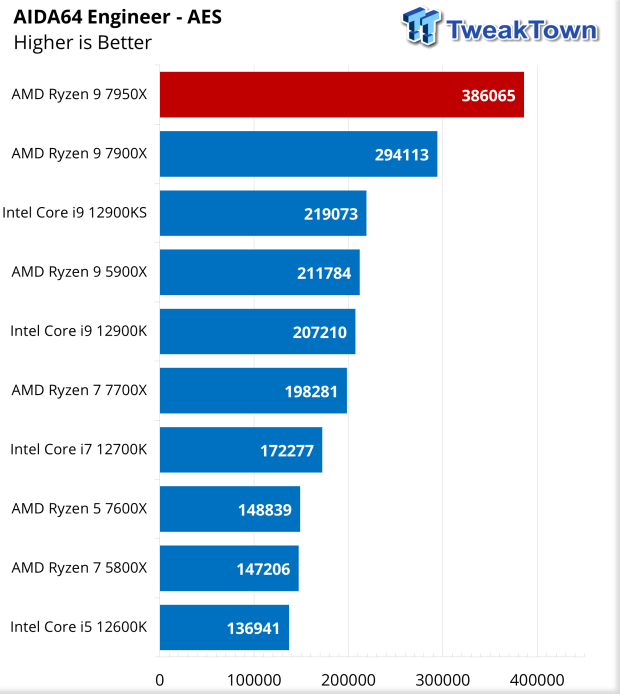
Tasks using AES certainly benefit from Zen 4. As seen above, the 7950X has no competition here as it pulls a huge 386K!
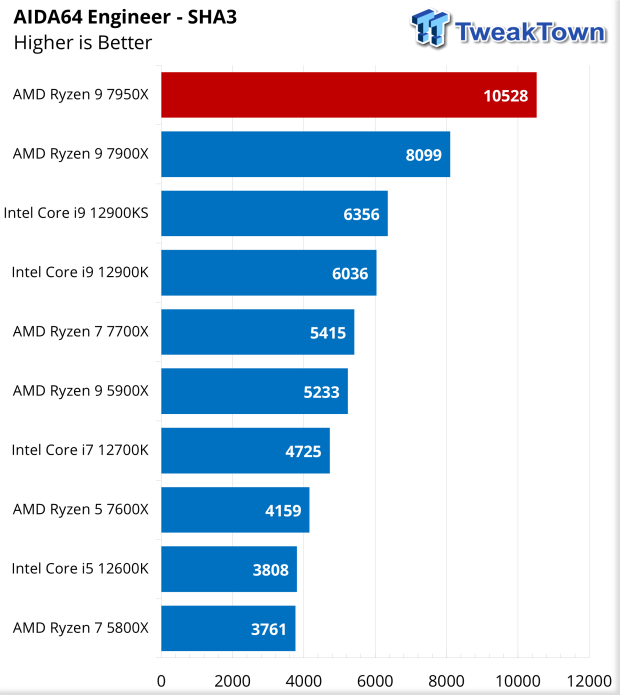
SHA3 is very similar, the 7950X taking a score of 10528; nothing really comes close to it.
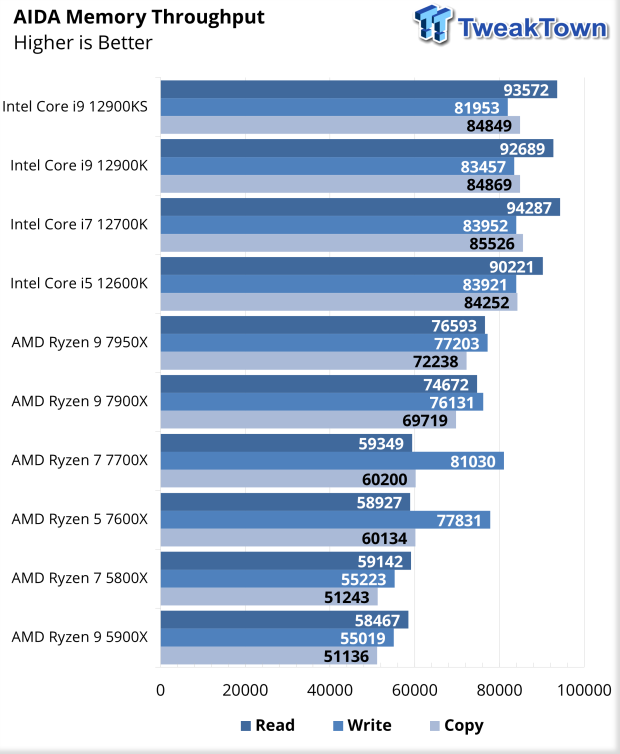
Adding in memory throughput, the 7950X offered 76K across the board with our Dominator EXPO kit.
UL Benchmarks
Procyon and 3DMark
UL Procyon Suite
The UL Procyon Office Productivity Benchmark uses Microsoft Office apps to measure PC performance for office productivity work.
The Photo Editing benchmark uses Adobe® Lightroom® to import, process, and modify a selection of images. In the second part of the test, multiple edits and layer effects are applied to a photograph in Adobe® Photoshop®.
The Video editing benchmark uses Adobe® Premiere® Pro to export video project files to common formats. Each video project includes various edits, adjustments, and effects. The benchmark score is based on the time taken to export the videos.
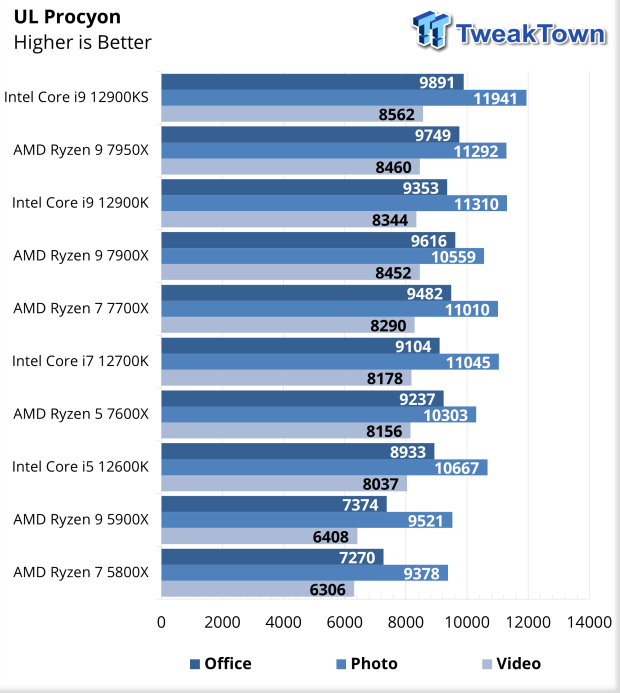
7950X did well in UL Procyon, the best Zen 4 at this point, excelling in Photo and Office.
3DMark
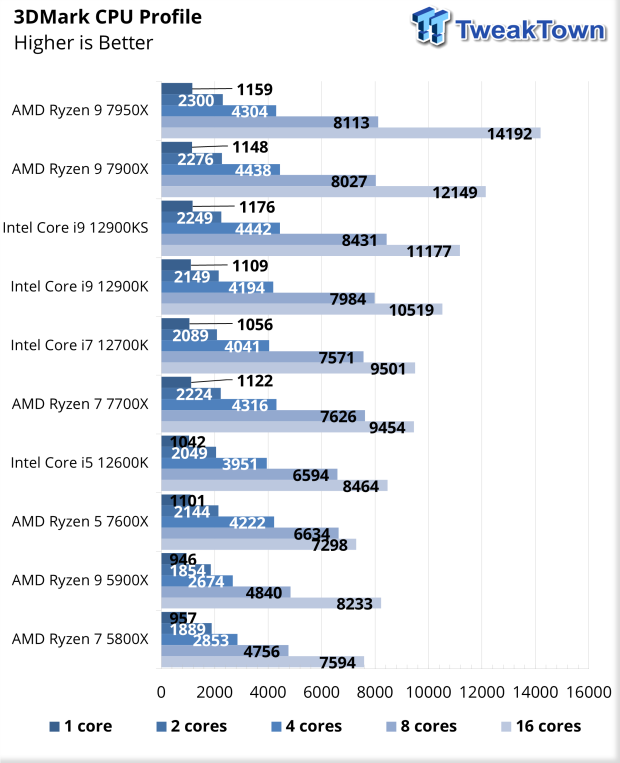
CPU Profile showed the 12900KS was better in a single thread, but as threads climbed, the 7950X did better and better, reaching a sixteen thread score of 14192.
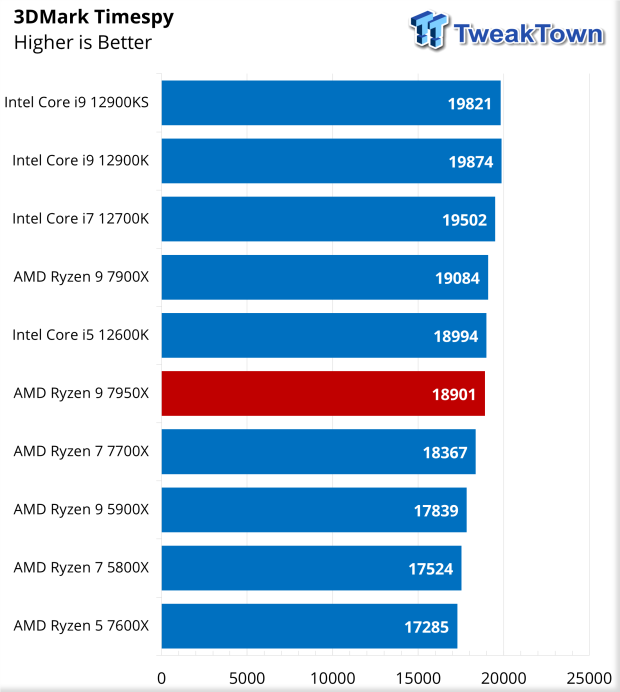
Our first "gaming" scenario is Timespy, landing us a score of 18901 overall.
Gaming and Power Consumption
Gaming Performance
Diving into gaming, we added a few new games to our list, including Ac Valhalla and Far Cry 6. We kept CyberPunk as we have been using it with our 12900KS on motherboard reviews, so we have a decent comparison.
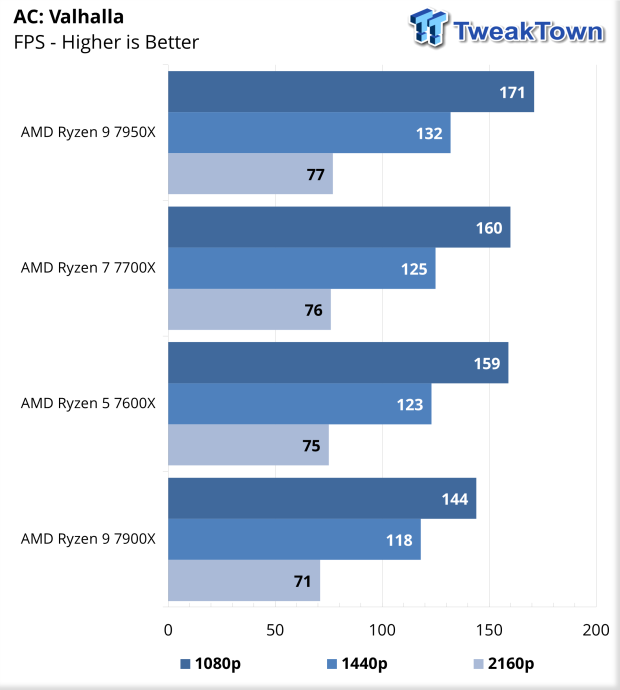
Starting things off with Valhalla, the 7950X, surprisingly did the best at 1080p with its higher boost clock allowing for 171 FPS. At 4K, all four samples perform about the same.
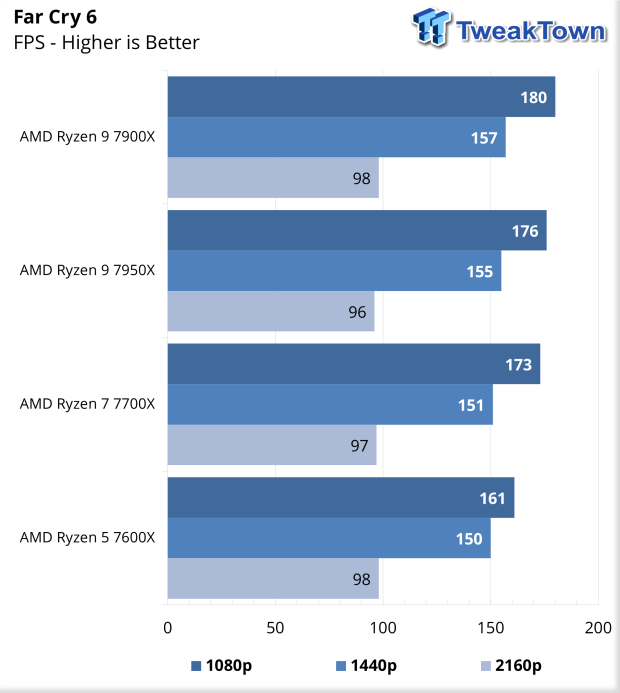
FarCry 6 offered 176 FPS at 1080p; again, 4K was more on the GPU than CPU, with all four performing the same.
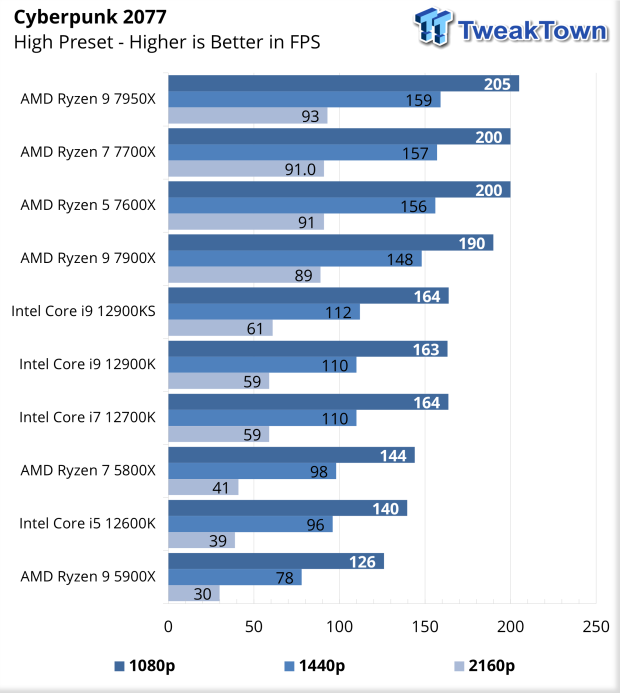
Cyberpunk pushes the 7950X to 205FPS at 1080p, a few frames quicker than the 77 and 7600X.
Power Consumption and Thermals
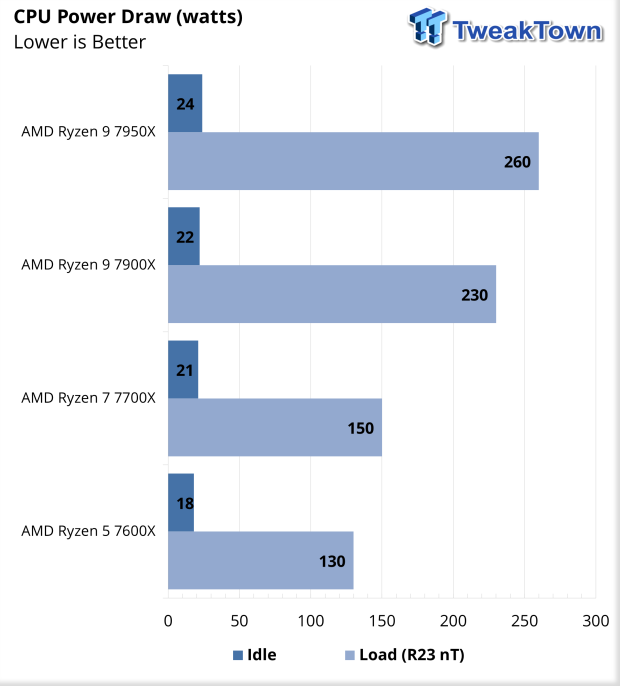
Power consumption is measured directly from the dual eight-pin connections. The peak power draw was 260W with the 7950X, while idle was just 24w.
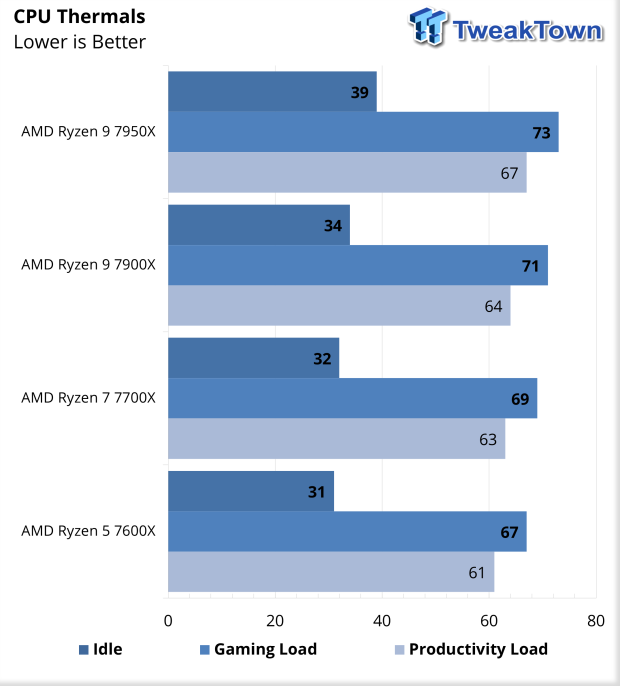
I know I mentioned it in the 7700X review, but our cooling setup is massive overkill for any CPU, so our results won't necessarily reflect what you would see on an AIO. That said, the 7950X peaked at 73c during gaming and 67c during Procyon testing.
Value and Final Thoughts
Value
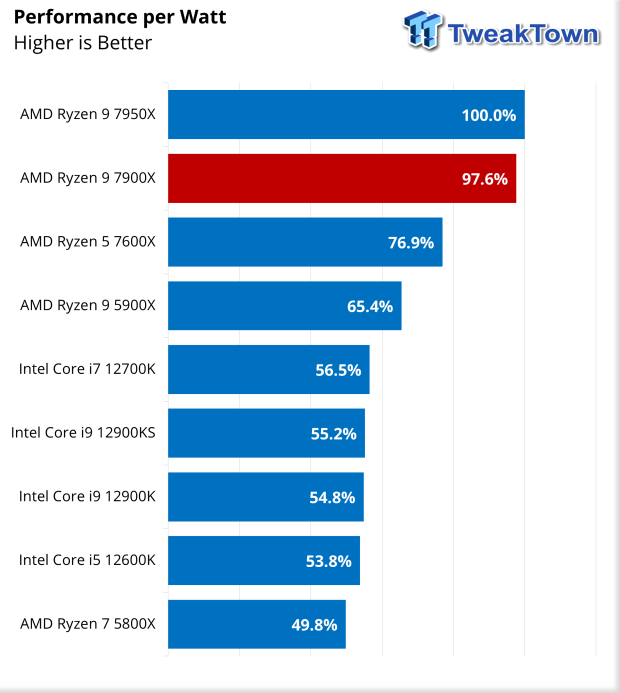
Looking at Performance per Watt, the 7950X offers the best performance per watt, with the 7900X right behind. After that, a huge fall off for the remaining CPUs.
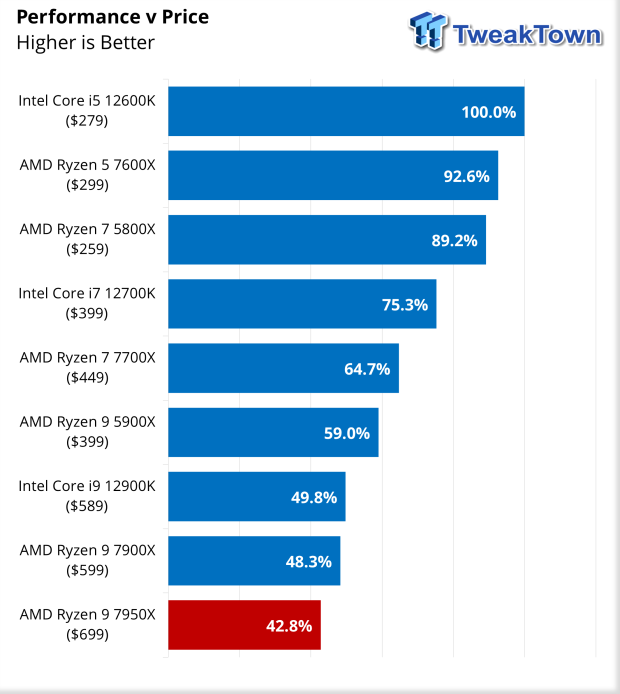
Adding cost to the equation using current market pricing as of this writing, the 7950X lands at the bottom as the worst CPU in bang for your buck.
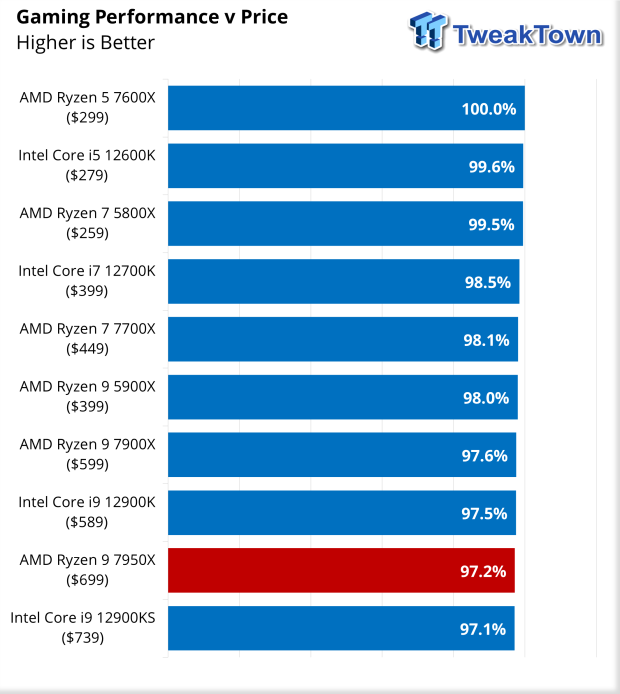
Switching the performance metric to gaming, the 7950X still isn't the best value, but it's not far behind, with all CPUs landing within a few % of each other.
Final Thoughts
The 7950X is no doubt a very strong CPU; it performed at the top of every workload, single thread because of its high boost clocks and multi-thread showed what all those cores could do. It was a bit mixed with some workloads like CrossMark, where it was under both the 7900X and 12900KS, a CPU most have seemingly forgotten about. In Procyon, the 7950X again did well, towards the top with the 12900KS.
Gaming scenarios were hit and miss; Timespy had it in the middle while testing a few games. The 7950X was at or near the top every time, including CyberPunk which showed an impressive 205FPS at 1080p. Zen 4 has excelled in power draw, which has kind of become AMD's thing now; the 7950X delivered here, too, uses just 30 watts more than the 7900X and exactly double the 7600X. CPU Thermals were fine, but again our cooling loop is overkill; a 73c peak for the 7950X probably isn't realistic for anyone on an AIO or Air.
Looking at value, Per per watt was amazing, Top of our charts at 100%, the 7900X followed just behind and switching to performance v price, using both productivity workloads along with gaming, the 7950X was near the bottom in both scenarios, really because it is overkill for gaming and its higher price tag.
 Intel Arc G3 Extreme first impressions with MSI's Claw 8 EX AI+ - Incredible power for an extreme price
 Intel Core Ultra 5 250K Plus CPU Review - Shaking up the entry-level
 Intel Core Ultra 7 270K Plus CPU Review - The 285K is now obsolete
 AMD Ryzen 7 9850X3D Review - The best gaming chip just got better
 Intel Core Ultra 9 285HX vs. 285K CPUs Head-to-Head - Desktop Power in a Laptop Form Factor
 Report: Minecraft profits used to fund Xbox games portfolio
 Assassin's Creed Black Flag Resynced has $80 worth of cosmetics and time-saving DLC
 Need For Speed seemingly on ice as Criterion becomes a Battlefield studio
 51 Ubisoft employees who worked on the successful Assassin's Creed Black Flag Resynced have just been laid off
 AMD expands Ryzen 200 and 100 'Hawk Point' APU lineup with 11 new SKUs
 Open-Source Windows alternative ReactOS runs Half-Life 2 on a GTX 960
 NVIDIA and Sega to celebrate 30 years of partnership at a 'Guerrilla event' in Japan
 Mysterious AMD Ryzen 7 4700LE 'Zen 2' desktop CPU appears in a new prebuilt PC paired with an RTX 3050
 Apple bucks the PC market downtrend with 10.1% growth amid global supply constraints
 New iPhone generation could cost $300 more while Apple keeps similar profit margins
 Turtle Beach Stealth Pro II Wireless Gaming Headset Review - Premium Sound, Fantastic Features
 MOZA MGX1000 Instrument Panel Review: a realistic Garmin G1000 replica for immersive flight sims
 Simagic Zeus Formula Steering Wheel Review: premium build and advanced inputs for F1 racing
 GIGABYTE X870E Aero X3D Dark Wood Review - A woody goody
 The Super Mario Galaxy Movie (2026) 4K Ultra HD Blu-ray Review
 KTC H49S66 5K2K (5120x1440) 49-inch 180Hz Gaming Monitor Review
 HighPoint Rocket 1604L Gen5 x16 NVMe Software RAID AIC Review: half the price with full 59 GB/s speed
 Next Level Racing ERS3 Haptic Seat Review: immersive sim racing comfort with integrated haptics
 ASUS TUF Gaming X870-Pro WiFi7 W NEO Review - Tuffed up
 GIGABYTE GO27Q24G Gaming Monitor Review: Glossy OLED Gaming at 240Hz
 Don't sell your Windows laptop until you do these things
 6 PC cleaning mistakes to avoid for safer hardware maintenance
 Phison and Intel Take Aim at Local AI's Memory Wall with aiDAPTIV
 How to Remap Keyboard Keys in Windows using Microsoft PowerToys
 7 tips to organize your Windows files for faster, easier access
 How to fix Wi-Fi Adapter Not Working on Windows laptops: troubleshooting tips
 Hisense U7SG 4K TV: Modern Entertainment for the New Age
 6 underrated Microsoft Word features worth using to boost your productivity
 Level Up Your PC Gaming with these Fantastic ASUS Prime Day Deals on GPUs, Motherboards, and More