


Introduction
Toshiba's Q Series Pro is a drive that you may not have heard of - yet. Toshiba launched this drive a couple of months back, and we've finally got our hands on a pair. Toshiba is one of the largest NAND flash manufacturers on the planet; in fact, most of the top performing drives we're seeing these days are equipped with 19nm Toshiba flash in BGA packages.
When you make the flash, you bin the flash, and when you bin the flash, you save the best for your own products, and sell the rest. When you have access to the best performing flash, you can make the best performing SSD's. Toshiba is in this enviable position. Toshiba can make SSD's that feature the very best binned flash, and still produce those drives for less cost than any fabless SSD manufacturer.
It's all about the flash. NAND accounts for 85% of the cost of manufacturing an SSD. While controllers are important, aren't responsible for all of the performance of the SSD. The NAND plays a very vital part. NAND is like the blood in a heart, while the controller is like the heart itself. If the blood is bad, it doesn't matter how good the heart works, the outcome will still be unfavorable. Typically, LBA mapping tables are kept in DRAM to speed up performance of the SSD's internal functions. The Q Series Pro doesn't use DRAM, likely because the NAND is fast enough to provide the performance on its own. This is the first time I've seen a retail SSD with a DRAM-less design, other than SandForce.
A DRAM-less design is where Toshiba is "breaking all the rules," so to speak. The thing about a DRAM-less design is that without DRAM, synthetic benches don't get smoothed out, and write performance seems choppy and inconsistent. However, this choppy performance doesn't really manifest itself until we load the drive up with data.
The Q Series Pro's performance with data on the drive is a perfect example of why FOB (Fresh out of Box) testing (testing without data on the drive) can never accurately depict a drive's actual performance. I mention this because some reviews I've read from sites that review utilizing FOB testing have totally missed the mark when they reviewed the Q Series Pro. If you don't test with data on the drive, then you won't see the choppy write performance that manifests itself on certain synthetic based tests like ATTO, CDM, and Anvil's. More importantly though: FOB testing will not show you that the Q series Pro is one of the fastest SSD's ever made. If you just FOB test, you would think the Q series Pro is just an average, or below average SSD; you wouldn't even know what you had in your hand.
We try our best to mimic a consumer implementation by testing our drive/array as our OS volume, or "C" drive, and filling the drive/array to 75% of its capacity with random 4K data. As we work our way through today's review, we will be able to show you firsthand why testing a drive with data on it is so important. The Q Series Pro has even managed to contradict some of our own preconceived notions about an SSD's performance indicators.
Our Latest RAID Article Coverage
Specifications, Pricing and Availability
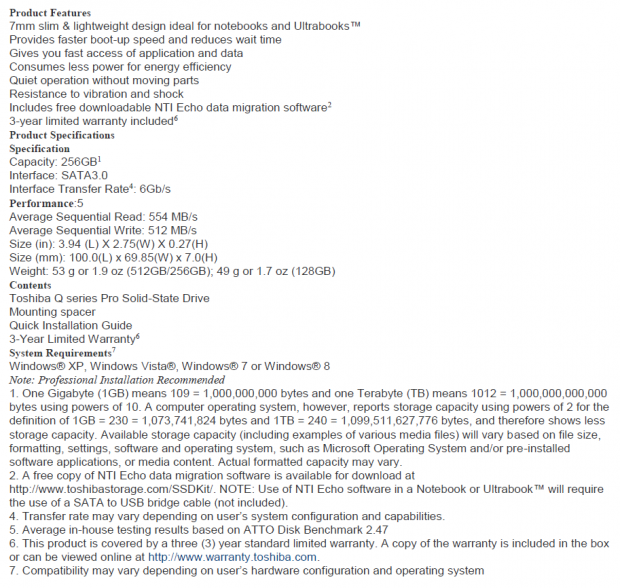
Toshiba's Q Series Pro 256GB SATA III SSD is available in three capacity sizes, 128GB, 256GB, and 512GB. Specifications list the 256GB Q Series Pro SSD as capable of 554MB/s sequential reads, and 512MB/s sequential writes. Random read/write speed is not listed.
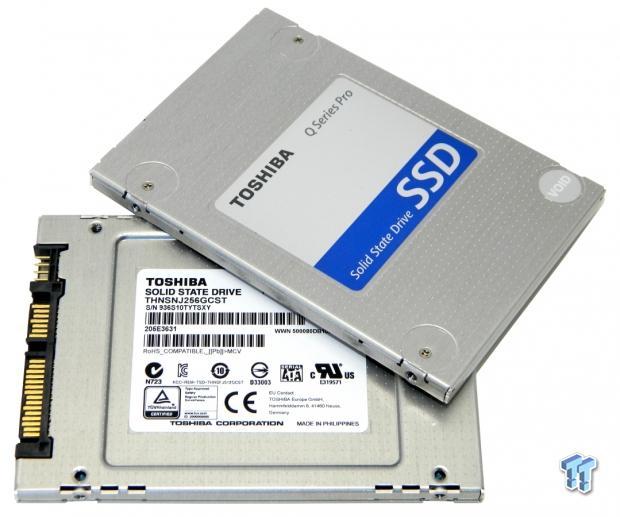
The Toshiba Q Series Pro is available in a 2.5" x 7mm z-height form factor, and ships with a spacer, should you need to increase the drive's thickness to 9.3mm.
The 256GB Toshiba Q Series Pro that we're looking at today retails at Amazon for $167, or 65.2 cents per GB. Toshiba backs the Q Series Pro with an industry standard three-year warranty.
Toshiba Q Series Pro 256GB SSD
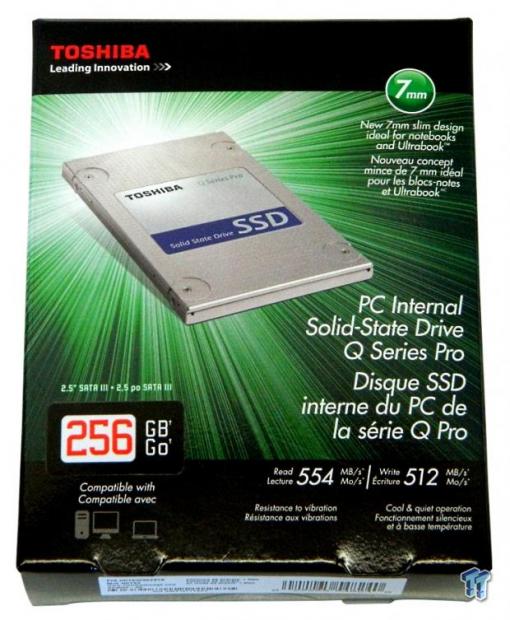
Toshiba's Q Series Pro comes packaged in an attractive box colored black, green, and white. There is a picture of the drive on the front of the box. The front of the box states the drive's capacity, its SATA III interface, and that the drive is a slim 7mm in thickness. Sequential read/write speed is listed as well.
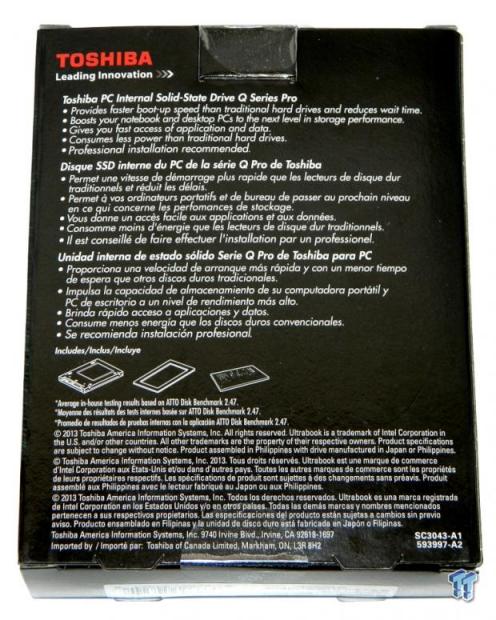
The rear of the box lists some attributes of Solid State Drives.
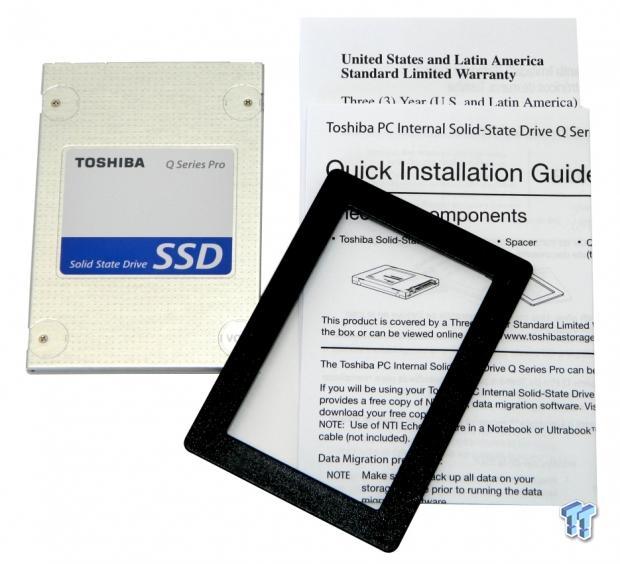
The Q Series Pro ships with a warranty guide, a quick installation guide that tells you how to download the Included NTI Echo cloning software, and a plastic spacer that can be used to increase the drive's thickness, should you need to do so.
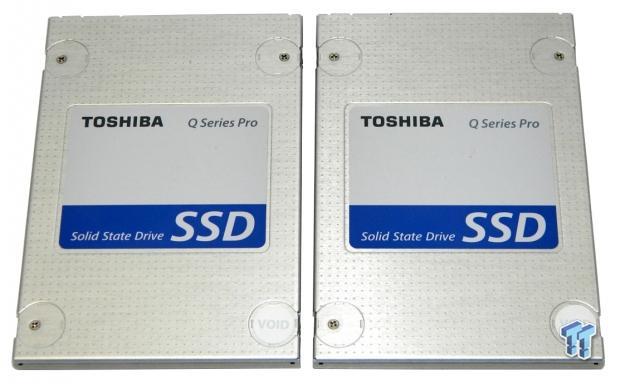
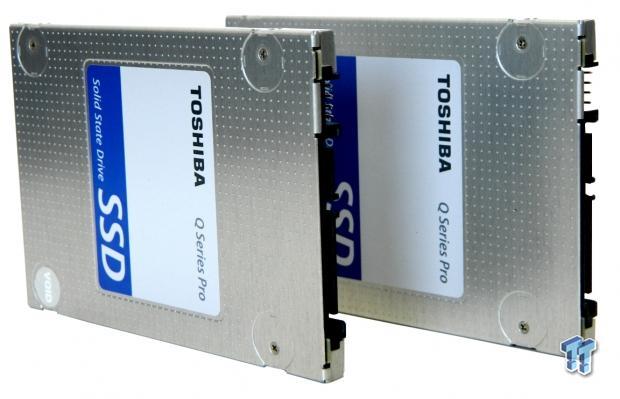
The top of the drive's enclosure is formed from a single piece of stamped aluminum, that's natural in color. There is a blue and white sticker centered on the front of the drive.
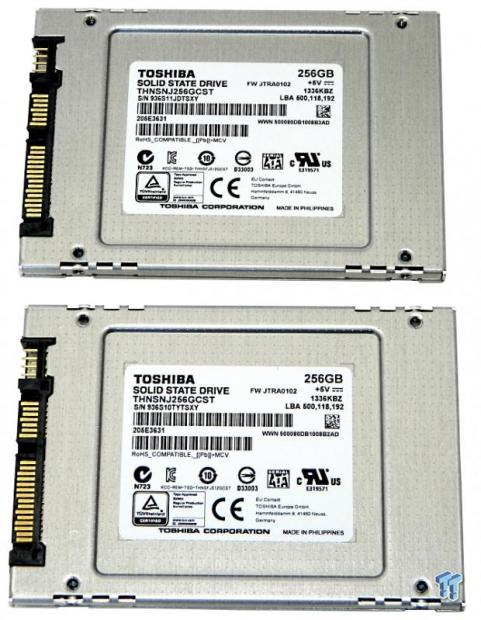
The bottom and sides of the enclosure are made from another piece of naturally colored, stamped aluminum. There is a sticker that lists the drive's part number, serial number, capacity, and shipping firmware revision.
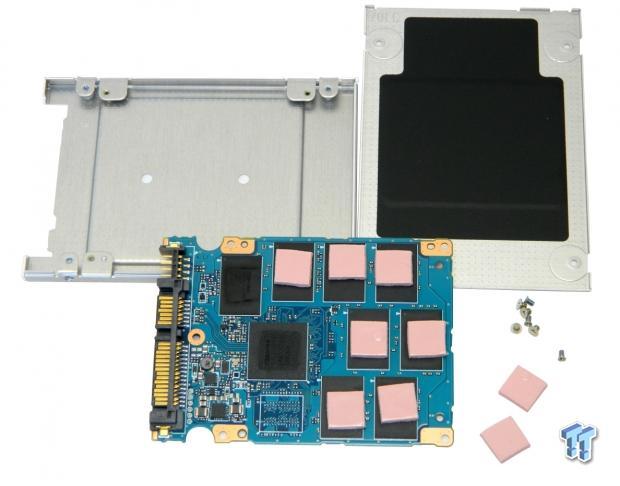
Here's what Toshiba's Q Series Pro 256GB SSD looks like completely disassembled. The drive's controller and BGA NAND packages all have thick thermal pads stuck to them. These thermally conductive pads wick heat from the chips, and into the drive's aluminum enclosure. We removed a couple of the thermal pads to get a better look at the NAND packages, and the controller. There are eight Toshiba branded 32GB 19nm MLC Toggle Mode BGA NAND packages on this side of the PCB. The drive's controller is Toshiba branded, and there is no DRAM buffer.
Benchmarks - Test System Setup, Drive Properties & ATTO Baseline Performance
Desktop Test System
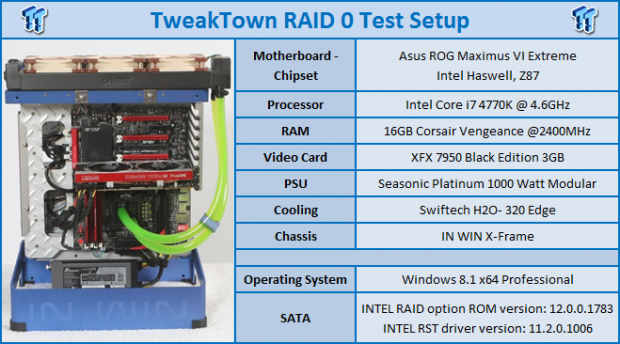
Drive Properties
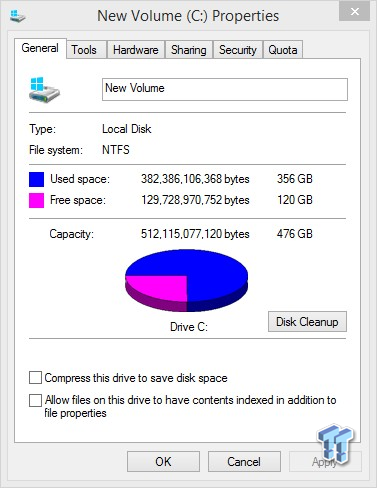
The majority of our testing will be done with our test drive/array as our boot volume. Our boot volume is 75% full for all OS Disk "C" drive testing, in order to mimic a typical consumer OS volume implementation. We're using 64K stripes for all of our arrays. Write caching is enabled.
Our testing includes charting the performance of a single drive, as well as a RAID 0 array of our test subject/s. We are utilizing Windows 8.1 64 Bit OS for all of our testing.
ATTO Baseline Performance
Version and / or Patch Used: 2.47
ATTO is a timeless benchmark used to provide manufactures with data used for marketing storage products.
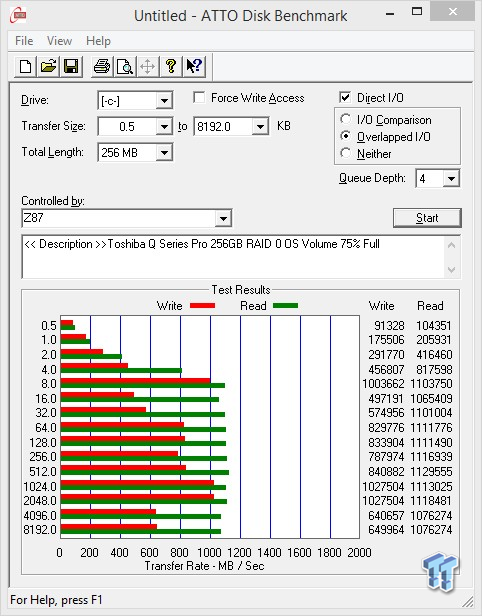
Read transfers are excellent. They ramp up quickly, and stay strong throughout. However, write transfers are a different matter. Both the lack of a DRAM buffer, and our array being filled to 75% of its capacity, conspire to deliver choppy performance.
Sequential Write
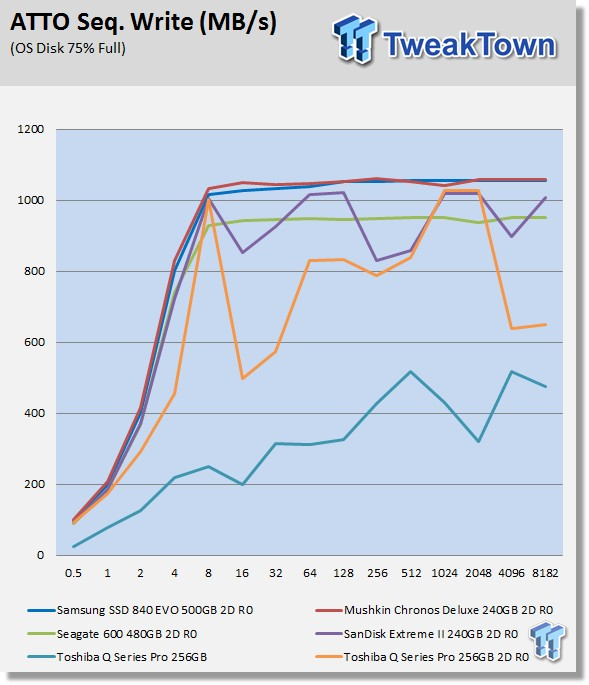
Whether it's a single drive, or an array, it doesn't matter; when our test subject is loaded up with data, the write performance is choppy. When empty (FOB) there is no choppy write performance. If you FOB test, you will never encounter this performance quirk. Normally, when we see choppy performance like this, we know that the test subject is going to be brutalized by our trace based and transfer testing.
Sequential Read
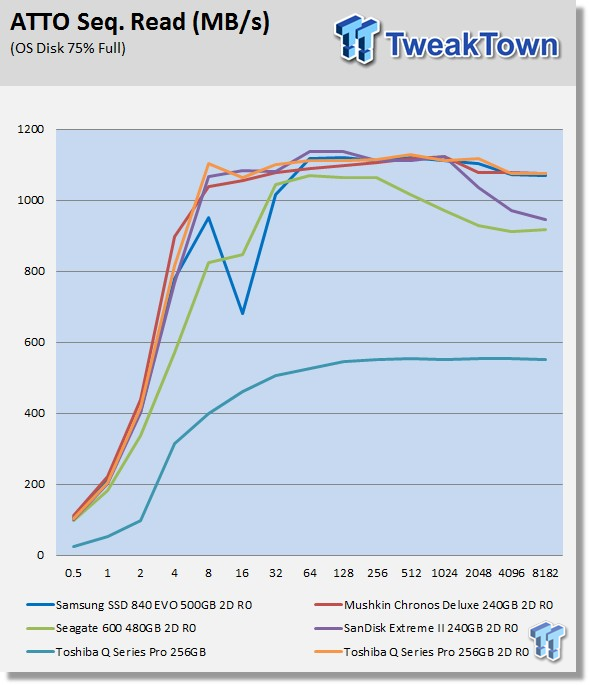
Read performance is as smooth as butter for both our single drive, and our array.
Benchmarks - Anvil Storage Utilities
Anvil Storage Utilities
Version and / or Patch Used: RC6
So, what is Anvil Storage Utilities? It is a storage benchmark for SSD's, and HDD's, where you can check and monitor your performance. The Standard Storage Benchmark performs a series of tests; you can run a full test, or just the read or the write test, or you can run a single test (i.e. 4K QD16).
The software is used several different ways, and to show different aspects for each drive. We've chosen to use this software to show the performance of a drive with two different data sets. The first is with compressible data, and the second data set is incompressible data. Several users have requested this data in our SSD reviews.
0-Fill Compressible Data
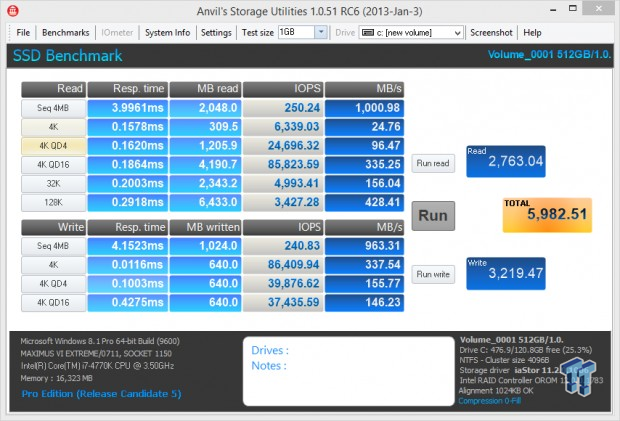
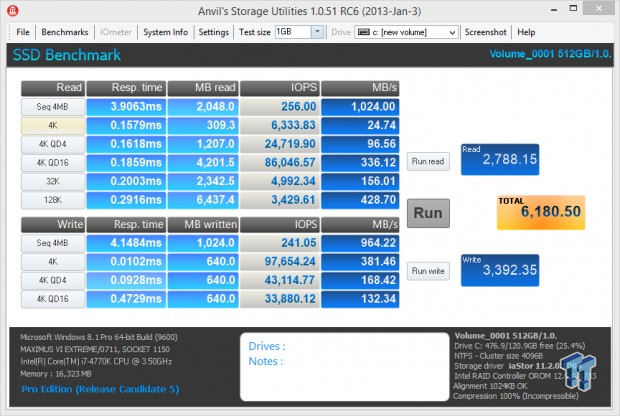
This is actually the worst score I can remember for a 2 drive SATA III SSD array. However, upon further examination, we can see that most of what is bringing down the score total is coming from the bottom two write categories. So much of an Anvil's total score is predicated on these two categories, that when a drive/array does not pump out a lot of write IOPS at higher queue depths, the total score is drastically affected. We believe there are two factors in play here:
1) Toshiba has tuned the Q Series Pro for write performance at low QD
2) The lack of a DRAM buffer is drastically affecting synthetic based write performance.
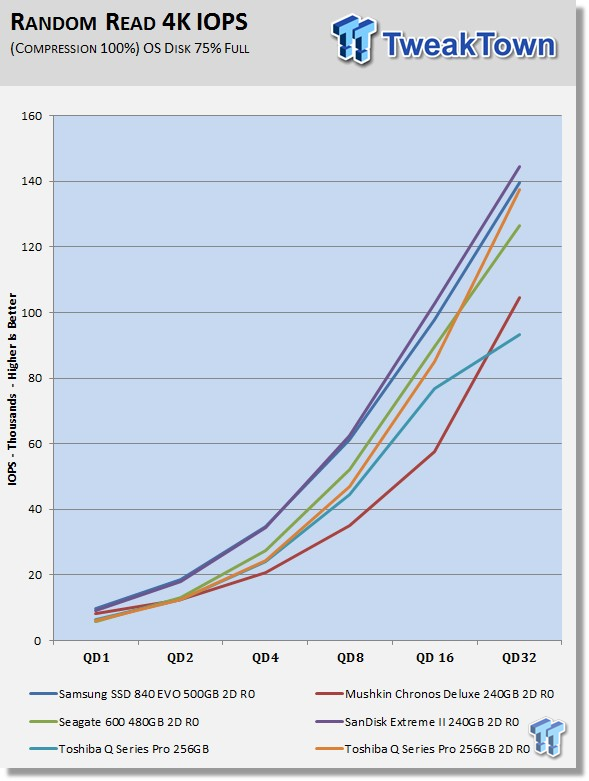
0-Fill Compressible Read IOPS through Queue Depth Scale
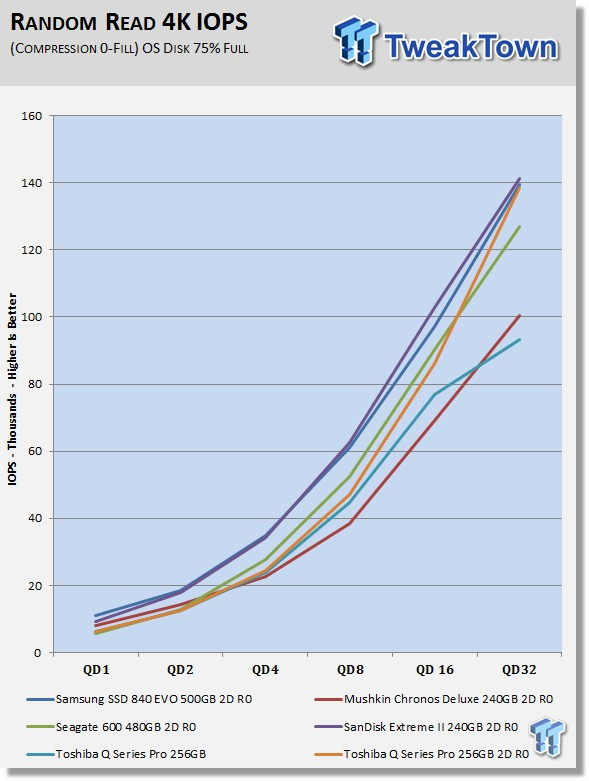
Compressible 4K read performance at QD 1 - QD 2 is lower than what we typically see from a hyper-class SSD, but as queue depth stacks up, the Q Series Pro finishes strong.
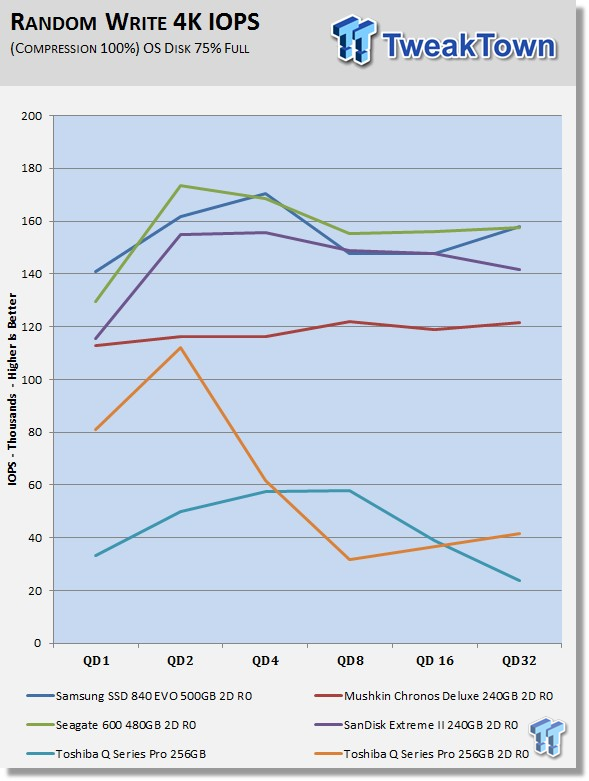
0-Fill Compressible Write IOPS through Queue Depth Scale
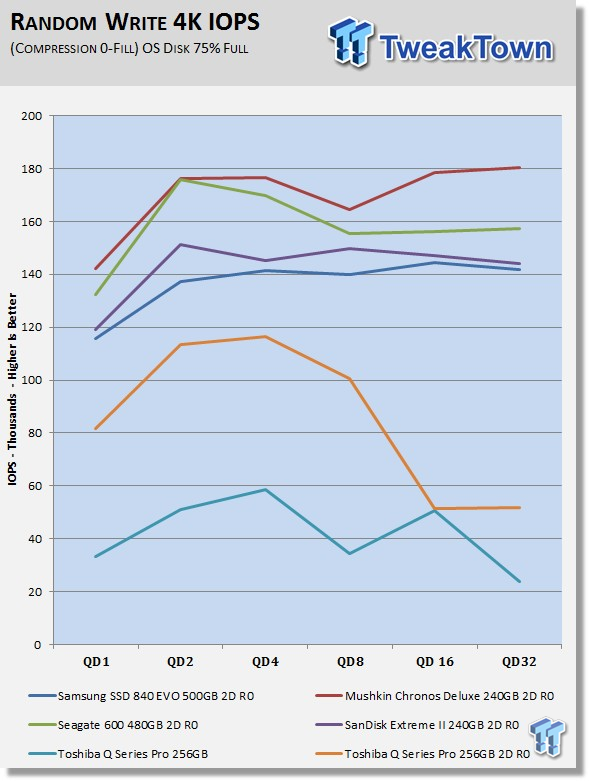
The Q series Pro starts off lower than the rest of the arrays on our chart, and drops off of a cliff at 4K QD4. But remember: this is synthetic testing.
Compression 100% Incompressible Data
Incompressible scoring is pretty much the same as compressible scoring.
Incompressible Read IOPS through Queue Depth Scale
Read IOPS charting of incompressible data mirrors that of compressible.
Incompressible Write IOPS through Queue Scale
The variation we're seeing here is more a product of an inconsistent synthetic based performance curve due to the lack of a DRAM buffer, than a change in data types. Normally when we see this, it does not bode well for our test subject when we move to the testing that matters.
Benchmarks - CrystalDiskMark
CrystalDiskMark
Version and / or Patch Used: 3.0 Technical Preview
Developer Homepage: http://crystalmark.info
Product Homepage: http://crystalmark.info/software/CrystalDiskMark/index-e.html
Download here: http://crystaldew.info/category/software/crystaldiskmark
CrystalDiskMark is disk benchmark software that allows us to benchmark 4K, and 4K queue depths with accuracy.
Note: Crystal Disk Mark 3.0 Technical Preview was used for these tests, since it offers the ability to measure native command queuing at 4 and 32.
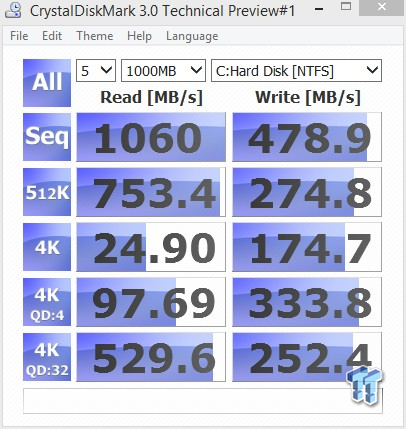
Read performance looks good across the board; exceptional in fact, both sequentially, and at 4K QD 32. Write performance looks more like a single drive than an array, and is the worst that I can remember seeing. Keep in mind that this odd write performance will not manifest itself when you test in a FOB state.
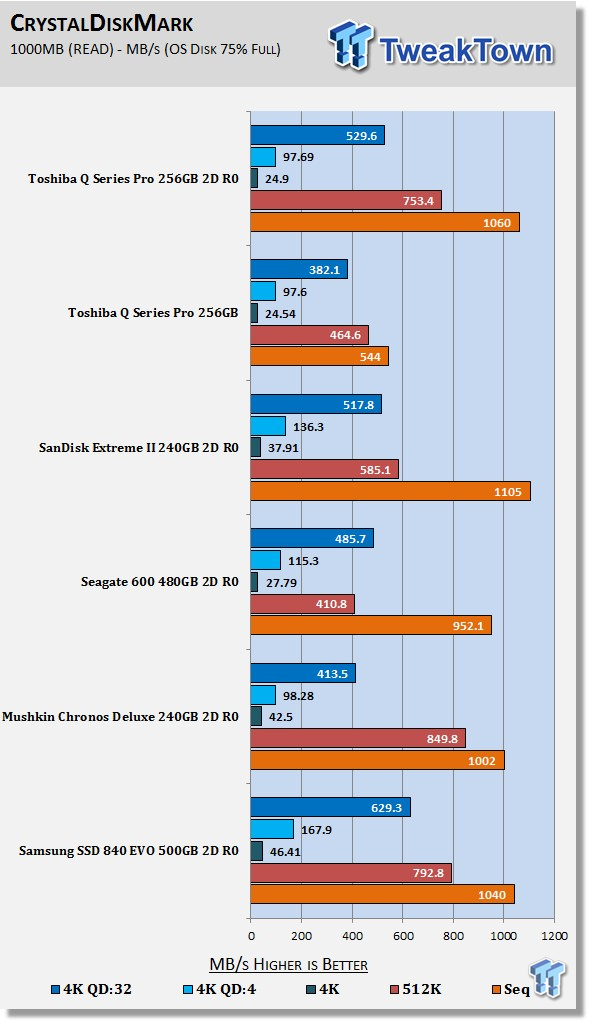
As we've seen so far, read performance is very good; although, 4K QD 1 performance is one of the lowest we've seen.
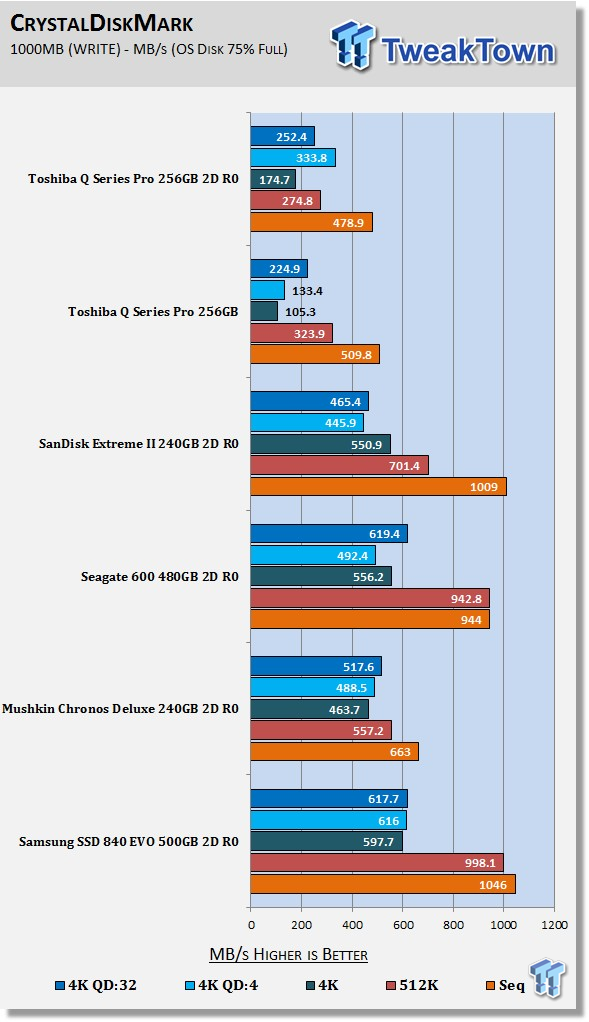
Our array's performance looks more like a single drive's performance on this chart. Earlier, I stated that the Q Series Pro has managed to contradict some of our own preconceived notions about an SSD's synthetic performance indicators, and that's what we're going to see from this point forward. Up to this point, our drive/array's write performance has looked very odd to say the least. Based on what we've seen so far (and my own preconceived notions of performance indicators), I would think the Q Series Pro is going to be destroyed by the remaining tests; the tests that matter.
Benchmarks - AS SSD
AS SSD
Version and / or Patch Used: 1.7.4739.38088
Product Homepage: http://alex-is.de/PHP/fusion/news.php
Download here: http://alex-is.de/PHP/fusion/downloads.php
AS SSD determines the performance of Solid State Drives (SSD). The tool contains four synthetic, as well as three practice tests. The synthetic tests are used to determine the sequential and random read and write performance of the SSD. These tests are carried out without the use of the operating system caches.
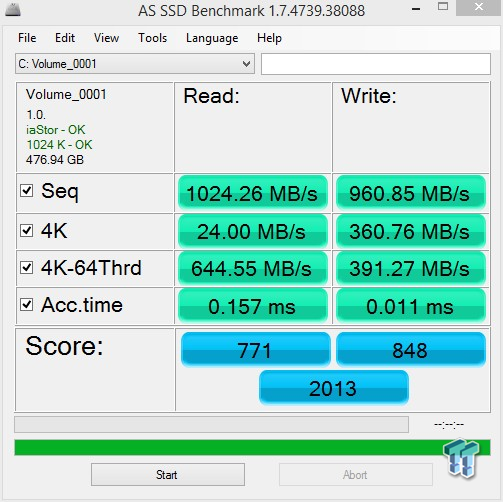
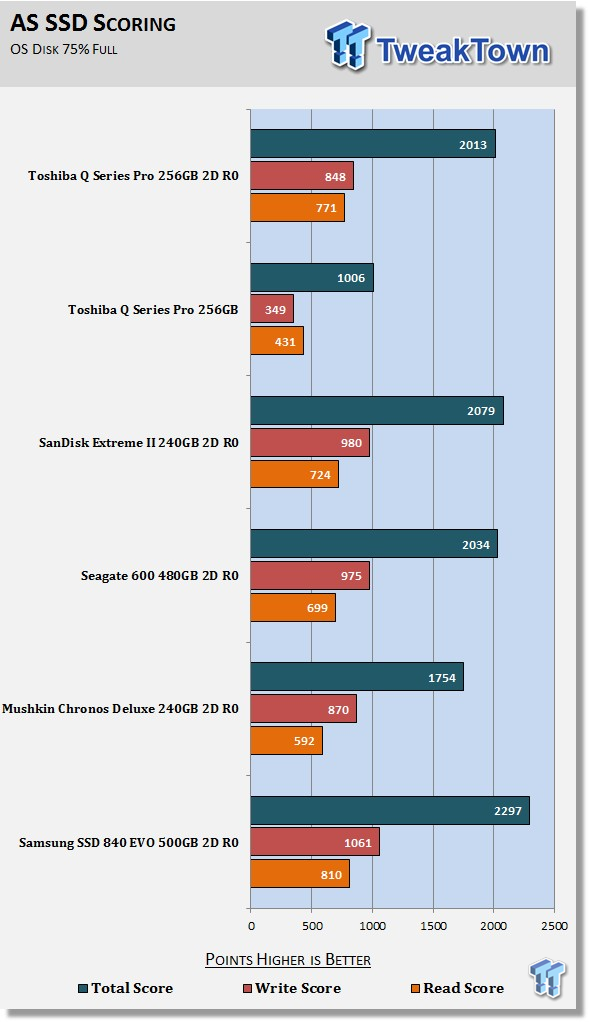
This is the only synthetic test that did not exhibit odd write performance. AS SSD displayed very good performance with both a single drive, and an array. The read score is second best on our chart.
Benchmarks - PCMark Vantage
PCMark Vantage - Hard Disk Tests
Version and / or Patch Used: 1.2.0.0
Developer Homepage: http://www.futuremark.com
Product Homepage: http://www.futuremark.com/products/pcmarkvantage
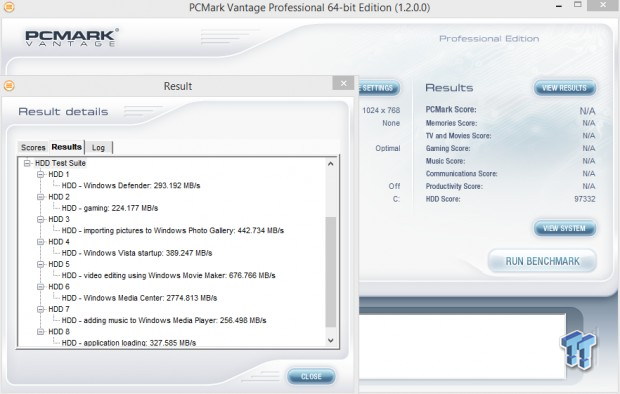
PCMark Vantage is the first objective hardware performance benchmark for PCs running 32, and 64 bit versions of Microsoft Windows Vista. PCMark Vantage is perfectly suited for benchmarking any type of Microsoft Windows Vista PC, from multimedia home entertainment systems and laptops, to dedicated workstations and high-end gaming rigs. Regardless of whether the benchmarker is an artist, or an IT Professional, PCMark Vantage shows the user where their system soars, or falls flat, and how to get the most performance possible out of their hardware. PCMark Vantage is easy enough for even the most casual enthusiast to use, yet supports in-depth, professional industry grade testing.
The reason we like PCMark Vantage, is because the recorded traces are played back without system stops. What we see is the raw performance of the drive. This allows us to see a marked difference between scoring that other trace based benchmarks do not exhibit. An example of a marked difference in scoring on the same drive would be empty vs. filled vs. steady state.
We run Vantage in three ways. The first run is with the OS drive/Array 75% full, to simulate a lightly used OS volume filled with data to an amount that we feel is common for most users. The second run is with the OS volume written into a "Steady State," utilizing SNIA's guidelines (Rev 1.1). Steady state testing simulates a drive/array's performance similar to that of a drive/array that has been subjected to consumer workloads for extensive amounts of time. The third run is a Vantage HDD test, with the test drive/array attached as an empty, lightly used, secondary device.
OS Volume 75% full - Lightly Used

OS Volume 75% full - Steady State
Secondary Volume Empty - Lightly Used

As you can see, there's a big difference between an empty drive/array, one that's 75% full/used, and one that's in a steady state.
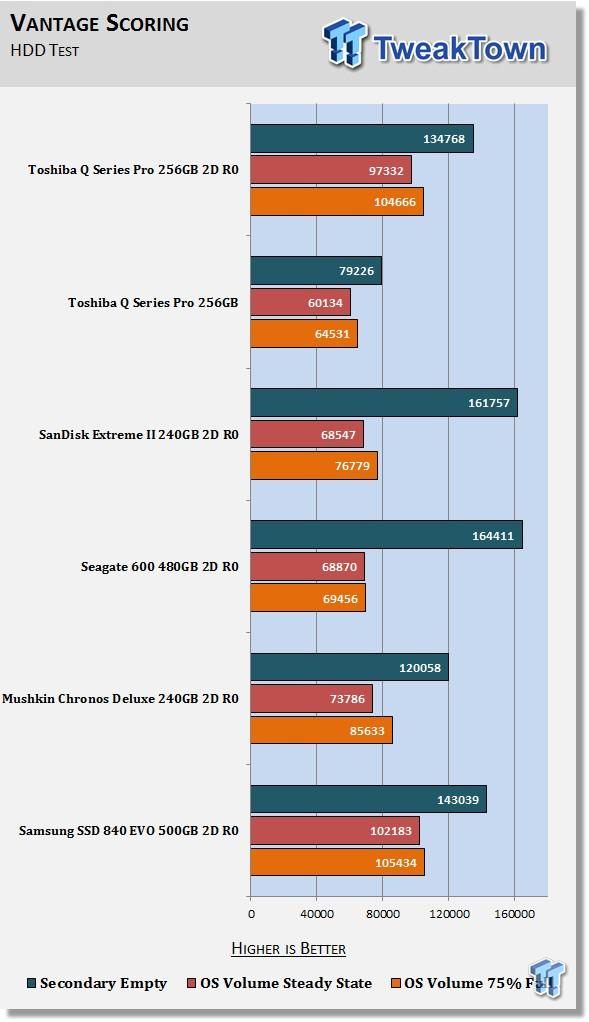
The important scores to pay attention to are "OS Volume Steady State," and "OS Volume 75% full". These two categories are most important, because they are indicative of typical consumer based user states.
When a drive/array is in a steady state, it means garbage collection is running at the same time it's reading/writing. There's a huge difference in performance between a single drive, and a two drive array. I was expecting to see the Q Series Pro get crushed by these tests. Instead, the Q Series Pro crushed these tests. Until now, nothing has even come close to our EVO array. This is what matters: performance while running consumer based OS workloads in a steady state. This is where we're beginning to see the true character of Toshiba's Q Series Pro.
Benchmarks - PCMark 7
PCMark 7 - System Storage
Version and / or Patch Used: 1.4.00
Developer Homepage: http://www.futuremark.com
Product Homepage: http://www.futuremark.com/benchmarks/pcmark7
PCMark 7 includes seven PC tests for Windows 7 & 8; combining more than 25 individual workloads covering storage, computation, image and video manipulation, web browsing, and gaming. Specifically designed to cover the full range of PC hardware from netbooks and tablets, to notebooks and desktops, PCMark 7 offers complete PC performance testing for Windows 7 & 8 for home, and business use.
We will look to the RAW system storage scoring for RAID 0 evaluations, because it's done without system stops, and therefore allows us to see significant scoring differences between drives/arrays.
OS Volume 75% full - Lightly Used
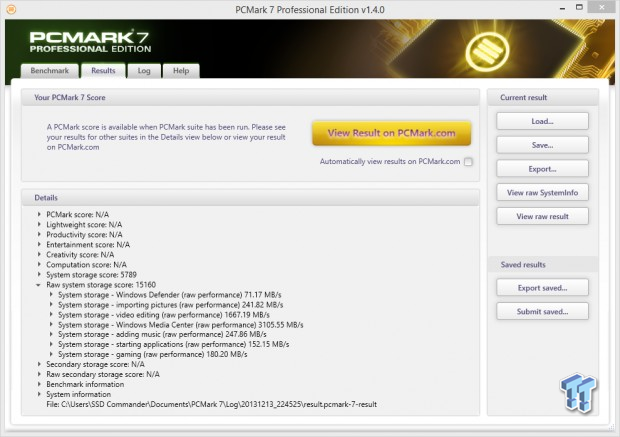
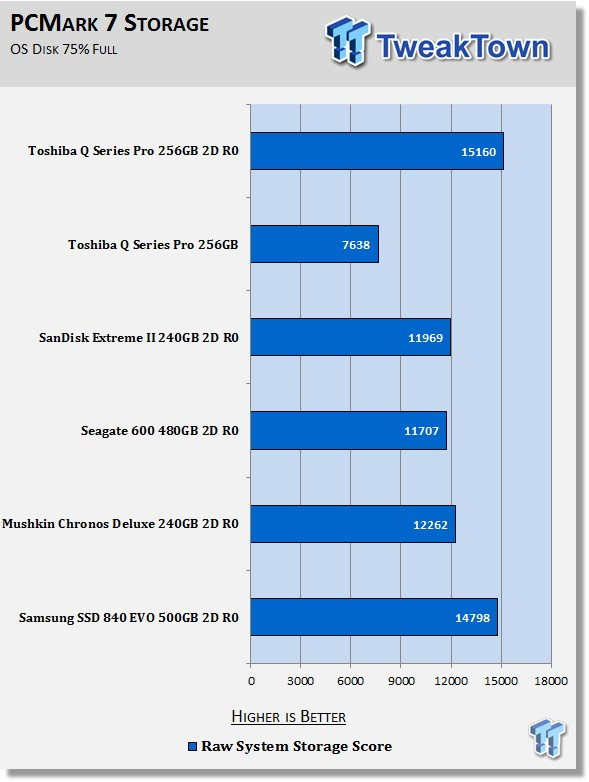
Now that the Q Series Pro is catching our attention, it's time for it to leave the competition in the dust. Our Q Series Pro array delivers a roundhouse to our EVO array, and smashes the competition with a 15,000 point plus performance.
Benchmarks - PCMark 8
PCMark 8 - Storage Bandwidth
Version and / or Patch Used: 1.2.157
Developer Homepage: http://www.futuremark.com
Product Homepage: http://www.futuremark.com/benchmarks/pcmark8
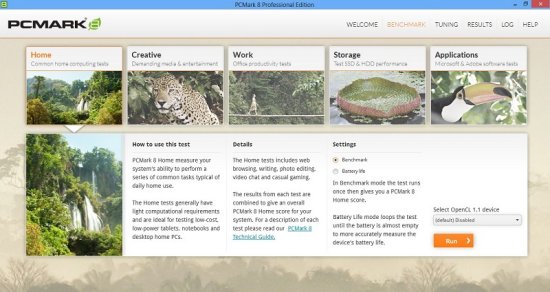
PCMark 8 is FutureMark's latest version of their popular series of PC benchmarking tools. PCMark 8 improves on previous releases by including battery life measurement tools, and new tests using popular applications from Adobe and Microsoft. Whether you are looking for long battery life, or maximum power, PCMark 8 helps you find the devices that offer the perfect combination of efficiency, and performance for your needs.
Use the PCMark 8 Storage benchmark to test the performance of SSDs, HDDs, and hybrid drives, with traces recorded from Adobe Creative Suite, Microsoft Office, and a selection of popular games. You can test the system drive, or any other recognized storage device, including local external drives. Unlike synthetic storage tests, the PCMark 8 Storage benchmark highlights real-world performance differences between storage devices.
PCMark 8's Storage Performance Benchmark is an absolute beast of a test. The benchmark beats the hell out of your drive/array for well over an hour, resulting in a very thorough evaluation of a drive/array's real-world performance.
OS Volume 75% full - Lightly Used
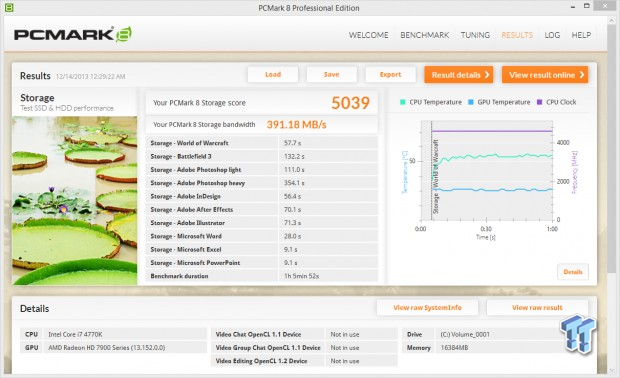
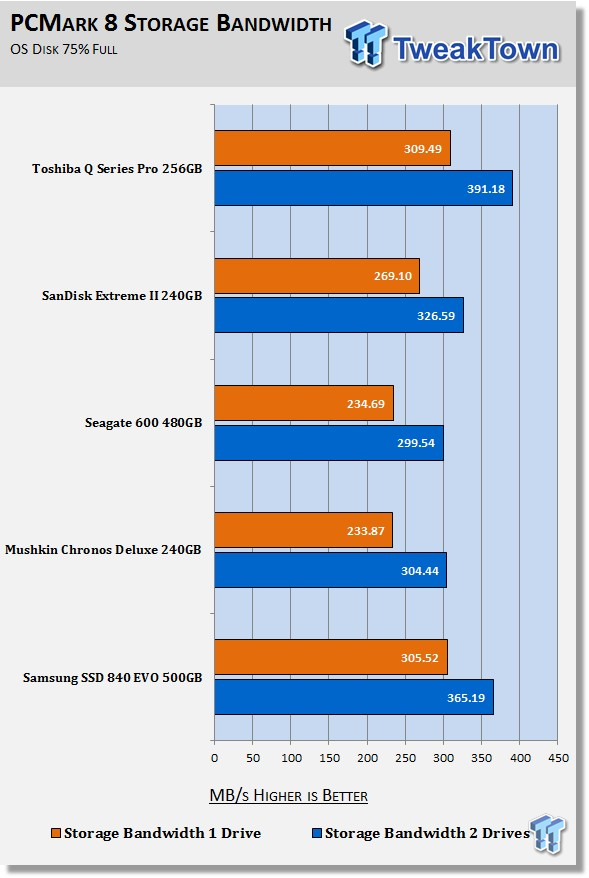
By dominating this test, the Q Series Pro again shows the EVO who's the boss. This is a VERY demanding test, and it's one of the best indicators of a drive/array's real-world performance capabilities.
Secondary Volume Benchmarks - Blackmagicdesign's Disk Speed Test
Disk Speed Test
Version and / or Patch Used: 2.1.1
Product Homepage: http://www.blackmagicdesign.com
Disk Speed Test is an easy to use tool to quickly measure and certify your disk performance for working with high quality video! Simply click the start button, and Disk Speed Test will write test your disk using large blocks of data, and then display the result. Disk Speed Test will continue to test writes and reads from your disk, so you can evaluate both performance, and readability, over time.
We rate a drive/array's video capabilities by the number of different categories that the device is capable of passing. The maximum number of tests that are possible to pass are 45 write tests, and 45 read tests. We chart the number of tests a disk/array is capable of passing, for a comparison of one drive/array verses another.
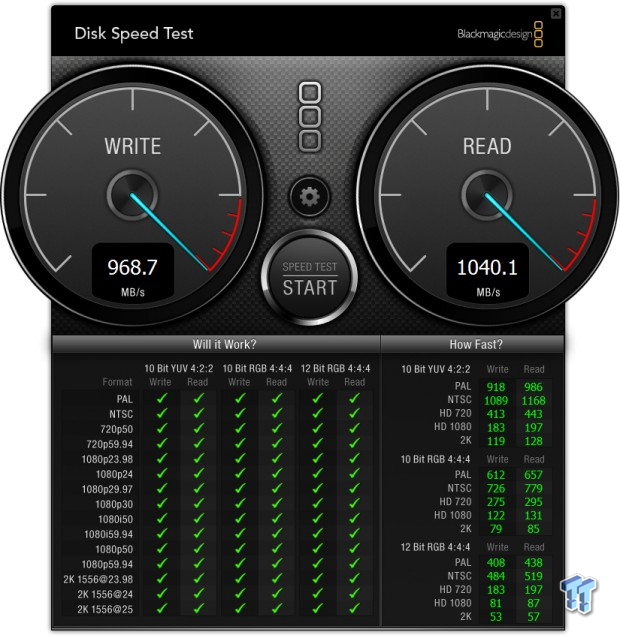
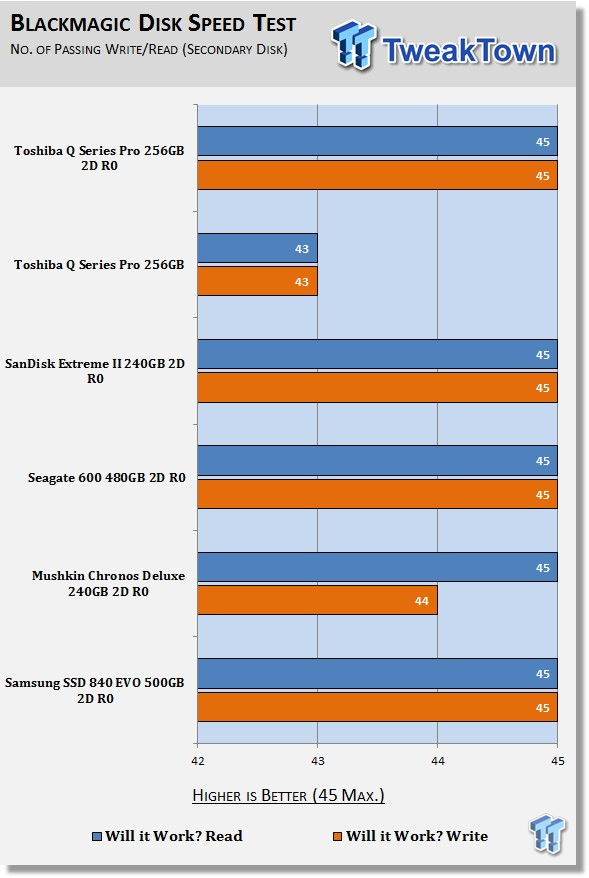
It's very hard for a single drive to be completely HD video capable. This is why serious video processing is done almost exclusively utilizing RAID arrays. Sequential incompressible performance is the name of the game when it comes to video processing. No surprises here: Our two drive Q Series Pro array is completely HD video capable.
Secondary Volume Benchmarks - Disk Response Times
Iometer
Version and / or Patch Used: 1.1.0
Product Homepage: http://www.iometer.org
Download here: http://sourceforge.net/projects/iometer
Iometer is an I/O subsystem measurement, and characterization tool, for single and clustered systems. It was originally developed by the Intel Corporation, and announced at the Intel Developers Forum (IDF) on February 17, 1998. Since then, it's become widespread within the storage industry.
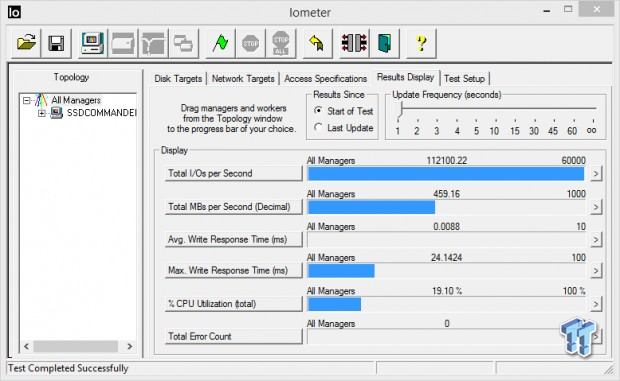
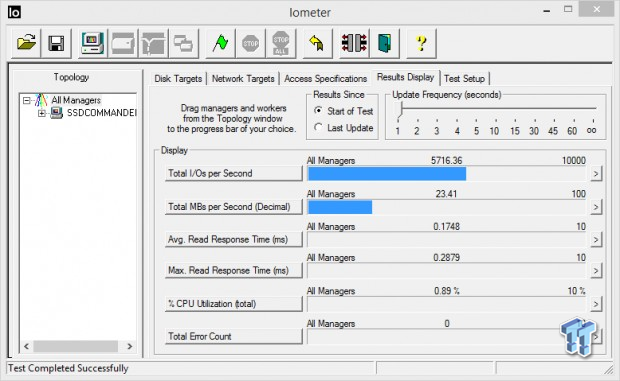
We use Iometer to measure disk response times. Disk response times are measured at an industry accepted standard of 4K QD1 for both write, and read. Each test is run twice, for 30 seconds consecutively, with a five second ramp-up before each test. The drive/array is partitioned, and attached as a secondary device for this testing.
Write Response
Read Response
Average Disk Response
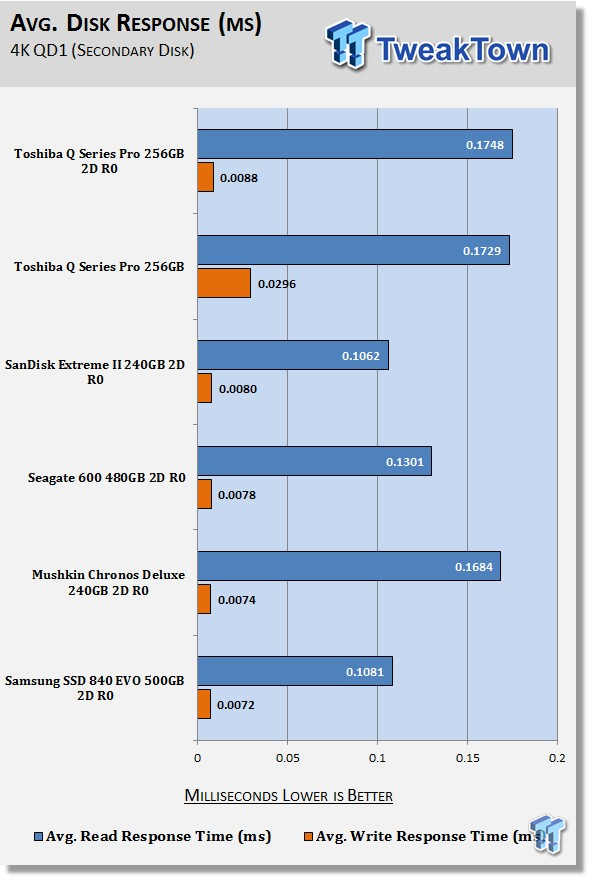
Write response times benefit most from RAID 0 because of write caching. There is a slight latency increase in read response times for an array vs. a single drive. Lack of a DRAM buffer shows itself in this round of testing. Response times, while still good, are slower than the rest of the arrays on our chart.
Secondary Volume Benchmarks - DiskBench
DiskBench - Directory Copy
Version and / or Patch Used: 2.6.2.0
Developer Homepage: Nodesoft
Product Homepage: DiskBench
Download here: http://www.nodesoft.com/diskbench/download
We use DiskBench to time a 28.6GB block (9,882 files in 1,247 folders) of mostly incompressible random data, as it's transferred from our OS array, to our test drive/array. We then read from a 6GB zip file that's part of our 28.6GB data block, in order to determine the test drive/array's read transfer rate. The system is restarted prior to the read test to clear any cached data; insuring an accurate test result.
Write Transfer Rate
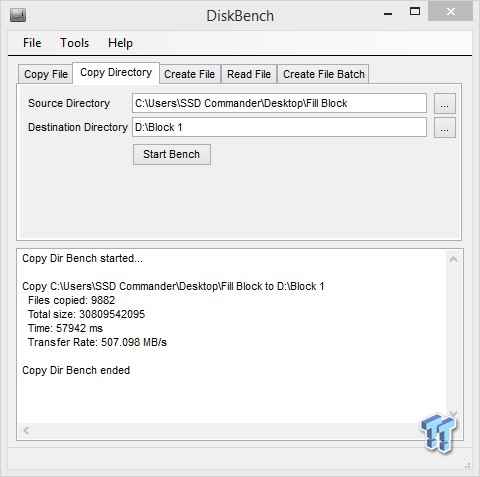
A 507 MB/s write transfer rate is the second best we've seen to date. Seagate's 600 series managed a 2MB/s faster transfer rate, but that array has twice the capacity of our Q Series Pro array, which does in fact give it a slight advantage over the Q Series Pro array. A similar capacity 600 series array churns out 493 MB/s in this test.
Read Transfer Rate
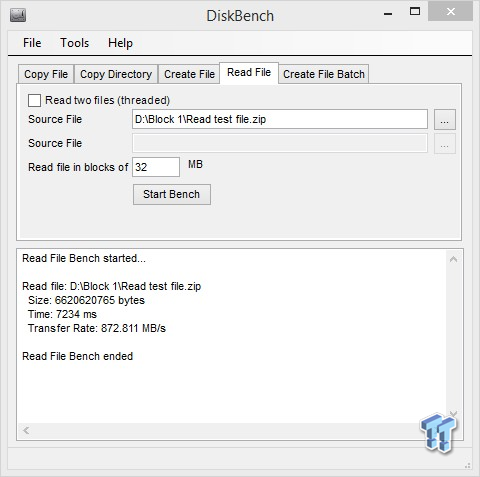
An 873 MB/s read transfer rate is again the second best we've seen to date. This time, our Chronos array manages to win by a mere 6MB/s.
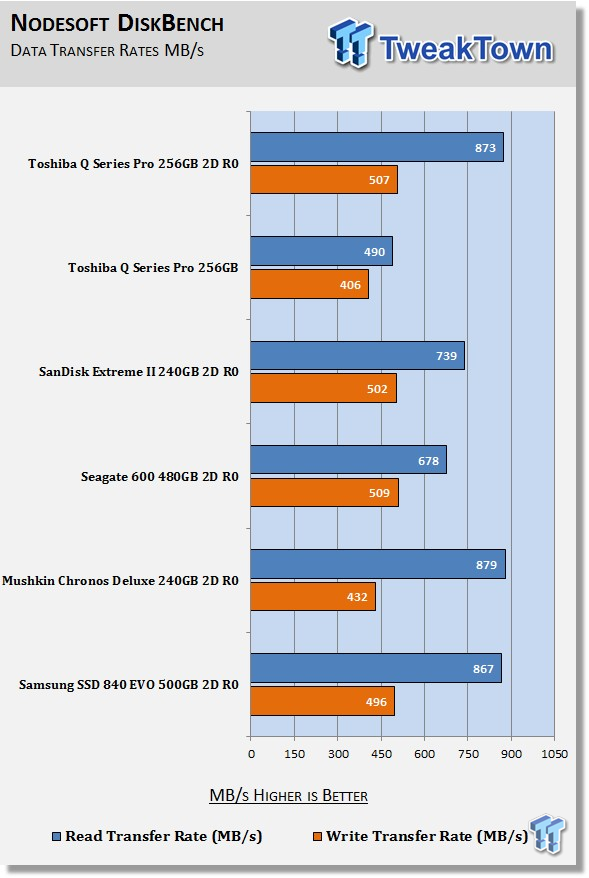
Our data transfer test is definitely where the rubber meets the road. We're transferring a huge chunk of random incompressible data. This is where everything we've seen so far comes together with actual data. There is no way for a drive manufacturer to "optimize" for this test. This test is an absolute validator of our trace based testing. Our Q Series Pro array does have the best all-around performance transfer rates we've achieved to date, and takes the performance crown from our Samsung EVO array.
Final Thoughts
Solid state storage is the most important performance component found in a modern system today. Without it, you do not even have a performance system.
Being one of the largest flash memory manufacturers on the planet gives Toshiba several advantages that lead to an awesome product like the Q Series Pro. Toshiba can have their pick of the very best flash they make, and it doesn't cost them a dime more than initial production cost for that advantage. The very nature of flash means that some of the flash they produce will be much, much faster than the rest. We're just speculating here, and we have no data to prove this, but we think that Toshiba has indeed utilized binned flash that's so good that they really don't need a DRAM buffer to enhance the performance of the Q Series Pro.
Toshiba is one of the world's largest companies, and as such, they have the resources necessary to write their own specialized firmware. Toshiba's firmware engineers created specialized firmware for the Q Series Pro that's their own exclusive IP. We believe, and again we are only speculating here, that the controller utilized on the Q Series Pro is more than likely Marvell silicon. The thing about utilizing Marvell silicon is that Marvell provides the chip, but not the firmware. Whatever the actual facts of the matter are, Toshiba is keeping that knowledge under wraps.
Today, we learned that you can't judge a book by its cover, and if you win the race, it doesn't matter that you started last. Like I said, if you just FOB test, and don't throw data into the mix, then you wouldn't know that the Q Series Pro comes into its own when its loaded up with data, and written into a steady state. You would just think you had an average SSD; when in reality, it is actually one of the fastest SSD's ever made. We also learned that some of our preconceived notions about synthetic performance indicators (like high 4K QD 1 read/write performance) can't always predict a drive's real-world performance potential.
Toshiba's Q Series Pro is a bona fide Hyper-Class SSD, and if that wasn't enough, it's also one of the most cost-effective solid state solutions on the market. For the moment, Toshiba's Q Series Pro is our performance champion, despite its choppy write performance in our synthetic benchmarks. Hopefully we can get some other capacities in the lab soon for some more RAID goodness.
RAIDing two or more drives together provides you with storage that takes performance to the next level, and is something I recommend you try. Once you go RAID, there's no going back.
 Phison E37T SSD Controller Exclusive Preview - The Fastest DRAMless SSD Platform Yet
 Seagate FireCuda X1070 4TB SSD Review - A New Mainstream Contender
 ASUSTOR Lockerstor 2 Gen2+ AS6702T v2 NAS Review - Fast Performance
 TERRAMASTER D1 SSD Pro Thunderbolt/USB Portable Enclosure Review - Incredible Potential
 Orico K20 Mini 2TB Magnetic Portable SSD Review - Ultra-Thin MagSafe Drive
 The new Tomb Raider: Legacy of Atlantis has an AI disclaimer on its Steam page
 Xbox clarifies exclusive game strategy, confirms multi-platform live services
 GIGABYTE claims a DDR5 world record for hitting 13556 MT/s at Computex 2026
 Xbox confirms second console exclusive at summer gaming showcase
 Halo Campaign Evolved has guns from all Halo games, coming July 28 with three prequel missions
 Indie dev's new game coming to 40-year-old SEGA console
 Terror returns in Alien Isolation 2 with new atmospheric footage
 Xbox possibly selects first platform exclusive under new CEO Asha Sharma
 New mind-bending Star Trek game coming from renowned horror developer
 Asetek Forte S-Series Racing Simulator Bundle Review
 Razer Pro Type Ergo Wireless Split Ergonomic Keyboard Review - Built for Comfort and Support
 ASUS ROG Strix Morph 96 Wireless Gaming Keyboard Review - Great Performance, More Affordable
 SAPPHIRE Radeon RX 9070 GRE PULSE OC Review - A New 1440p Challenger Has Arrived
 NZXT H6 RGB+ Compact Dual-Chamber Chassis Review
 ASRock Radeon RX 9070 GRE Steel Legend Review - The RDNA 4 Mid-Range Reshuffle
 ASRock Z890 Taichi Aqua Motherboard Review - Flagship features without the flagship price
 GIGABYTE Z890I AORUS Ultra Motherboard Review - Mini-ITX with surprisingly good thermals
 Lian Li HYDROSHIFT II 360P OLED Curved Liquid CPU Cooler Review
 The PowerToys utilities I keep enabled on every Windows 11 PC, and the ones I turned off within a week
 TweakTown's Best of Computex 2026 Awards - The Best Hardware, Gaming Gear, and AI
 USB Ports Not Working in Windows 11? Try These Fixes
 ASUS WiFi Routers and Networking Solutions Deliver Long-term Security and Reliability with No Additional Cost
 Second Monitor Not Detected in Windows 11? Try These Fixes
 Turn Your Old Smartphone Into a Dedicated Webcam for Your Windows PC
 The Send To menu is the right-click feature on Windows 11 that nobody bothers to customize
 Windows 11 will not let you pin a folder to the taskbar, but a 30-second workaround does
 ASUS ProArt Displays Unlock Creativity with Professional Monitors for Everyone