


Our Verdict
Introduction, Drive Specifications, Pricing and Availability
Patriot is first to launch a Phison S10 powered M.2 SSD. The new Ignite M2 drive is SATA based allowing the Ignite broader compatibility with current motherboards. There is not a lot of real estate on a 22mm x 80mm M.2 "gum stick" SSD which dictates the use of fewer and denser flash packages. Fewer flash packages translates to a reduction in parallelism (interleaving) which may translate to reduced write performance in comparison to a 2.5" form factor SSD. This is the case with Patriot's Ignite M2 drive. Patriot's 2.5" Ignite 480GB SSD with its more populous flash array, offers sequential write speeds of up to 545 MB/s and the M.2 version in the same capacity offers sequential write speeds of up to 320 MB/s; a 225 MB/s reduction in sequential write speed at the same capacity point.
Patriot's Ignite series SSD's are all about delivering enthusiast level performance at the lowest possible cost. Following this credo, Patriot has chosen to implement low cost asynchronous flash on their Ignite series SSD's. It's been a while since we've seen async flash based SSD's. Async SSD's such as OCZ's Petrol, and a whole host of async SandForce driven drives, are well known for their dismal performance. However, as we've seen from Patriot's 2.5" Ignite, today's 16nm Micron MLC asynchronous flash is able to crank out excellent performance when paired with the right controller.
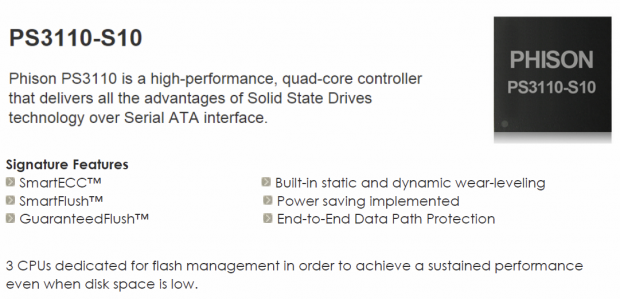
Patriot chose Phison's S10 flash controller to power their Ignite series SSD's. We are quickly becoming big fans of Phison's S10, because of its high sequential and random 4KB performance. This rather large quad-core 8-channel flash processor dedicates one core to host operations and three of its four cores to flash management. The S10 is loaded with features such as end-to-end data path protection (ETEP), AES 256-bit encryption support, static wear-leveling, dynamic wear-leveling and special BCH error correction technology. Most importantly, the S10 is capable of delivering enthusiast grade performance.
Patriot's new M.2 SSD looks like it has potential; let's see how well it performs.
Specifications
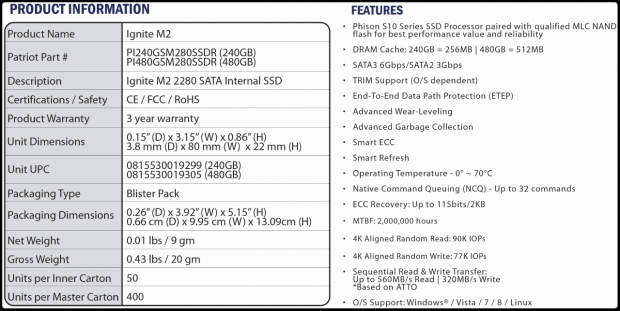
Patriot's Ignite M2 SATA III SSD is available in two capacities: 240GB, and 480GB. Sequential read performance for the Ignite M2 SSD is listed at up to 560MB/s. Sequential write performance is listed at up to 320 MB/s. The Ignite M2 is rated for up to 90/77K random 4K performance. As you will see, the M2 Ignite's rated random 4KB read performance is conservative. Curiously, there is no Total Bytes Written limit listed. We are not sure if there is any limit.
Drive Details, Test System Setup, and Properties
Drive Details - Patriot Ignite M2 480GB SATA III M.2 SSD
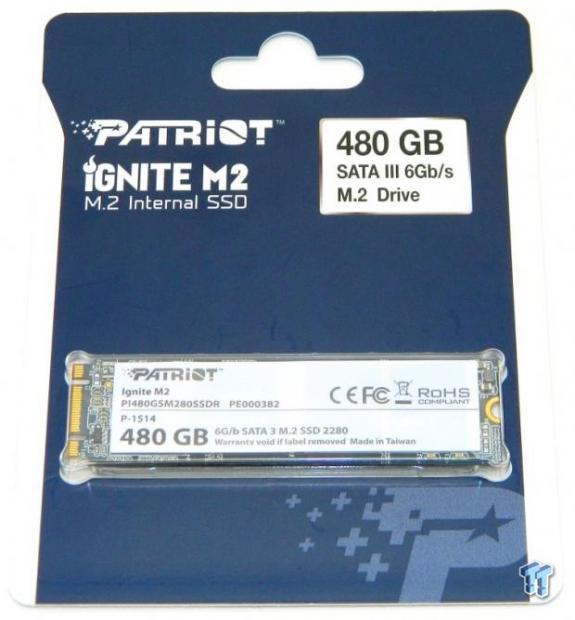
Patriot's Ignite M2 SSD is packaged in a card style blister pack. No screws are included.
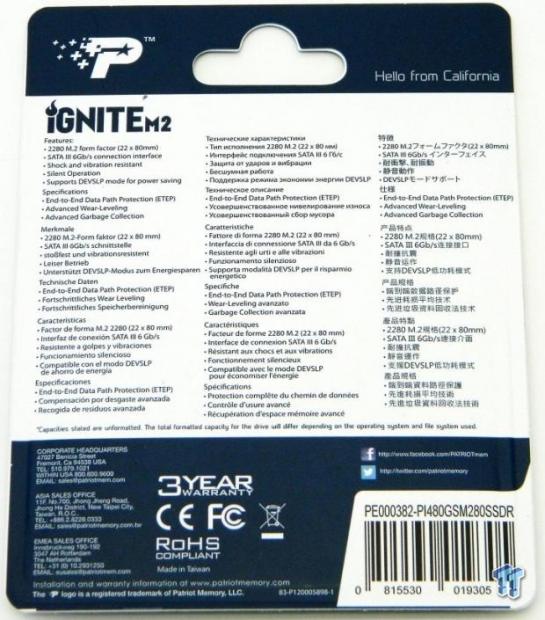
On the rear of the packaging, Patriot lists some of the drive's features and specifications. Also noted is the drives 3-year warranty.
Our Latest SSD Review Coverage
- Samsung 990 2TB SSD Review - Ninth Gen QLC at PCIe Gen4 Speeds
- Phison E37T SSD Controller Exclusive Preview - The Fastest DRAMless SSD Platform Yet
- Seagate FireCuda X1070 4TB SSD Review - A New Mainstream Contender
- Micron 3610 2TB SSD Review - DRAMless QLC at 11,000 MB/s
- SK hynix Platinum P51 2TB SSD Review - A Powerful Gen5 Alternative
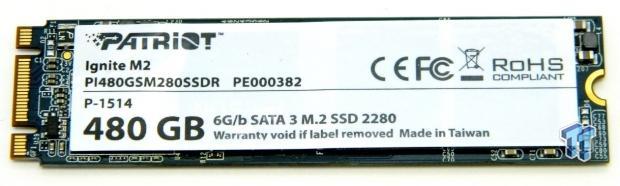
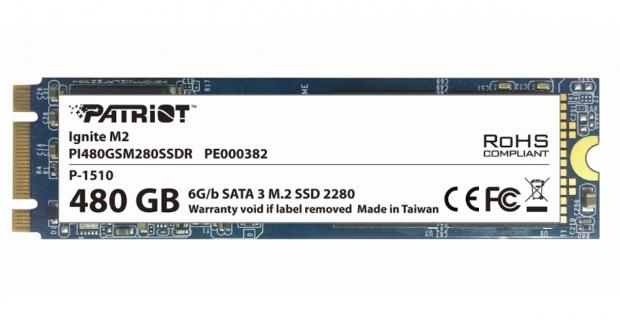
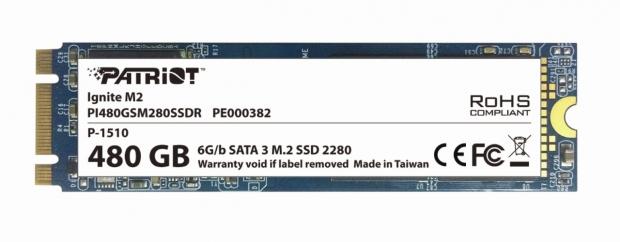
The front side of the drive has a full-length manufacturers label affixed to it. The label lists the drive's physical size (2280=22mm X 80mm), capacity, model number and a warning that the warranty will be voided if the label is removed.
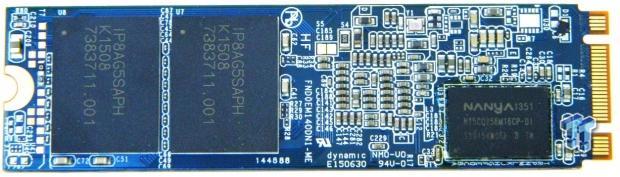
The rear of the drive houses two of the drive's 4 flash packages and a DRAM cache package.
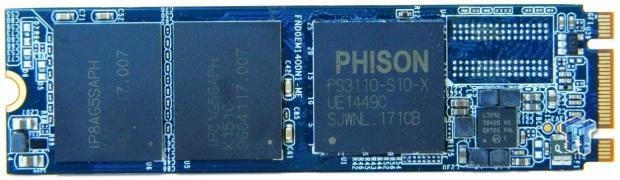
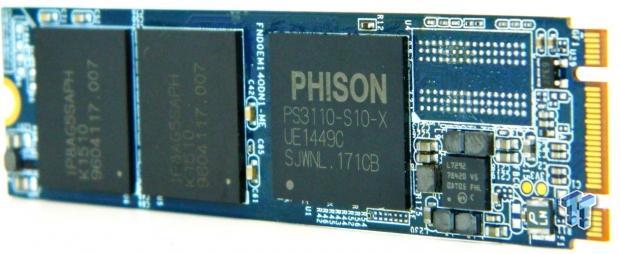
Here is the front half of the drive with the label removed. This side of the PCB houses two flash packages and the drive's Phison S10 controller.
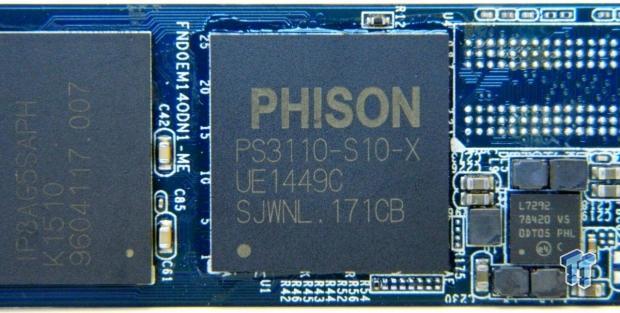
Here is a close-in view of the drive's S10 controller.
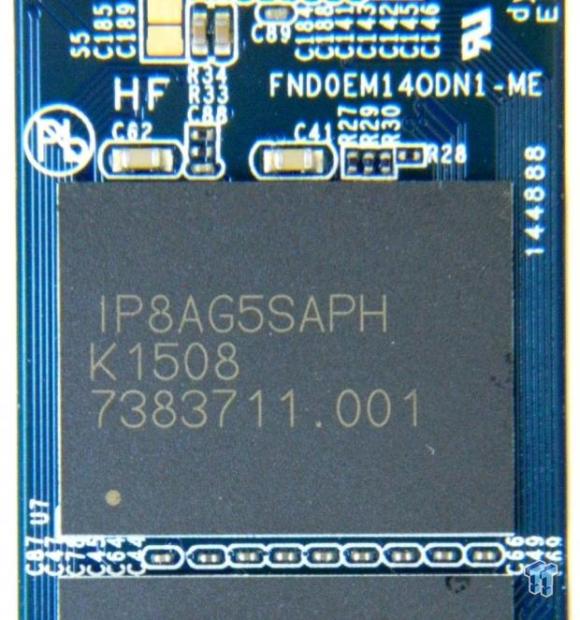
Here is a close-in view of one of the drive's four Micron 128GB 16nm asynchronous MLC flash packages.
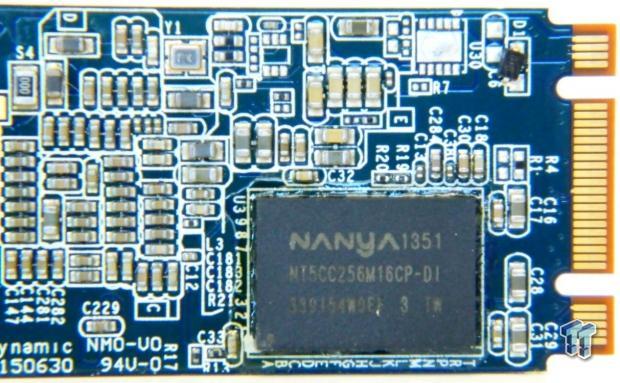
Finally, a close-in view of the drive's edge connector and lone DRAM package. This 4Gb (512MB) Nanya 1600MHz CL 11 DDR3 DRAM package is utilized for caching LBA addresses.
Test System Configuration

We would like to thank the following companies: ASRock, Crucial, Intel, Corsair, RamCity, IN WIN, and Seasonic for making our test system possible.
- Drive Properties
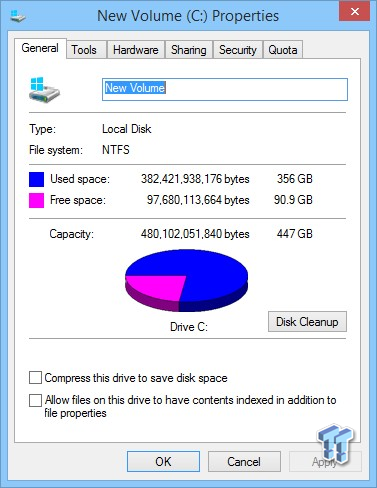
The majority of our testing is performed with our test drive as our boot volume. Our boot volume is 75% full for all OS Disk "C" drive testing to replicate a typical consumer OS volume implementation. We feel that most of you will be utilizing your SSD's for your boot volume and that presenting you with results from an OS volume is more relevant than presenting you with empty secondary volume results. We unintentionally over-filled the drive slightly to 80% and decided doing so would not have much of an impact in comparison to filling the drive to 75% of its capacity.
System settings: Cstates and Speed stepping are both disabled in our systems BIOS. Windows High Performance power plan is enabled. Windows write caching is enabled, and Windows buffer flushing is disabled. We are utilizing Windows 8.1 64-bit for all of our testing except for our MOP (Maxed-Out Performance) benchmarks where we switch to Windows Server 2008 R2 64 Bit.
Synthetic Benchmarks - ATTO, Anvil Storage Utilities, CrystalDiskMark & AS SSD
ATTO
Version and / or Patch Used: 2.47
ATTO is a timeless benchmark used to provide manufacturers with data used for marketing storage products.
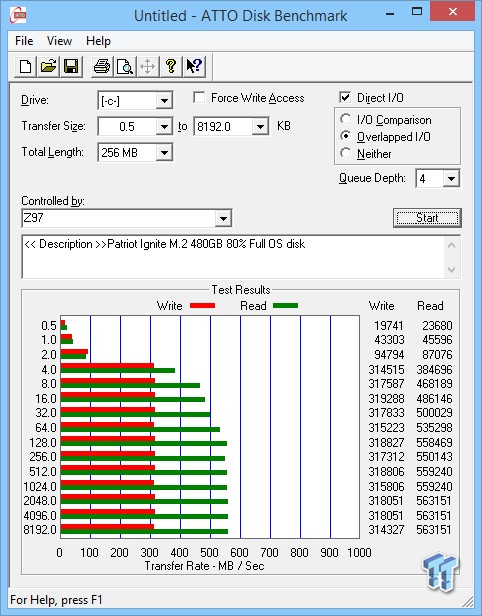
Sequential read transfers max out at 550 MB/s. Sequential write transfers max out at 311 MB/s. We are not hitting spec, but keep in mind that this is our boot volume and it's 80% full. That said, we would point out that we are properly converting KB to MB; we are doubtful that anyone else is converting KB to MB including manufacturers.
Sequential Write
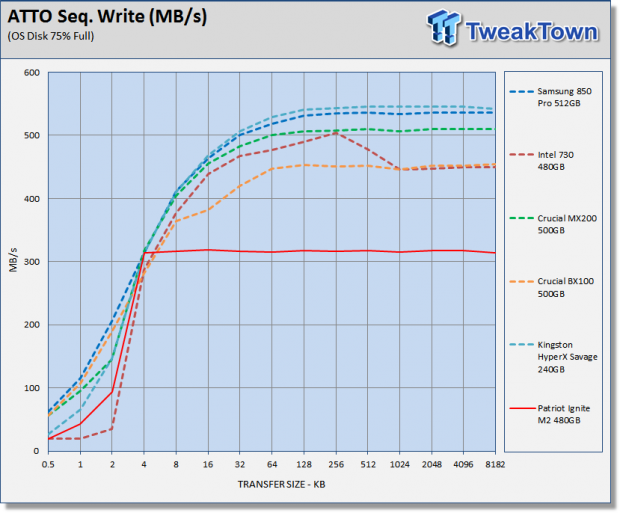
Patriot's Ignite M2 is rated for up to 320 MB/s sequential write speed the other drives on our chart are rated for higher speeds.
Sequential Read
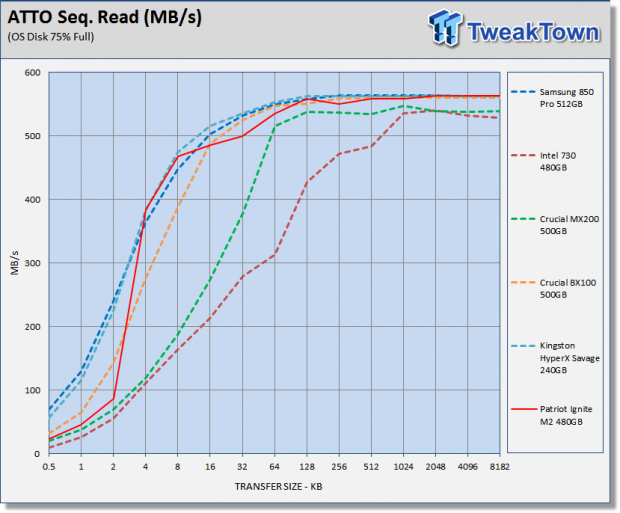
The Ignite M2's read performance is right up there with the big boy's. The Ignite M2 throws down better performance than our Intel and Crucial SSD's, even managing to surpass Samsung's 3D NAND powered 850 Pro at 4KB-8KB transfers.
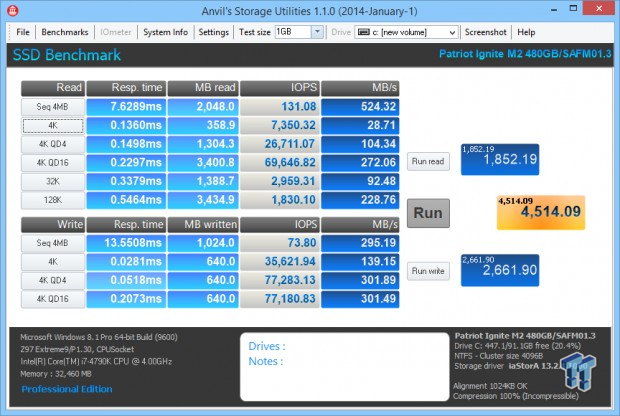
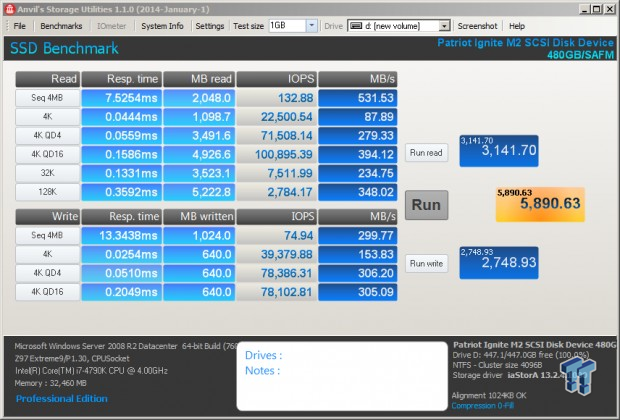
Anvil Storage Utilities
Version and / or Patch Used: 1.1.0
Anvil's Storage Utilities is a storage benchmark designed to measure the storage performance of SSD's. The Standard Storage Benchmark performs a series of tests; you can run a full test or just the read or write test, or you can run a single test, i.e. 4k QD16.
Scoring
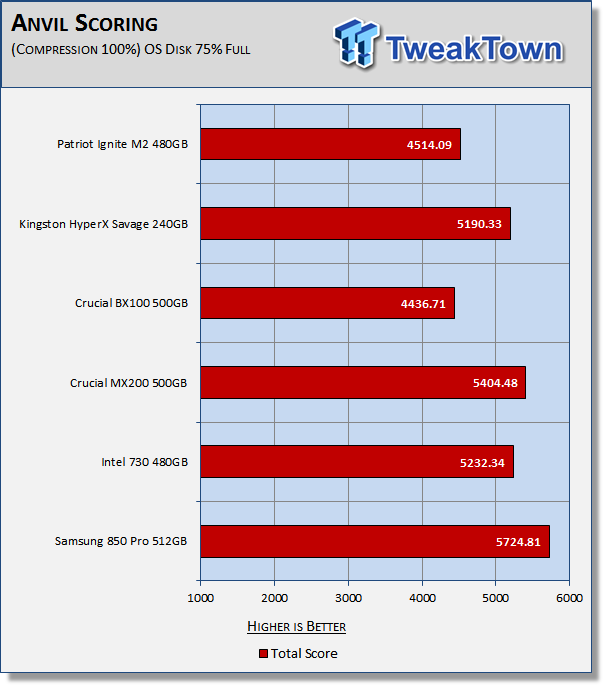
Anvil's scoring gives a good indication of a drives overall performance. The Ignite M2 is able to outperform Crucial's BX100 in scoring, but the rest of the drives on our chart all score 5,000 points or higher.
(Anvil) Read IOPS through Queue Depth Scale
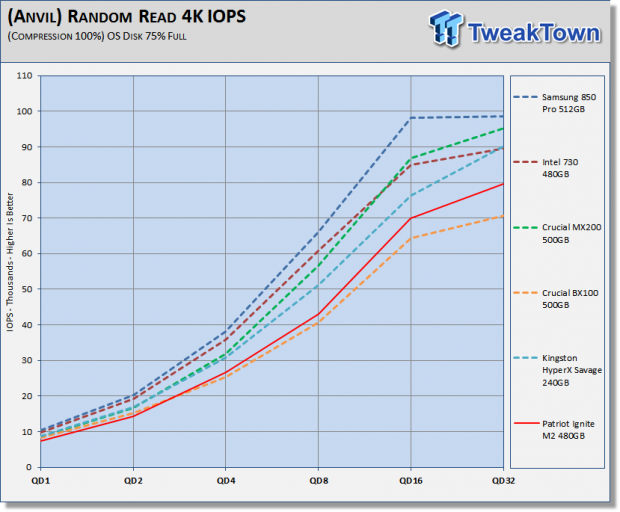
The Ignite M2 takes a performance hit when data is random and incompressible. In this scenario, it is only able to outperform Crucial's BX100 at QD4 and above.
(Anvil) Write IOPS through Queue Scale
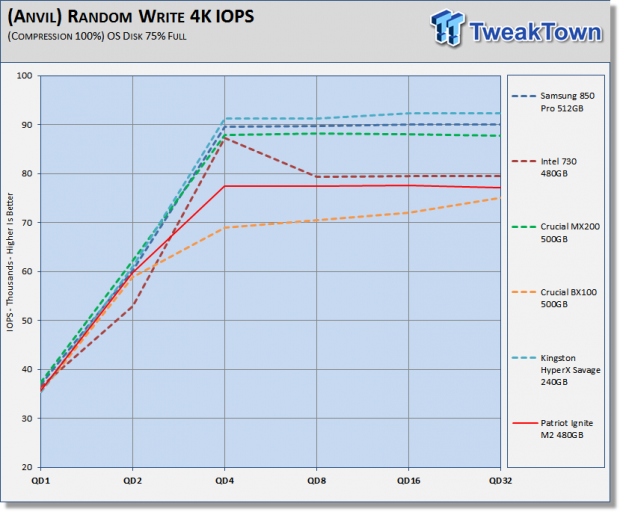
Async flash to a small degree, but primarily a lack of parallelism is holding the Ignite M2 back in this test. Kingston's HyperX Savage utilizes the same controller and is able to leverage parallelism via 16 flash-packages to dominate this test.
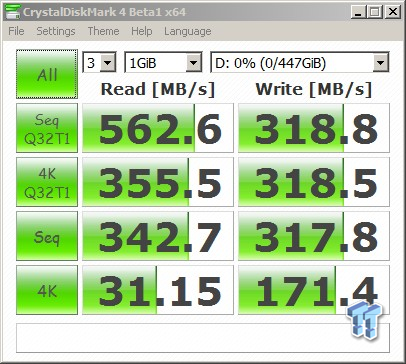
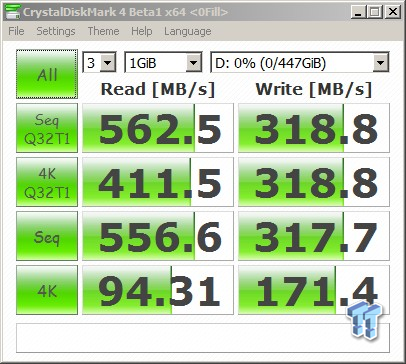
CrystalDiskMark
Version and / or Patch Used: 3.0 Technical Preview
CrystalDiskMark is disk benchmark software that allows us to benchmark 4k and 4k queue depths with accuracy.
Note: Crystal Disk Mark 3.0 Technical Preview was used for these tests since it offers the ability to measure native command queuing at QD4.
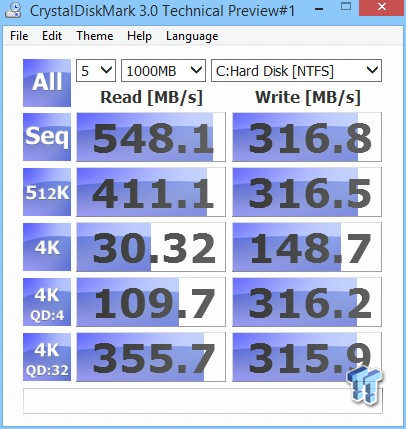
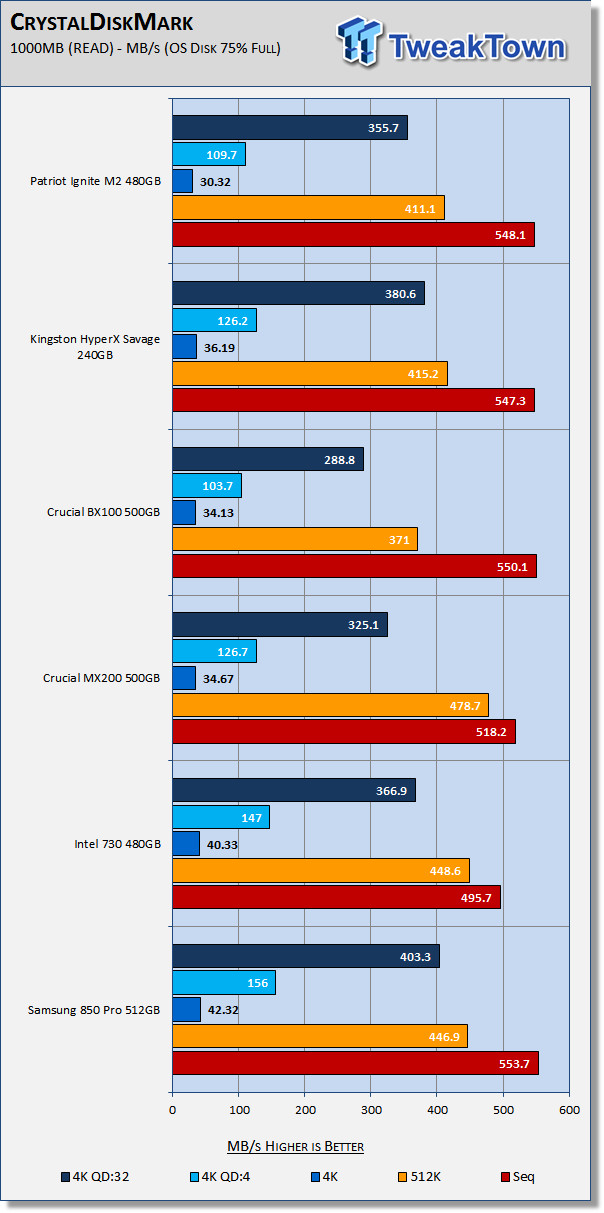
Parallelism is not in play when reading sequential data and the Ignite M2 is able to outperform most of the drives on our chart when reading sequential data.
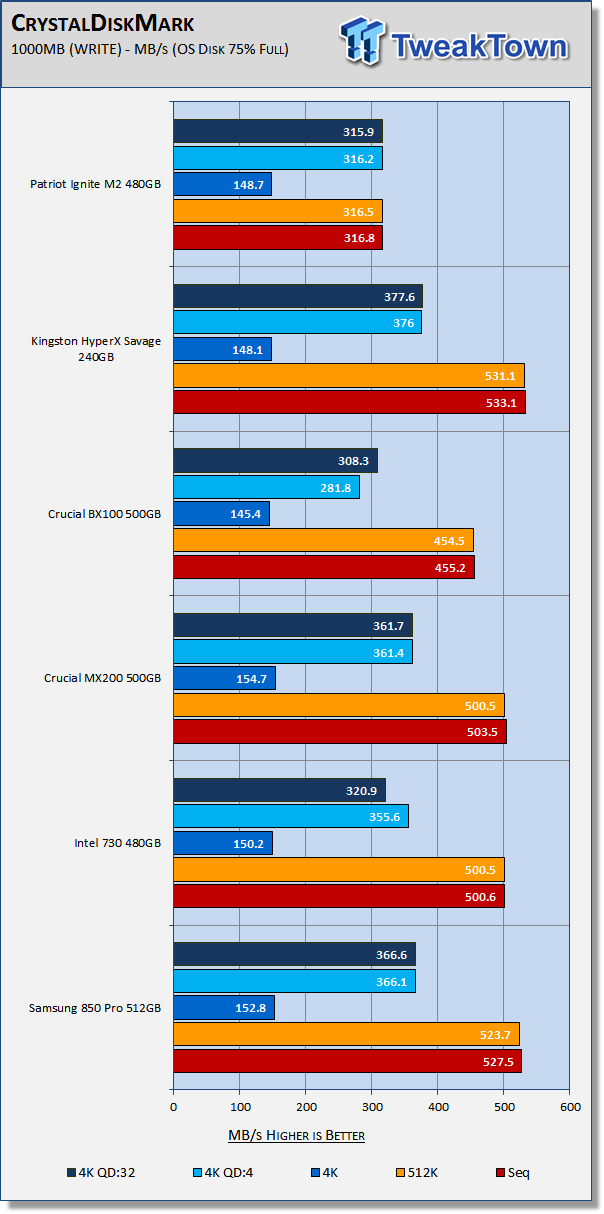
Where it matters most, 4K QD1, the Ignite M2 can really deliver.
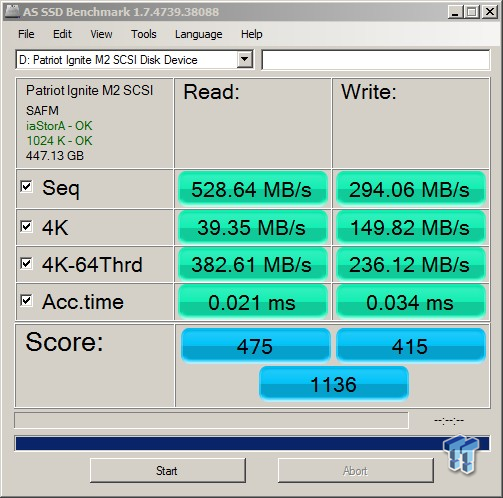
AS SSD
Version and / or Patch Used: 1.7.4739.38088
AS SSD determines the performance of Solid-State Drives (SSD). The tool contains four synthetic as well as three practice tests. The synthetic tests are to determine the sequential and random read and write performance of the SSD.
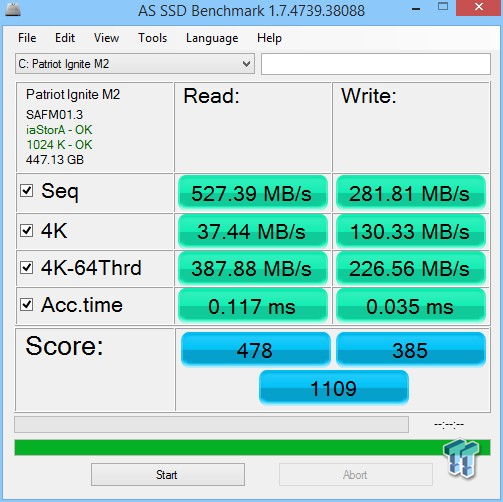
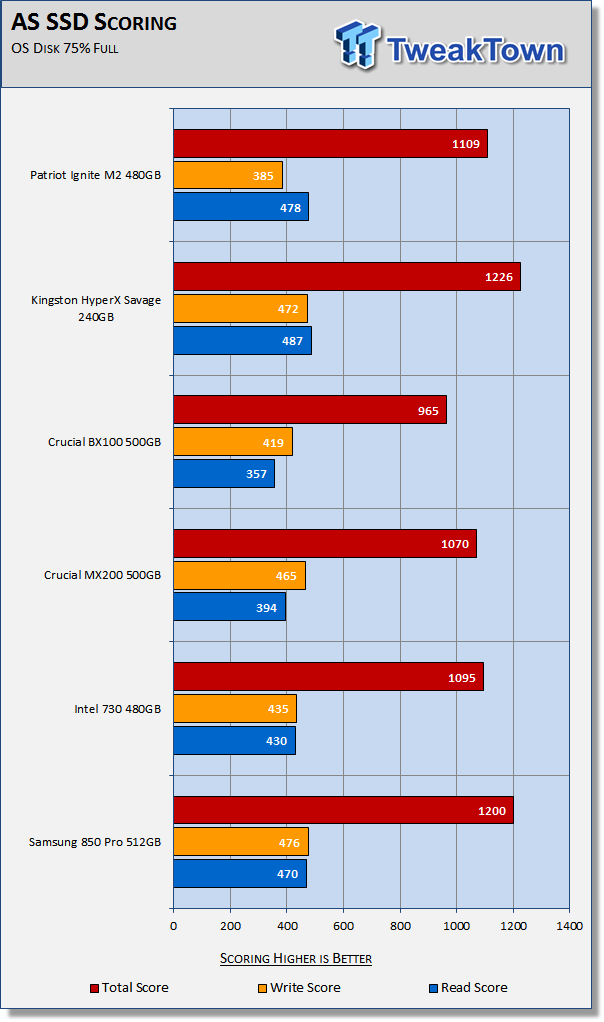
The Ignite M2 defeats most of the drives on our chart in this test. Its read score is second only to the HyperX Savage. Let's see how well the Ignite M2 performs when subjected to our real-world simulations.
Benchmarks (Trace Based OS Volume) - PCMark Vantage, PCMark 7 & PCMark 8
Light Usage Model
We are going to categorize these tests as indicative of a light workload. If you utilize your computer for light workloads like browsing the web, checking emails, light gaming, and office related tasks, then this category of results is most relevant for your needs.
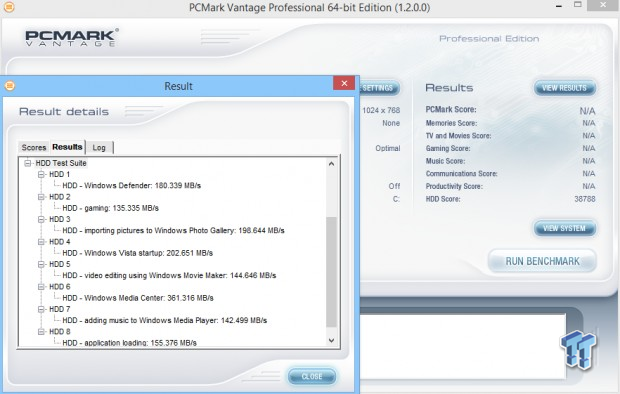
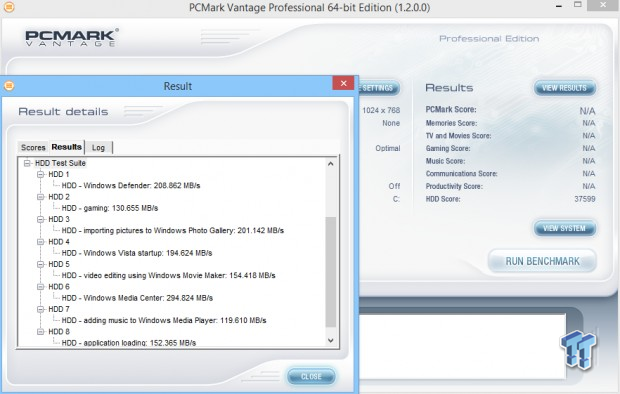
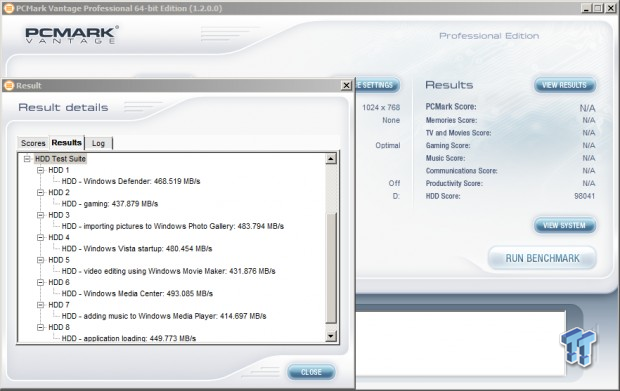
PCMark Vantage - Hard Disk Tests
Version and / or Patch Used: 1.2.0.0
The reason we like PCMark Vantage is because the recorded traces are played back without system stops. What we see is the raw performance of the drive. This allows us to see a marked difference between scoring that other trace-based benchmarks do not exhibit. An example of a marked difference in scoring on the same drive would be empty vs. filled vs. steady state.
We run Vantage three ways. The first run is with the OS drive 75% full to simulate a lightly used OS volume filled with data to an amount we feel is common for most users. The second run is with the OS volume written into a "Steady State" utilizing SNIA's guidelines. Steady state testing simulates a drives performance similar to that of a drive that been subjected to consumer workloads for extensive amounts of time. The third run is a Vantage HDD test with the test drive attached as an empty, lightly used secondary device.
OS Volume 75% Full - Lightly Used
OS Volume 75% Full - Steady State
Secondary Volume Empty - FOB

There's a big difference between an empty drive, one that's 75% full/used, and one that's in a steady state.
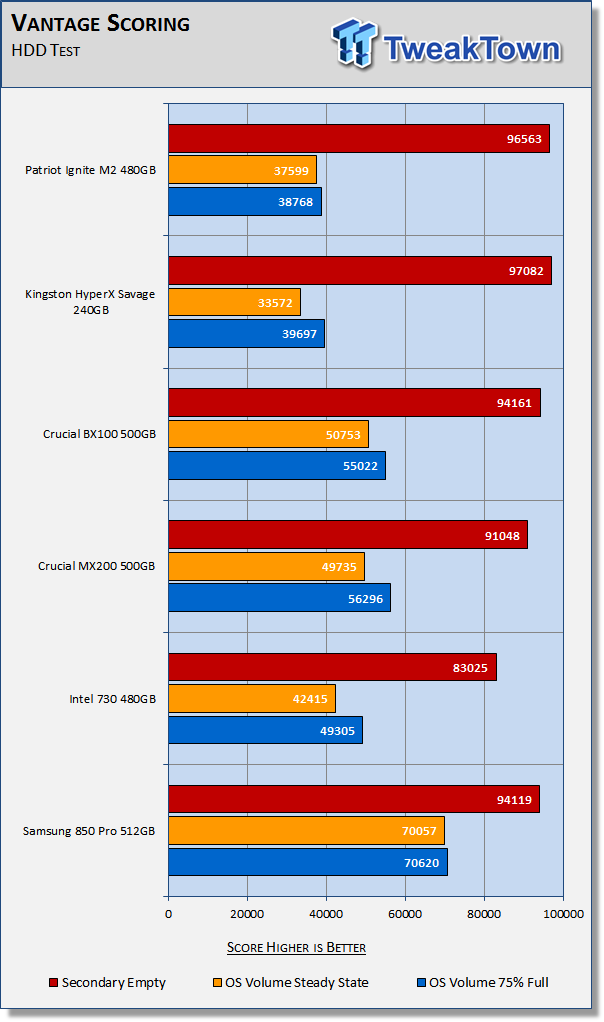
The important scores to pay attention to are "OS Volume Steady State" and "OS Volume 75% full." These two categories are most important because they are indicative of typical of consumer user states.
When a drive is in a steady state, it means garbage collection is running at the same time it's reading/writing. This is exactly why we focus on steady state performance.
Patriot's Ignite M2 outperforms our expectations with Vantage testing. When you factor in steady state performance, it is actually outperforming Kingston's HyperX Savage. The Ignite's empty score is the second highest we've recorded to date. Micron's 16nm async flash is good stuff, much better than we expected.
PCMark 7 - System Storage
Version and / or Patch Used: 1.4.0
We will look to Raw System Storage scoring for an evaluation because it's done without system stops and therefore allows us to see significant scoring differences between drives.
OS Volume 75% Full - Lightly Used
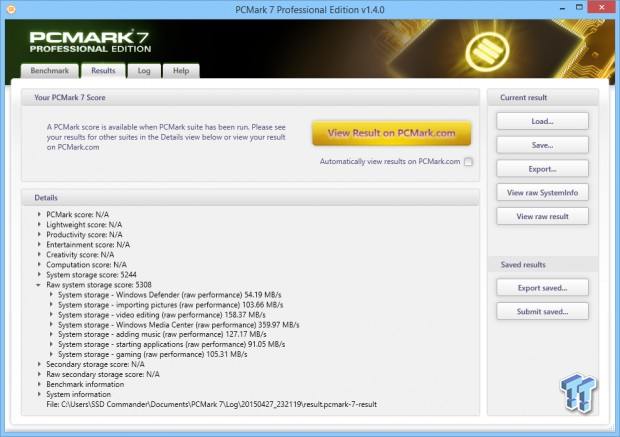
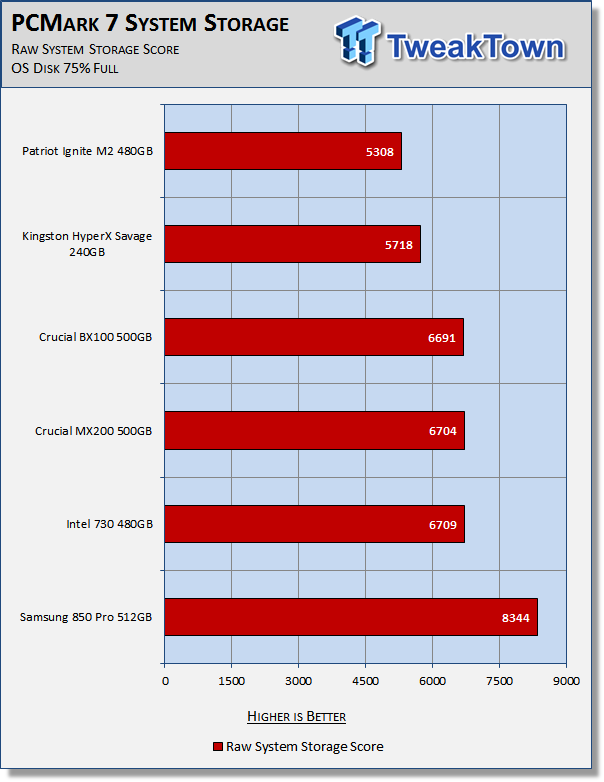
Although the Ignite M2 is outscored by the drives on our chart this is to be expected. The Ignite M2 is working with less parallelism and a lower sequential write speed.
PCMark 8 - Storage Bandwidth
Version and / or Patch Used: 2.4.304
We use PCMark 8 Storage benchmark to test the performance of SSDs, HDDs, and hybrid drives with traces recorded from Adobe Creative Suite, Microsoft Office, and a selection of popular games. You can test the system drive or any other recognized storage device, including local external drives. Unlike synthetic storage tests, the PCMark 8 Storage benchmark highlights real-world performance differences between storage devices.
OS Volume 75% Full - Lightly Used
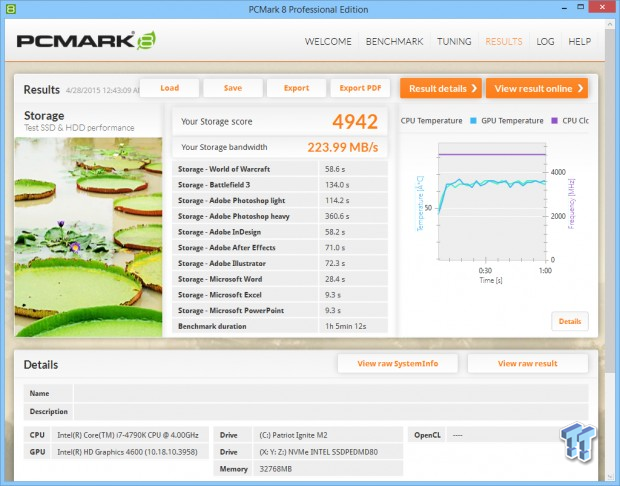
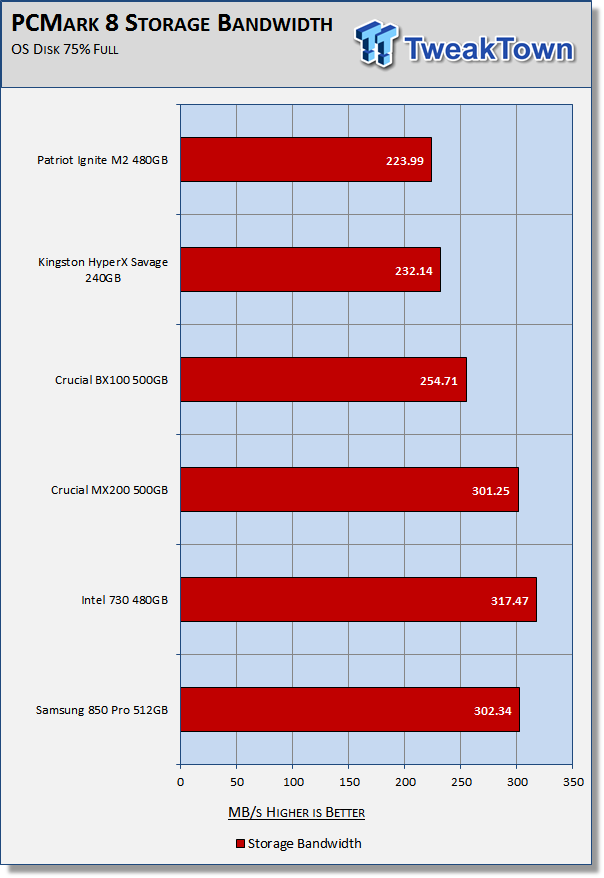
PCMark 8 is the most intensive light model workload simulation we run. For what it is, the Ignite M2 is exceeding our expectations.
Benchmarks (Secondary Volume) - Max IOPS, Disk Response & Transfer Rates
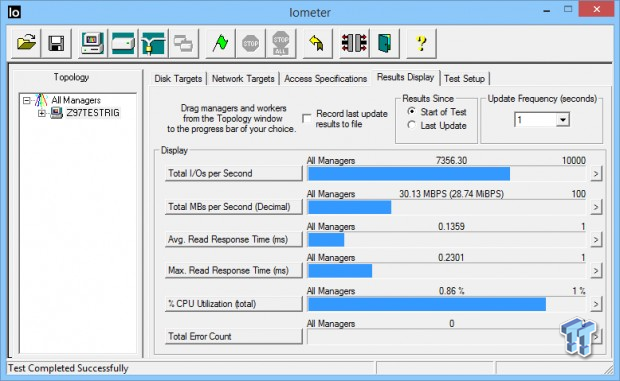
Iometer - Maximum IOPS
Version and / or Patch Used: Iometer 2014
We use Iometer to measure high queue depth performance. The drive is not partitioned.
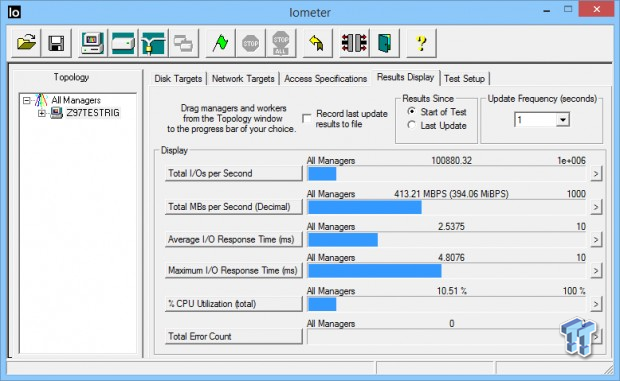
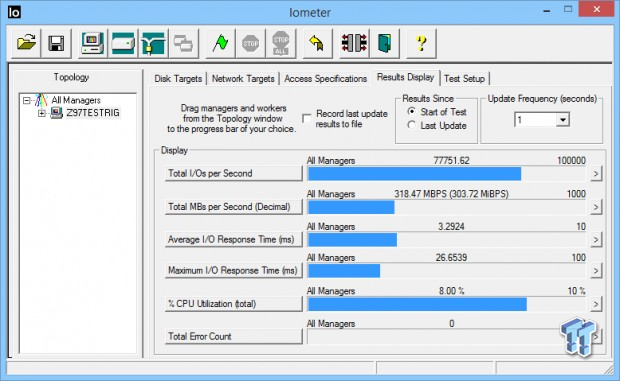
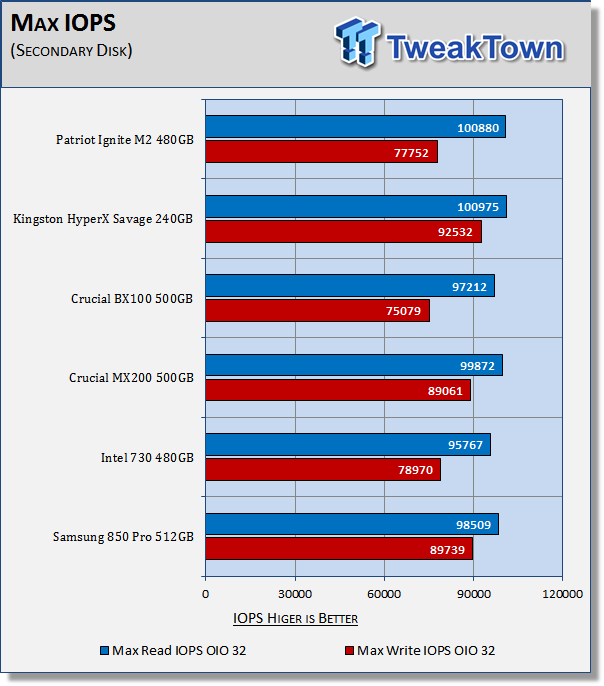
Patriot specs the Ignite at 90/77K 4KB random performance and we were easily able to exceed those specifications. The Ignites random read performance is the second best we've recorded for a SATA-based SSD.
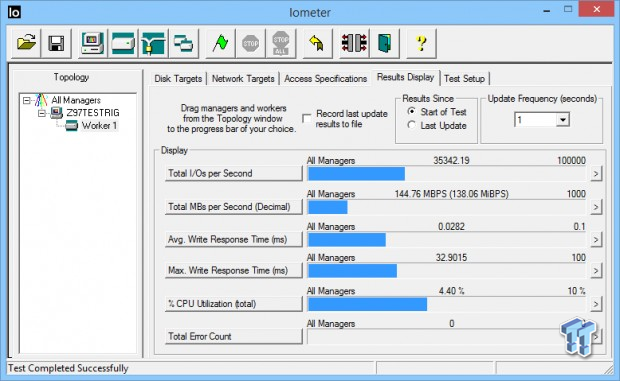
Iometer - Disk Response
Version and / or Patch Used: Iometer 2014
We use Iometer to measure disk response times. Disk response times are measured at an industry accepted standard of 4K QD1 for both write and read. Each test runs twice for 30 seconds consecutively, with a 5-second ramp-up before each test. We partition the drive/array as a secondary device for this testing.
Write Response
Read Response
Average Disk Response
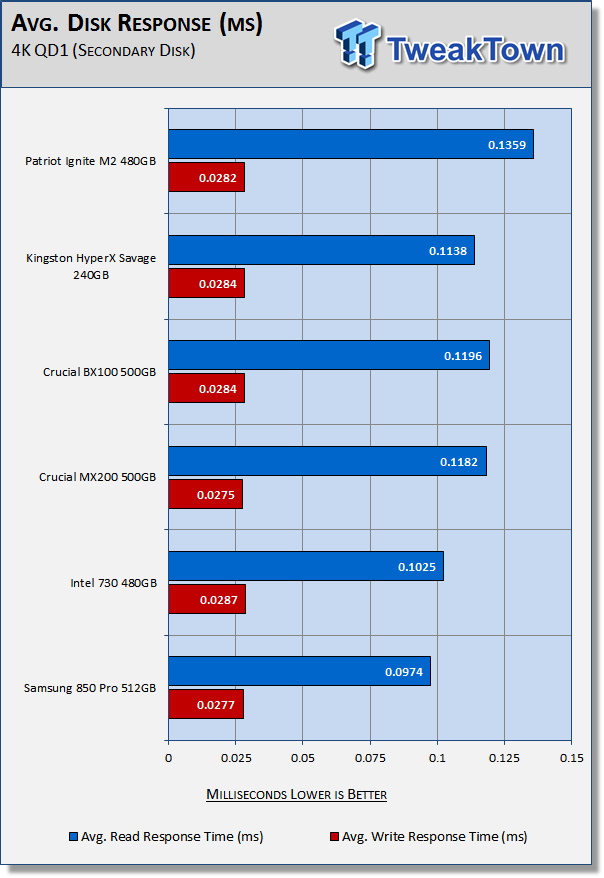
Write response times are excellent, read response times are lagging behind the other drives.
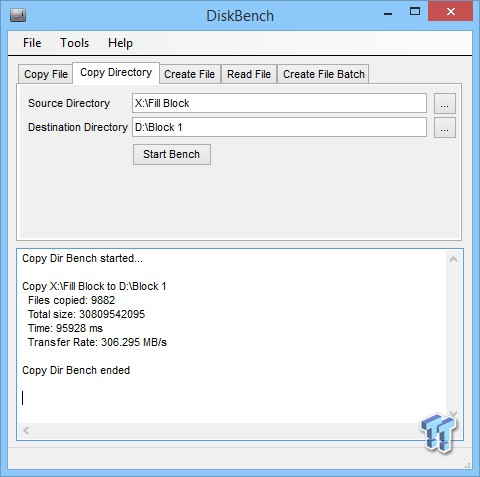
DiskBench - Directory Copy
Version and / or Patch Used: 2.6.2.0
We use DiskBench to time a 28.6GB block (9,882 files in 1,247 folders) composed primarily of incompressible random data as it's transferred from our DC P3700 PCIe NVME SSD to our test drive. We then read from a 6GB zip file that's part of our 28.6GB data block to determine the test drives read transfer rate. Our system is restarted prior to the read test to clear any cached data, ensuring an accurate test result.
Write Transfer Rate
Read Transfer Rate
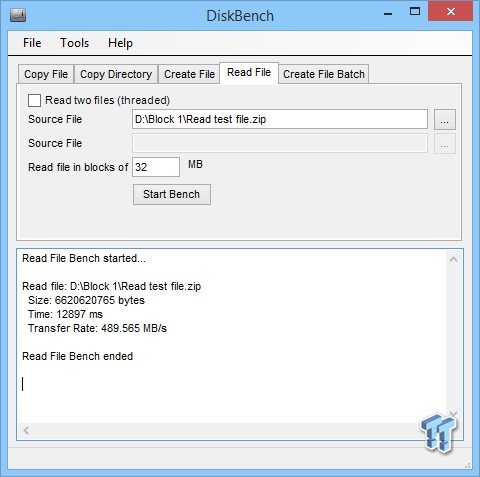
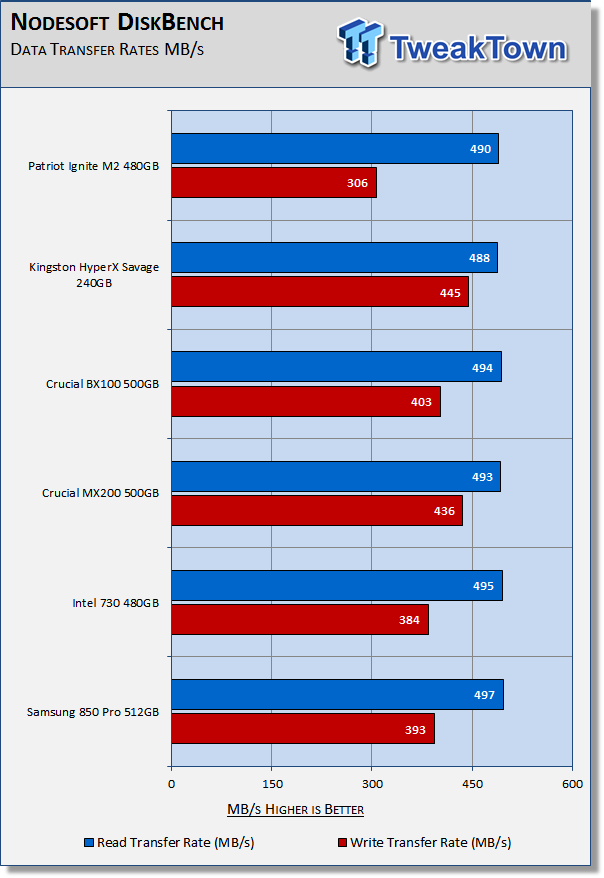
The Ignite's write transfer rate is of course lower than the rest of our drives, but as a percentage of its rated write speed it is writing closer to its rated write speed than any of the drives on our chart. Read transfer rates are very good, better than the HyperX Savage which utilizes the same controller.
Benchmarks (Secondary Volume) - PCMark 8 Extended, 70/30 Mixed Workload
Futuremark PCMark 8 Extended - Consistency Test
Heavy Usage Model
We consider PCMark 8's consistency test to be a heavy usage model test. This is the usage model most enthusiasts, heavy-duty gamers, and professionals fall into. If you do a lot of gaming, audio/video processing, rendering, or have workloads of this nature, then this test will be most relevant for you. PCMark 8 has built-in, command line executed storage testing. The PCMark 8 Consistency test measures the performance consistency and the degradation tendency of a storage system.
The Storage test workloads are repeated. Between each repetition, the storage system is bombarded with a usage that causes degraded drive performance. In the first part of the test, the cycle continues until a steady degraded level of performance has been reached. (Steady State)
In the second part, the recovery of the system is tested by allowing the system to idle and measuring the performance after 5-minute long intervals. (Internal drive maintenance: Garbage Collection (GC)) The test reports the performance level at the start, the degraded steady-state, and the recovered state, as well as the number of iterations required to reach the degraded state and the recovered state.
We feel Futuremark's Consistency Test is the best test ever devised to show the true performance of solid-state storage in a heavy usage scenario. This test takes on average 13 to 17 hours to complete, and writes somewhere between 450GB and 14,000GB of test data depending on the drive. If you want to know what an SSD's performance is going to look like after a few months or even years of heavy usage, this test will show you.
Here's a breakdown of Futuremark's Consistency Test:
Precondition phase:
1. Write to the drive sequentially through up to the reported capacity with random data.
2. Write the drive through a second time (to take care of overprovisioning).
Degradation phase:
1. Run writes of random size between 8*512 and 2048*512 bytes on random offsets for 10 minutes.
2. Run performance test (one pass only).
3. Repeat 1 and 2 for 8 times, and on each pass increase the duration of random writes by 5 minutes.
Steady state phase:
1. Run writes of random size between 8*512 and 2048*512 bytes on random offsets for 50 minutes.
2. Run performance test (one pass only).
3. Repeat 1 and 2 for 5 times.
Recovery phase:
1. Idle for 5 minutes.
2. Run performance test (one pass only).
3. Repeat 1 and 2 for 5 times.
Storage Bandwidth
PCMark 8's Consistency test provides a ton of data output that we use to judge a drive's performance.
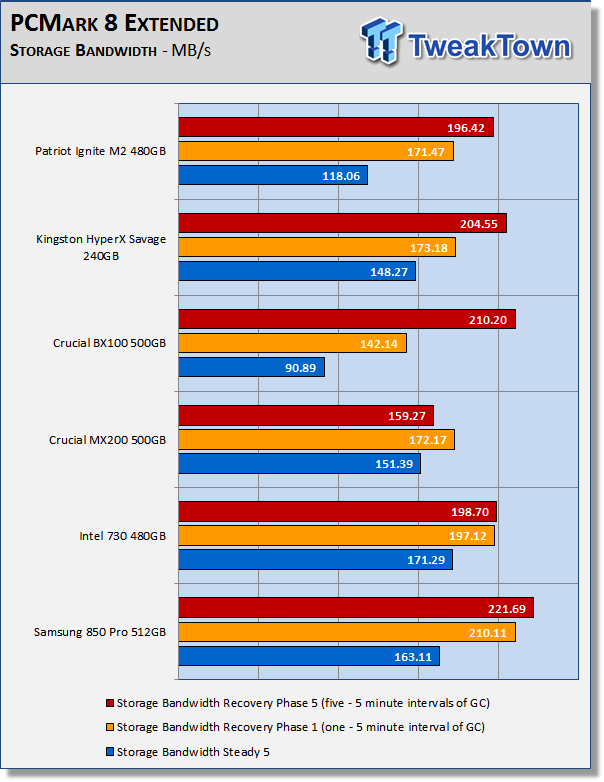
We consider steady state bandwidth (the blue bar) our test that carries the most weight in ranking a drive/arrays performance. Performance after Garbage Collection (GC) (the orange and red bars) is what we consider the second most important consideration when ranking a drives performance. Trace based steady state testing is where true high performing SSDs are separated from the rest of the pack.
The Ignite M2 isn't designed for heavy workloads. Its lower write speed and lack of parallelism is holding it back in this test. The S10 is capable of a lot more.
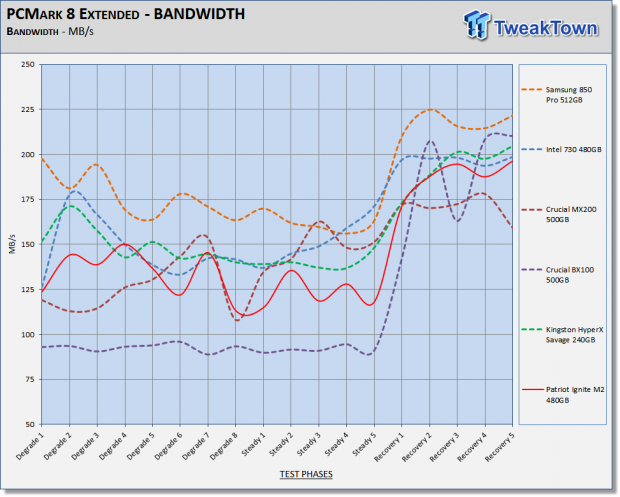
We chart our test subject's storage bandwidth as reported at each of the test's 18 trace iterations. This gives us a good visual perspective of how our test subjects perform as testing progresses.
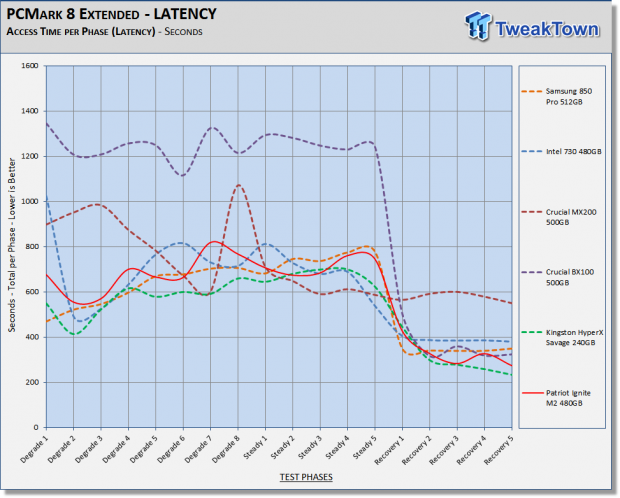
Total Access Time (Latency)
We chart the total time the disk is accessed as reported at each of the test's 18 trace iterations.
Disk Busy Time
Disk Busy Time is how long the disk is busy working. We chart the total time the disk is working as reported at each of the tests 18 trace iterations.
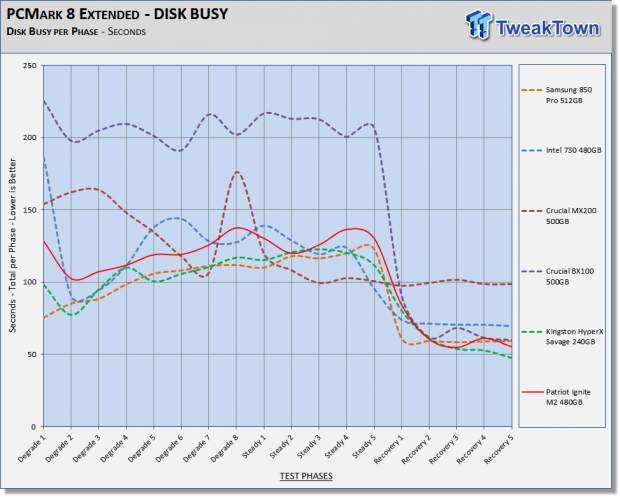
When latency is low, disk busy time is low as well.
Data Written
We measure the total amount of random data that our test drive/array is capable of writing during the degradation phases of the consistency test. Pre-conditioning data is not included in the total. The total combined time that degradation data is written to the drive/array is 470 minutes. This can be very telling. The better a drive/array can process a continuous stream of random data, the more data will be written.
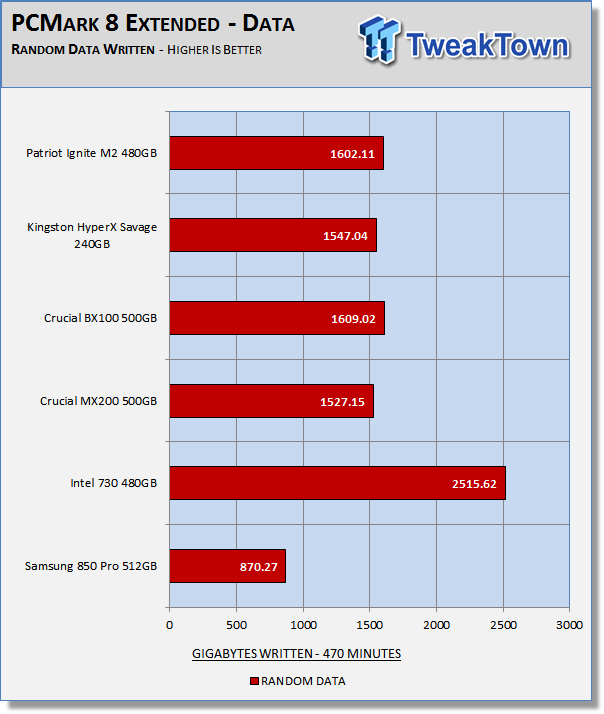
Sequential write speed is much less of a factor in this aspect of our test. The Ignite's S10 controller has 3 of its 4 cores dedicated to flash management and this segment of our test shows the controller is doing a good job of cleaning up the drives flash array as testing progresses.
70/30 Mixed Workload Test (Sledgehammer)
Version and / or Patch Used: Iometer 2014
Heavy Usage Model
This test hammers a drive so hard we've dubbed it "Sledgehammer". Our 70/30 Mixed Workload test is designed to simulate a heavy-duty enthusiast/workstation steady-state environment. We feel that a mix of 70% read/30% write, full random 4K transfers best represents this type of user environment. Our test allows us to see the drive enter into and reach a steady state as the test progresses. Phase one of the test preconditions the drive for 1 hour with 128K sequential writes. Phase two of the test runs a 70% read/30% write, full random 4K transfer workload on the drive for 1 hour. We log and chart (phase two) IOPS data at 5-second intervals for 1 hour (720 data points). 60 data points = 5 minutes.
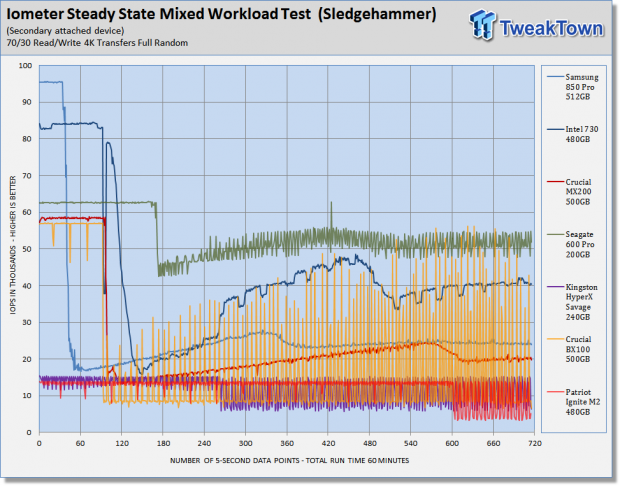
What we like about this test is that it reflects reality. Everything lines up, as it should. Consumer drives don't outperform Enterprise-Class SSD's that were designed for enterprise workloads. Consumer drives based on old technology are not outperforming modern Performance-Class SSD's, etc.
We see drive maintenance kicking into high gear at about data point 600. The Ignite M2 is performing slightly better than our HyperX Savage, but lower than the others on our chart.
Maxed-Out Performance (MOP)
This testing is just to see what the drive is capable of in an FOB (fresh out of box) state under optimal conditions. We are utilizing Windows Server 2008 R2 64-bit for this testing.
The HyperX Savage set a lab record for the best FOB Vantage performance in our last review.The Ignite M2 now holds the record.
Full Random
0-Fill

100% Compression
0-Fill
Final Thoughts
Solid-state storage is the most important performance component found in a modern system today. Without it, you do not even have a performance system.
We love Phison's S10 controller and Patriot's Ignite M2 makes us love it even more. The Ignite M2 demonstrates that even asynchronous flash is a viable option when paired with the right controller. This is good news because asynchronous flash implementation translates to lower cost of ownership.
That said we would like if the Ignite M2 were capable of higher sequential write speed. A lack of parallelism is magnified by Patriot's choice to go with asynchronous flash. The 2.5" Ignite with double the flash packages has a sequential write speed that's 225 MB/s faster, and we see other M.2 drives sporting only 2 flash packages able to hit 500 MB/s sequential write speed. The reason is, those drives are using synchronous flash instead of asynchronous, BUT those drives are also more expensive. It's a tradeoff of sorts. The ignite M2's lack of sequential write speed is offset to a large degree by its superior low QD random write performance. At a low QD random write, which is the most prevalent of all transactions an SSD will perform in an OS environment; the Ignite M2 is a top-flight performer. For the price, the performance is there and then some. Patriot's Ignite M2 is a very good performer and its low cost is compelling.
As our boot drive, the Ignite M2 handles well. Boots are fast, and the OS is responsive. Even while the drive was being written into a steady state for our Vantage testing, launching my internet browser and other software was still very fast. With some drives, this is definitely not the case. As an OS disk the performance is there, but if you are transferring large files, you will have to wait a bit longer.
Patriot was a big name in SSD's and we are excited to see them back in the game. I own numerous Patriot SSD's from back in the day, and all of them are still running fast and flawlessly. As a brand, Patriot is one of the best out there.
Here's what we liked and disliked about the Patriot Ignite M2 480GB SATA III SSD:
What we disliked: Below average sequential write speed. No toolbox.
What we liked: As an OS disk, the Ignite M2 excels. Sequential read performance. Low cost of ownership.
We recommend the Ignite M2 for those of you looking for a low cost M.2 SSD that delivers top-notch OS performance.
 Samsung 990 2TB SSD Review - Ninth Gen QLC at PCIe Gen4 Speeds
 HighPoint Rocket 1604L Gen5 x16 NVMe Software RAID AIC Review: half the price with full 59 GB/s speed
 UGREEN NASync DXP4800 GT Review: powerful 4-bay NAS with AMD Ryzen and dual 10GbE ports
 Phison E37T SSD Controller Exclusive Preview - The Fastest DRAMless SSD Platform Yet
 Seagate FireCuda X1070 4TB SSD Review - A New Mainstream Contender
 Giveaway: Win an ASRock B850 Riptide WiFi and Phantom Gaming PG-850G PSU
 China's CXMT is on track to nearly match Micron's DRAM production capacity by the end of 2026
 NVIDIA's RTX 50 Super GPUs have reached board partners, but launch is on hold over 3GB GDDR7 pricing
 Amazon's God of War series is recasting Kratos after Ryan Hurst suffered an on-set injury
 Physical games don't matter to GameStop, CEO says
 GameStop CEO Ryan Cohen wants to buy eBay and build out an in-game digital marketplace
 KB5101650 Windows 11 update is causing some Dell PCs to shut down unexpectedly
 Bethesda on Elder Scrolls VI, Fallout 5 Xbox exclusivity: 'It's too early to comment'
 Assassin's Creed Black Flag Resynced makes in one day what Shadows took four days to earn
 Bethesda gives news on Elder Scrolls 6, confirms 4 Fallout projects, new Starfield content
 SteelSeries Arctis Nova 7 Wireless Gen 2 Headset Review - New and Improved, But Is It Enough?
 AMD Ryzen 7 7700X3D Review - Days of Future Past
 ASUS ExpertBook Ultra (Panther Lake) 14" Business Laptop Review
 ASUS ROG Raikiri II Xbox Wireless Controller Review - Ready to Take Control
 MOZA FMP18 Panel Bundle Review: authentic F/A-18 Hornet cockpit controls for flight sims
 Micron 6600 ION 245.76TB Enterprise SSD Review - Best in Class Programming Speeds
 MOZA MA3F EFCM Flight Control Module Review: authentic Airbus A320 autopilot panel for simulators
 Turtle Beach Stealth Pro II Wireless Gaming Headset Review - Premium Sound, Fantastic Features
 MOZA MGX1000 Instrument Panel Review: a realistic Garmin G1000 replica for immersive flight sims
 Hisense U6SF 65-inch MiniLED TV: High Performance Meets Leisurely Convenience
 I stopped digging through Windows menus after I set up this one folder
 Don't sell your Windows laptop until you do these things
 6 PC cleaning mistakes to avoid for safer hardware maintenance
 Phison and Intel Take Aim at Local AI's Memory Wall with aiDAPTIV
 How to Remap Keyboard Keys in Windows using Microsoft PowerToys
 7 tips to organize your Windows files for faster, easier access
 Intel Arc G3 Extreme first impressions with MSI's Claw 8 EX AI+ - Incredible power for an extreme price
 How to fix Wi-Fi Adapter Not Working on Windows laptops: troubleshooting tips
 Hisense U7SG 4K TV: Modern Entertainment for the New Age