


Our Verdict
Introduction
Samsung's PM853T and 845DC EVO have helped dispel the stigma surrounding 3-bit MLC (TLC) NAND in the datacenter. 3-bit MLC has endurance limitations, but with the correct engineering and firmware expertise, it is fully capable of addressing read-centric workloads in the datacenter. Coupling cost-effective 3-bit MLC NAND with enterprise-grade features creates a solution that all but displaces the relatively old practice of using client SSDs as a value-tier in the datacenter.
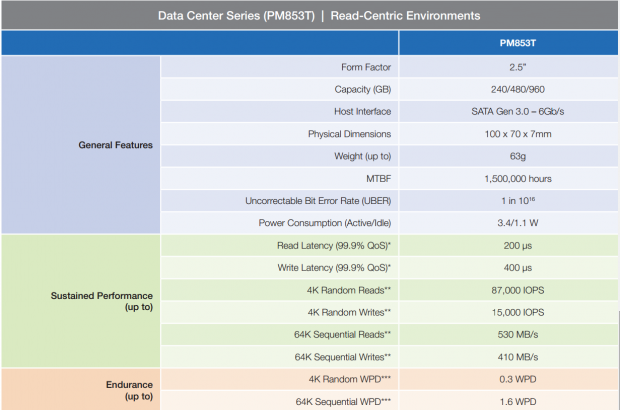
The OEM specific PM853T is very similar to its retail branded sibling, the : 845DC EVO. While there are a few key differentiators between the two, they are both powered by Samsung 19nm 3-bit MLC, and available in capacity points of 240, 480, and 960GB in a 7mm form factor. Both SSDs also offer power loss protection via Tantalum capacitors - a crucial requirement in datacenter environments.

The differences become clear when we look at the performance specifications. The 6GB/s SATA PM853T features datacenter-optimized firmware that delivers a slightly higher random 4k write performance of 15,000 IOPS, but delivers the same blistering 87,000 IOPS performance in random read workloads. The read performance of both Samsung SSDs easily outpaces competitors in the same class. Both Samsung SSDs offer up to 530 / 410 MB/s of sequential read/write performance, meeting or beating other competitors in the same class.
The PM853T has a slightly more conservative endurance rating of 0.3 DWPD (Drive Writes per Day) in comparison to the 845DC EVO with 0.35 DWPD. Endurance varies by workload, and the 0.3 DWPD metric represents pure random write workloads, which aren't really the intended workload for a read-centric SSDs. In sequential workloads, the PM853T can extend endurance up to 1.6 DWPD, but in many real-world deployments, the actual endurance will likely fall in the middle. Careful analysis of the workload, and possible user adjustments of overprovisioning, can allow users to deploy the PM853T into a wide range of applications. It is important to note that the DWPD measurements are for five years, while the warranty period is for three years. The three-year warranty of the 845DC EVO is standard for OEM applications.
The PM853T offers a lower UBER rating of one per 10^16, in comparison to the one per 10^17 from the 845DC EVO. The 845DC EVO offers a two-million hour MTBF, but the PM853T steps back to 1.5 million hours. These more conservative specifications may be the result of variations in firmware, or a more stringent specification process for the OEM market.
The PM853T also extends the same focus on performance consistency we have seen with other Samsung offerings by specifying 99.9% read latency QoS at 200us, and 400us for write latency. Samsung continues to leverage their vertical-integration advantage by utilizing the Samsung MEX controller, and 1GB of Samsung's own LPDDR2 cache. Samsung has deployed the MEX controller extensively in both client and enterprise applications.
The PM853T aims to provide the same winning performance of higher endurance SSDs, at the lower price point enabled by 3-bit MLC NAND. Let's see how it holds up in our testing.
Our Latest SSD Review Coverage
- Micron 6600 ION 245.76TB Enterprise SSD Review - Best in Class Programming Speeds
- Memblaze PBlaze 7 7A40 Ocean 61.44TB Enterprise SSD Review - Oceans of QLC at 3.3 million IOPS
- KIOXIA CD9P-R 7.68TB E3.S Review - The Best-In-Class Data Center SSD
- DapuStor Roealsen6 R6060 E1.L 245.76TB SSD Review - Massive Capacity with Fast Retrieval
- Phison Pascari X200P 7.68TB Enterprise SSD Review - Sequential Read Champion
Samsung PM853T Internals and Specifications
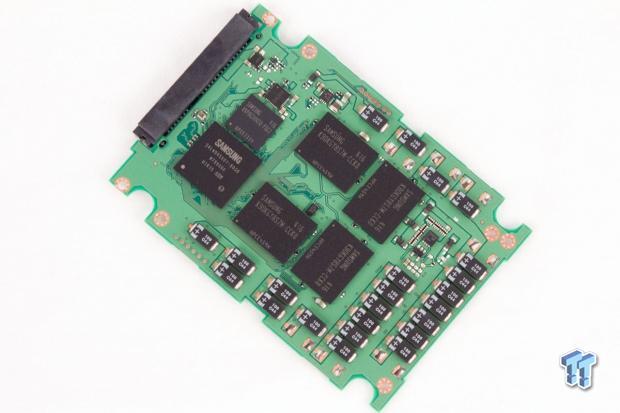
Samsung PM853T Internals


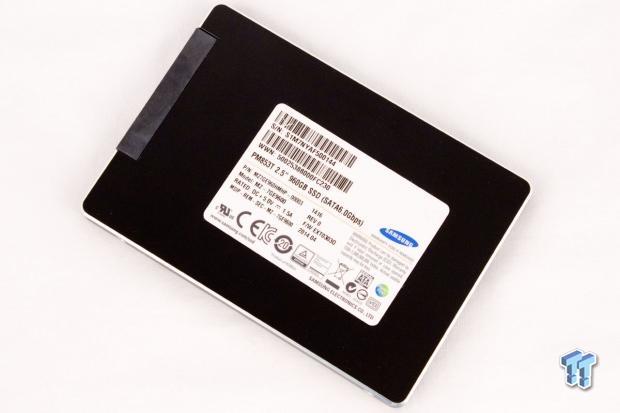
The PM853T comes with the standard spartan Samsung livery in a 2.5" form factor with a 7mm z-height.
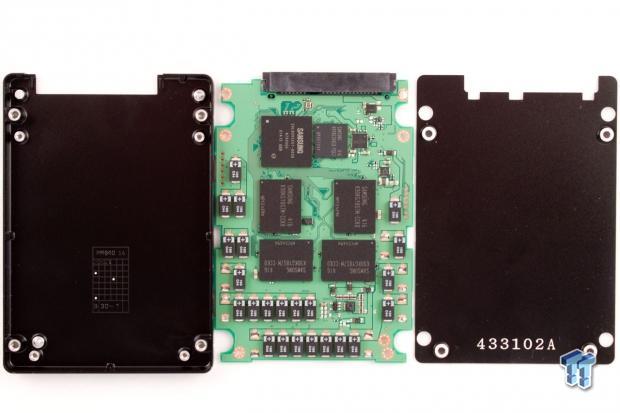
The components are not cooled with thermal pads, and no fasteners are used to secure the PCB in the case. The four protrusions inside the case mate with the PCB to hold it firmly into place.


The PCB is very familiar, and looks to be the same design employed with the 845DC EVO. There are eight packages of Samsung 19nm Toggle 3-bit 128Gbit MLC NAND.

There are several banks of Tantalum capacitors on the end of the PCB, and others interspersed among the other edges of the PCB. There are only two extra capacitors required to provide power fail protection between the 480 and 960GB capacities.

The proprietary Samsung MEX controller powers the PM853T, and is flanked by the requisite DRAM package that functions as a cache for the SSD.
Samsung PM853T Specifications
The PM853T carries the MZ7GE960HMHP-00003 part number.
Test System and Methodology


Our approach to storage testing targets long-term performance with a high level of granularity. Many testing methods record peak and average measurements during the test period. These average values give a basic understanding of performance, but fall short in providing the clearest view possible of I/O QoS (Quality of Service).
While under load, all storage solutions deliver variable levels of performance. "Average" results do little to indicate performance variability experienced during actual deployment. The degree of variability is especially pertinent, as many applications can hang or lag as they wait for I/O requests to complete. While this fluctuation is normal, the degree of variability is what separates enterprise storage solutions from typical client-side hardware.
Providing ongoing measurements from our workloads with one-second reporting intervals illustrates product differentiation in relation to I/O QoS. Scatter charts give readers a basic understanding of I/O latency distribution without directly observing numerous graphs. This testing methodology illustrates performance variability, and includes average measurements, during the measurement window.
IOPS data that ignores latency is useless. Consistent latency is the goal of every storage solution, and measurements such as Maximum Latency only illuminate the single longest I/O received during testing. This can be misleading, as a single "outlying I/O" can skew the view of an otherwise superb solution. Standard Deviation measurements consider latency distribution, but do not always effectively illustrate I/O distribution with enough granularity to provide a clear picture of system performance. We utilize high-granularity I/O latency charts to illuminate performance during our test runs.
Our testing regimen follows SNIA principles to ensure consistent, repeatable testing, and utilizes multi-threaded workloads found in typical production environments. We measure power consumption during precondition runs. This provides measurements in a time-based fashion, with results every second, to illuminate the behavior of power consumption in steady state conditions. We also present IOPS-to-Watts measurements to highlight efficiency.
The SSDs in the test pool are all 480GB, with the exception of the PM853T, which has 960GB of user-addressable capacity. Readers need to account for the capacity disparity when viewing test results, particularly power measurements. The SSDs are tested over their full LBA range to highlight performance at maximum utilization. The first page of results will provide the "key" to understanding and interpreting our test methodology.
Benchmarks - 4k Random Read/Write
4k Random Read/Write

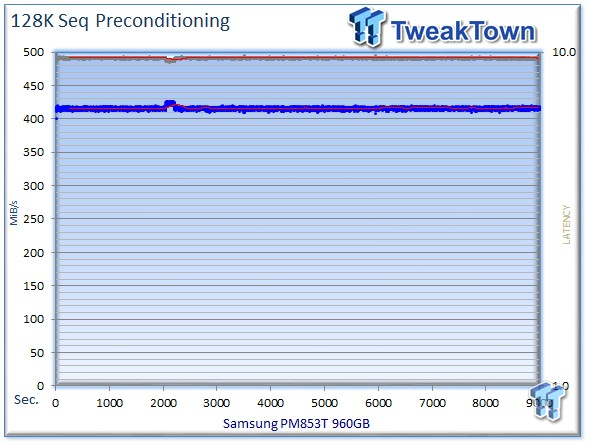
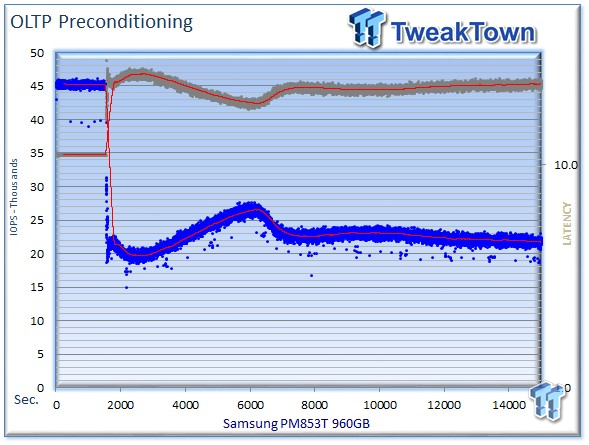
We precondition the 960GB Samsung PM853T for 9,000 seconds, or two and a half hours, receiving performance reports every second. We plot this data to illustrate the drives' descent into steady state.
This dual-axis chart consists of 18,000 data points, with the IOPS on the left, and the latency on the right. The blue dots signify IOPS, and the grey dots are latency measurements during the test. We place latency data in a logarithmic scale to bring it into comparison range. The lines through the data scatter are the average during the test. This type of testing presents standard deviation and maximum/minimum I/O in a visual manner.
Note that the IOPS and latency figures are nearly mirror images of each other. This illustrated high-granularity testing can give our readers a good feel for latency distribution by viewing IOPS at one-second intervals. This should be in mind when viewing our test results below. This downward slope of performance only occurs during the first few hours of use, and we present precondition results only to confirm steady state convergence.

Each level tested includes 300 data points (five minutes of one second reports) to illustrate performance variability. The line for each OIO depth represents the average speed reported during the five-minute interval. 4k random speed measurements are an important metric when comparing drive performance, as the hardest type of file access for any storage solution to master is small-file random. 4k random performance is a heavily marketed figure, and one of the most sought-after performance specifications.
The Samsung PM853T averages a tremendous 85,265 IOPS at 256 OIO (Outstanding I/O), and the Samsung 845DC EVO comes close with 85,155 IOPS. The Micron M500DC averages 56,259 IOPS, and the Intel DC S3500 averages 57,769 IOPS. Both Samsung 3-bit MLC entrants dominate the chart with outstanding performance in 100% random read environments.


Our Latency vs IOPS charts compare the amount of performance attained from each solution at specific latency measurements. Many applications have specific latency requirements. These charts present relevant metrics in an easy-to-read manner for readers who are familiar with their application requirements. The SSDs that are lowest and furthest to the right exhibit the most desirable latency characteristics.
Both Samsung SSDs deliver 85,000 IOPS at .1ms, the DC S3500 provides 57,000 IOPS at.1ms, and the M500DC provides 56,000 IOPS.

Garbage collection routines are more pronounced in heavy write workloads, leading to performance variability.
The PM853T bests its smaller-capacity sibling with an average of 17,482 IOPS, while the 845DC EVO averages 14,980 IOPS, slightly above the DC S3500 and its 13,841 IOPS average. The Micron M500DC is terrific with 39,089 IOPS at 256 OIO.


The Micron M500DC is on an island with superb latency during the 4k write workload. The M500DC easily beats the rest of the field.

Our write percentage testing illustrates the varying performance of each solution with mixed workloads. The 100% column to the right is a pure 4k write workload, and 0% represents a pure 4k read workload.
The large capacity of the PM853T resists staying in a steady state during this long test. It cuts an impressive swath across the chart, beating the Intel and 845DC EVO.
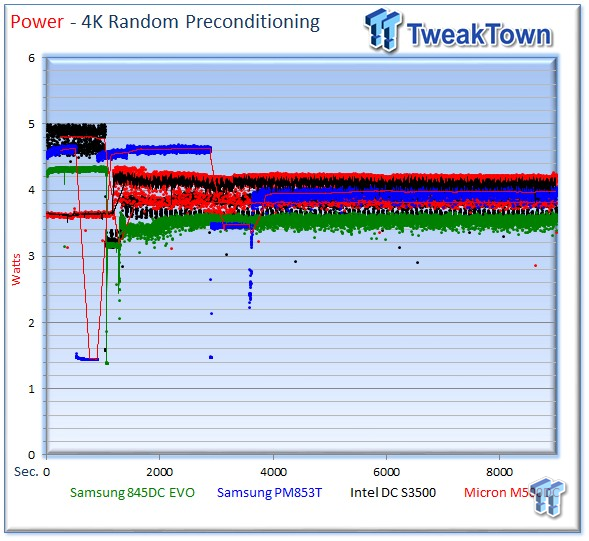
We record power consumption measurements during our precondition run. We calculate the stated average results after the device has settled into steady state during the last five minutes of the test.
It is important to note the PM853T has double the capacity of the other SSDs in the test pool. This will adversely affect its comparable power measurements due to increased componentry. Readers should also consider the watts per GB of useable capacity. The PM853T averages 3.97 watts; the 845DC EVO weighs in at 3.55 watts; the M500DC averages 4.09 watts; and the DC S3500 averages 3.8 watts during the measurement window.

IOPS-to-Watts measurements are generated from data recorded during our precondition run, and the stated average is from the last five minutes of the test.
We test power consumption and efficiency from write workloads, which is not the intended workload for low-endurance SSDs. The PM853T averages 4,774 IOPS per watt; the 845DC EVO averages 3,973 IOPS per watt; and the M500DC jumps to a big lead, averaging 9,545 IOPS per watt (due to its outstanding write performance). The DC S3500 averages 3,125 IOPS per watt.
Benchmarks - 8k Random Read/Write
8k Random Read/Write


Many server workloads rely heavily upon 8k performance, and we include this as a standard with each evaluation. Many of our server workloads also test 8k performance with various mixed read/write distributions.
The average 8K random read speed of the PM853T is 52,511 IOPS; the 845DC EVO averages 52,731 IOPS; the Micron M500DC averages 48,034 IOPS at 256 OIO; and the Intel DC S3500 measures 44,444 IOPS. The PM853T and the 845DC EVO provide impressive read speed, but do not beat the M500DC by nearly as large of a margin as observed with 4k random read activity.


The two Samsung SSDs fall within a very similar latency envelope during the measurement window.

The M500DC easily leads with an average of 23,852 IOPS; the PM853T pulls in second with 8,561 IOPS; the 845DC EVO averages 7,112 IOPS; and the DC S3500 averages 6,937 IOPS.


Once again, the M500DC distances itself from the pack during pure write workloads.

The PM853T features resilient performance in mixed random workloads.

Power consumption for the PM853T averages 3.99 watts; the 845DC EVO averages 3.54 watts; the M500DC averages 4.77 watts; and the DC S3500 averages 3.75.

The M500DC leads the efficiency test convincingly with 4,877 IOPS per watt; the PM853T pulls into second place with 2,281 IOPS per watt; the 845DC EVO averages 1,994 IOPS; and the DC S3500 averages 1,584 IOPS per watt.
Benchmarks - 128k Sequential Read/Write
128k Sequential Read/Write

128k sequential speed reflects the maximum sequential throughput of the SSD, and is indicative of performance in OLAP, batch processing, streaming, content delivery applications, and backup scenarios. The PM53T and the 845DC EVO lead the sequential read tests with a similar average of 526MB/s at 256 OIO. The Micron M500DC features the lowest sequential performance specifications of the value-SSD lineup and averages 417 MB/s, while the Intel DC S3500 delivers an average of 441 MB/s.

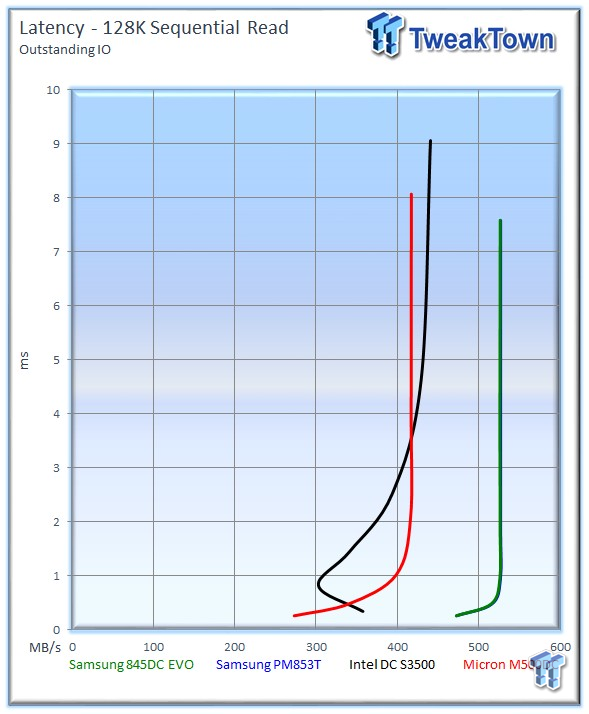
The two Samsung entrants are practically indistinguishable in sequential read latency performance.

Sequential write performance is important in tasks such as caching, replication, HPC, and database logging. The PM853T averages 416 MB/s, nudged out of first by the 845DC EVO, which averages 427 MB/s. The M500DC averages 388 MB/s, and the DC S3500 is within striking distance with 424 MB/s.
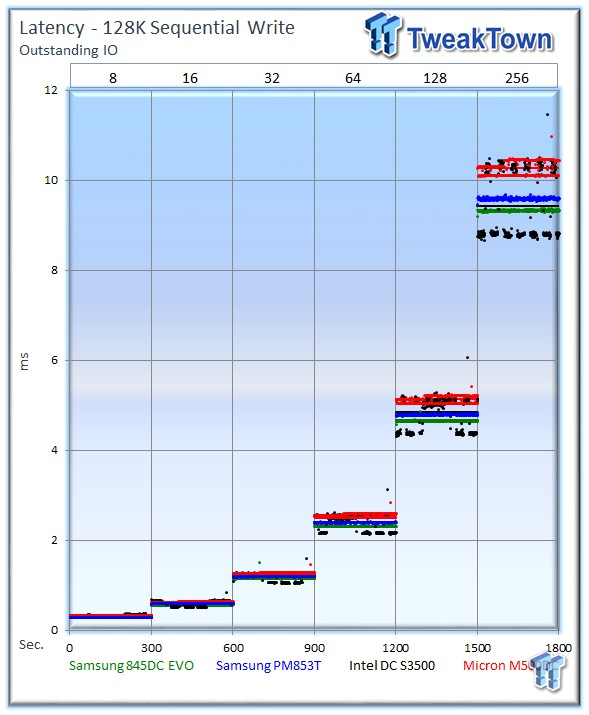

The two Samsung SSDs deliver excellent performance in this test, but the DC S3500 closes the gap with the leader at higher OIO.

The M500DC is hard to beat during the mixed sequential workload testing, but the PM853T puts forth a valiant effort, and does so with a tighter performance profile during the majority of the test.

The PM853T averages 4.59 watts; the 845 DC EVO wins with an average of 4.14 watts; the M500DC averages 5.24 watts; and the DC S3500 averages 4.83 watts.
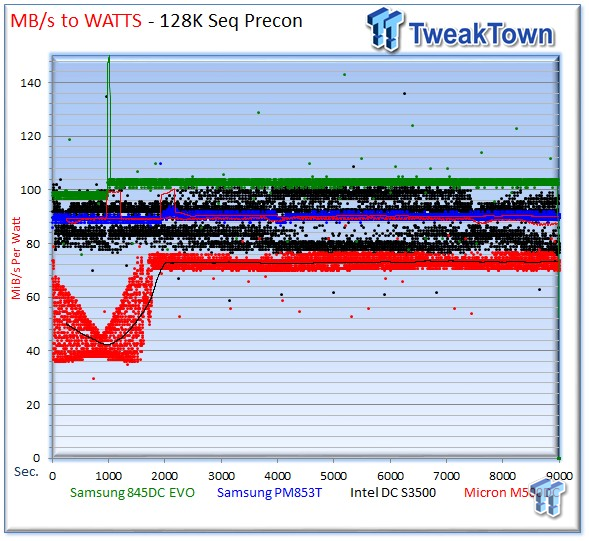
The PM853T averages 90 MB/s per watt; the 845DC EVO is the most efficient drive in sequential write environments with an average of 99 MB/s per watt; the M500DC averages 73 MB/s per watt; and the DC S3500 averages 87 MB/s per watt.
Benchmarks - Database/OLTP and Web Server
Database/OLTP

This test consists of Database and On-Line Transaction Processing (OLTP) workloads. OLTP is the processing of transactions such as credit cards and high frequency trading in the financial sector. Databases are the bread and butter of many enterprise deployments. These demanding 8k random workloads with a 66 percent read and 33 percent write distribution bring even the best solutions down to earth.
The Samsung PM853T averages 21,842 IOPS at 256 OIO; the 845DC EVO has a very consistent average of 19,678 IOPS at 256 OIO; the Micron M500DC tops the chart with an average of 21,133 IOPS, but experiences significant variability; and the Intel DC S3500 averages 19,400 IOPS at 256 OIO. The Samsung SSDs come in slightly lower than the M500DC, but with very consistent performance.

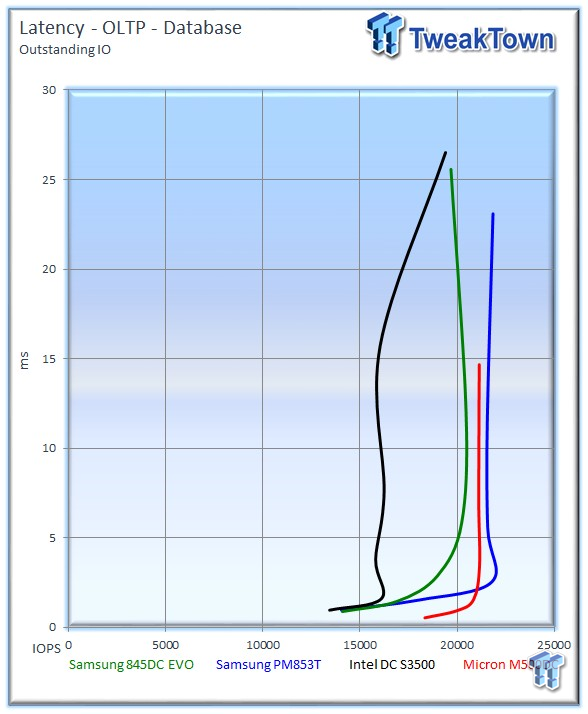
The PM853T leads the field in latency testing, pulling off the rare feat of delivering lower latency during lower IOPS performance.

The PM853T averages 3.85 watts; the 845DC EVO averages 3.55 watts; the M500DC averages 2.76 watts; and the DC S3500 averages 3.76 watts.

The PM853T averages 5,979 IOPS per watt; the 845DC EVO averages 5,465 IOPS per watt; the M500DC averages 7,676 IOPS per watt; and the DC S3500 averages 4,040 IOPS per watt.
Web Server


The Web Server workload is read-only with a wide range of file sizes. Web servers are responsible for generating content users view over the Internet, much like the very page you are reading. The speed of the underlying storage system has a massive impact on the speed and responsiveness of the server hosting the website.
The PM853T averages 28,207 IOPS, and the 845DC EVO averages a similar 28,054 IOPS at 256 OIO. The M500DC averages 18,650 IOPS, falling to the DC S3500 average of 23,664 IOPS.


The Samsung SSDs deliver great performance in this read-centric workload.

The PM853T averages 3.94 watts; the 845DC EVO averages 3.55 watts; the M500DC averages 3.21 watts; and the DC S3500 requires 3.8 watts during the fileserver workload.

The PM853T averages 1,082 IOPS per watt. The 845DC EVO scores M500DC scores 1,965 IOPS per watt, compared to 749 IOPS for the DC S3500.
Benchmarks - Email Server
Email Server


The email server workload is a demanding 8K test with a 50% read and 50% write distribution. This application is indicative of the performance in heavy write workloads.
The PM853T averages 15,625 IOPS, pulling off a stunning display of power in this heavy write workload. For a read centric SSD, it delivers excellent performance. The 845DC EVO averages 14,041 IOPS, and the Micron M500DC averages 15,403 IOPS. The Intel DC S3500 averages 13,121 IOPS at 256 OIO.


The PM853T amazes, with superb performance in this heavy write workload.

The PM853T averages 3.92 watts; the 845DC EVO averages 3.54 watts; the M500DC averages 2.66 watts; and the DC S3500 averages 1.75 watts.

The PM853T averages an impressive 4,244 IOPS per watt; the 845DC EVO averages 3,815 IOPS per watt, the M500DC averages 5,806 IOPS per watt; and the DC S3500 scores 6,705 IOPS per watt.
Final Thoughts
Samsung has blazed the trail for 3-bit MLC, more commonly referred to as TLC, into the datacenter with the PM853T. The retail-branded 845DC EVO also features 3-bit MLC, and both SSDs have done much to dispel initial concerns about the performance and longevity of 3-bit MLC SSDs. When it comes to endurance, users aren't as concerned with the underlying media; at the end of the day, it all comes down to the TBW (Terabytes Written) specifications of the competing solutions. Price is always a big concern in any environment, and 3-bit MLC offers a solid platform for the most cost-effective solutions in the datacenter.
Samsung addresses concerns about 3-bit NAND longevity with a standard warranty period and clear communication of endurance metrics. Users should know their workload, and for those with read-centric applications, the 845DC EVO presents a compelling value offering.
The PM853T exhibits similar performance to the retail-branded version, the 845DC EVO, but delivers a boost in performance in heavy random write environments. Some of this boost is attributable to the higher capacity point, but also denotes firmware optimizations for heavier workloads. The PM853T pulled ahead of the competition, with the notable exception of the M500DC, in the pure random write 4k and 8k workloads. The incremental performance increase also extended into our mixed random workload testing, where it once again trailed only the M500DC.
One of the most redeeming qualities of both the PM853T and the 845DC EVO is their blistering performance in random read workloads. The performance advantage over competing solutions is large, and with the PM853T's designation for read-centric applications, a healthy advantage in read performance is a big win.
Power consumption metrics were competitive with competing products, which is an impressive feat in light of the 960GB capacity of our test sample. The other SSDs in the test pool are all 480GB, resulting in a power consumption advantage with fewer components. The PM853T provides excellent power-sipping performance from a watts per GB standpoint, and its efficiency metrics were competitive.
Sequential read and write performance of the PM853T are very impressive, topping the test pool and only challenged by the 845DC EVO. The M500DC took over during the mixed sequential testing, but the PM853T had a more consistent performance profile, which is useful in RAID environments. During our server workloads, the PM853T also provided solid performance consistency, in particular during the OLTP workload. The most impressive feat was its large win in the 50/50 read/write workload during the email tests; this type of performance isn't typically encountered with a read-centric SSD. The PM853T also leveraged its superior random read performance to lead the test pool during the read-centric webserver test.
The PM853T features incrementally lower specifications in several areas in comparison to the 845DC EVO, but offers plenty of performance and enterprise-class features at an extremely competitive price point for the OEM space. Power fail protection and enterprise-grade firmware offer a measure of data safety, and the three-year warranty is standard for OEM applications. With extensive deployments, and having passed through many qual cycles, the PM853T offers a compelling mix of price, reliability, features, and performance for Samsung's OEM customers.
 Micron 6600 ION 245.76TB Enterprise SSD Review - Best in Class Programming Speeds
 Memblaze PBlaze 7 7A40 Ocean 61.44TB Enterprise SSD Review - Oceans of QLC at 3.3 million IOPS
 KIOXIA CD9P-R 7.68TB E3.S Review - The Best-In-Class Data Center SSD
 DapuStor Roealsen6 R6060 E1.L 245.76TB SSD Review - Massive Capacity with Fast Retrieval
 Phison Pascari X200P 7.68TB Enterprise SSD Review - Sequential Read Champion
 The Mac Pro nearly got a chip twice as powerful as the M3 Ultra and a new Intel model, until Apple cancelled both
 LG monitors are silently installing spyware on Windows 11 PCs without user consent
 China just had another DeepSeek moment, and its new AI model is rattling global markets
 Man sues JPMorgan for approving mortgage on $5.5m mansion headed for the sea
 Amazon confirms some customers are waking up to billion-dollar bills for cloud services they didn't use
 Mexican government put PlayStation in its crosshairs over physical disk phase out
 Uber Eats deliveries bust scammer who stole $200,000+ through Steam games
 NVIDIA RTX Spark 'Developer Preview' driver lets devs get their apps ready for the new Windows on Arm devices
 One of NVIDIA CEO Jensen Huang's leather jackets sells for close to $1 million at a charity auction
 AMD 'Medusa Point' APU benchmarks show that Zen 6 is impressively fast in a mobile chip
 SteelSeries Arctis Nova Pro Omni Wireless Headset Review - One Headset to Rule Them All
 SteelSeries Arctis Nova 7 Wireless Gen 2 Headset Review - New and Improved, But Is It Enough?
 AMD Ryzen 7 7700X3D Review - Days of Future Past
 Samsung 990 2TB SSD Review - Ninth Gen QLC at PCIe Gen4 Speeds
 ASUS ExpertBook Ultra (Panther Lake) 14" Business Laptop Review
 ASUS ROG Raikiri II Xbox Wireless Controller Review - Ready to Take Control
 MOZA FMP18 Panel Bundle Review: authentic F/A-18 Hornet cockpit controls for flight sims
 MOZA MA3F EFCM Flight Control Module Review: authentic Airbus A320 autopilot panel for simulators
 Turtle Beach Stealth Pro II Wireless Gaming Headset Review - Premium Sound, Fantastic Features
 I use this decade-old free tool that finds files faster than Windows Search does
 I install and update most of my apps with this Windows command now, and I stopped downloading sketchy installers
 Hisense U6SF 65-inch MiniLED TV: High Performance Meets Leisurely Convenience
 I stopped digging through Windows menus after I set up this one folder
 Don't sell your Windows laptop until you do these things
 6 PC cleaning mistakes to avoid for safer hardware maintenance
 Phison and Intel Take Aim at Local AI's Memory Wall with aiDAPTIV
 How to Remap Keyboard Keys in Windows using Microsoft PowerToys
 7 tips to organize your Windows files for faster, easier access
 Intel Arc G3 Extreme first impressions with MSI's Claw 8 EX AI+ - Incredible power for an extreme price