


Our Verdict
Pros
- Pricing
- Throughput
- Cool running
Cons
- Write performance
Should you buy it?
Introduction & Drive Details
Orico is a brand that you may not have heard of before as they are big in Asia, but rarely encountered in the Americas. The Shenzhen China based company specializes in solid-state storage solutions and accessories, with products including SSDs, disk enclosures, NAS, portable SSDs, and countless other related items.
The O7000 is the company's value targeted PCIe Gen4 SSD with which they are looking to grow their brand in the Americas. The drive features a controller/NAND combination that we are familiar with - Maxio 1602A and YMTC 232L 2,400 MT QLC flash. The last time we encountered this exact hardware configuration was when we reviewed the Biwin made HP FX700 back in February 2024.
This exact hardware configuration single-handedly changed our preconceived notion that QLC sucks and should be avoided. This new generation of high-speed QLC flash offers performance comparable to that of TLC while at the same time delivering an unbeatable value proposition. How does 5 cents per gigabyte of fast NVMe storage sound? Sounds like a bargain to us.
Orico's O7000 can deliver up to 7,200 MB/s throughput for your PC, and over 6,500 MB/s of read performance for your PlayStation 5 when employed as fast internal storage expansion. The drive is cool running with no need for out of the ordinary cooling - any motherboard heatsink will do the job quite nicely.
Now, let's get into this review so we can show you firsthand what Orico's O7000 1TB SSD can do for you by the numbers.
Drive Details
| Item | Details |
|---|---|
| Model | Orico O7000 1TB |
| MSRP | $70 |
| Model Number | CSSD-F1000GBMP700ENH |
| Interface | PCIe Gen4 |
| Form Factor | M.2 2280 |
| Performance | Up to 7,000 MB/s |
| Warranty | 5-Years Limited |

Best Deals: ORICO O7000 NVMe SSD PCIe 4.0 1TB


The drive is a preferred single-sided design, so it fits in places where double-sided SSDs might not. Additionally, Orico includes an optional aluminum "Cooling Vest & Heatsink".
Jon's Test System Specifications
Intel Test System
Our Latest SSD Review Coverage
- Samsung 990 2TB SSD Review - Ninth Gen QLC at PCIe Gen4 Speeds
- Phison E37T SSD Controller Exclusive Preview - The Fastest DRAMless SSD Platform Yet
- Seagate FireCuda X1070 4TB SSD Review - A New Mainstream Contender
- Micron 3610 2TB SSD Review - DRAMless QLC at 11,000 MB/s
- SK hynix Platinum P51 2TB SSD Review - A Powerful Gen5 Alternative
| Item | Details |
|---|---|
| Motherboard | ASUS Z890 Apex (Buy at Amazon) |
| CPU | Intel Core Ultra 9 285K (Buy at Amazon) |
| GPU | MSI SUPRIM X RTX 3080 12GB (Buy at Amazon) |
| Cooler | Alphacool Eissturm Hurricane Copper 45 (Buy at Amazon) |
| RAM | Patriot Viper Xtreme 5 8000 48GB (Buy at Amazon) |
| Power Supply | be quiet! Dark Power Pro 12 1200W (Buy at Amazon) |
| Case | PrimoChill's Praxis Wetbench (Buy at Amazon) |
| OS | Microsoft Windows 11 Pro (Buy at Amazon) |
AMD Test System
| Item | Details |
|---|---|
| Motherboard | GIGABYTE X870E AORUS Master (Buy at Amazon) |
| CPU | AMD Ryzen 9 9950X (Buy at Amazon) |
| GPU | MSI SUPRIM X RTX 3080 12GB (Buy at Amazon) |
| Cooler | Alphacool Eissturm Hurricane Copper 45 (Buy at Amazon) |
| RAM | Sabrent Rocket DDR5 32GB (Buy at Amazon) |
| Power Supply | be quiet! Dark Power Pro 12 1200W (Buy at Amazon) |
| Case | PrimoChill's Praxis Wetbench (Buy at Amazon) |
| OS | Microsoft Windows 11 Pro (Buy at Amazon) |
Because we at TweakTown like to be first at everything whenever we can, we will present our storage performance results for the test subject on both Intel Core Ultra 200 Series and 9000 Series AMD platforms going forward for the foreseeable future. Because Intel still delivers the best real-world storage performance, our running chart will continue to be Intel-based until AMD can deliver better real-world storage performance than its rival.
Please note that we have completely retested all the 50 SSDs that comprise our comparison products with our new Intel Ultra Core 9 285K test platform. Results going forward cannot be compared with our previous 14th Gen Intel results or previous AMD results, as we've updated there as well. We believe it is important to keep our platforms current in terms of the latest hardware and operating system versions. We have also updated our OS to Windows 11 Pro 24H2. Overall, the pecking order has remained the same, at roughly 5% lower real-world performance than before.
Sony PlayStation 5 - M.2 Storage Expansion
PS5 Read Performance
With Sony's wildly popular PlayStation 5 console now enabled for M.2 NVMe SSDs to be used as fast storage expansion, we are including results for PS5-compatible SSDs we test as a part of our reviews going forward.


For SSDs that don't have an adequately sized PS5 compatible heatsink or other SSDs where the heatsink provided doesn't fit right and can be removed, we both use and recommend Sabrent's unparalleled PS5 heatsink available HERE.


We only chart SSDs that can deliver a minimum of 5,500 MB/s read, which is Sony's original recommendation.
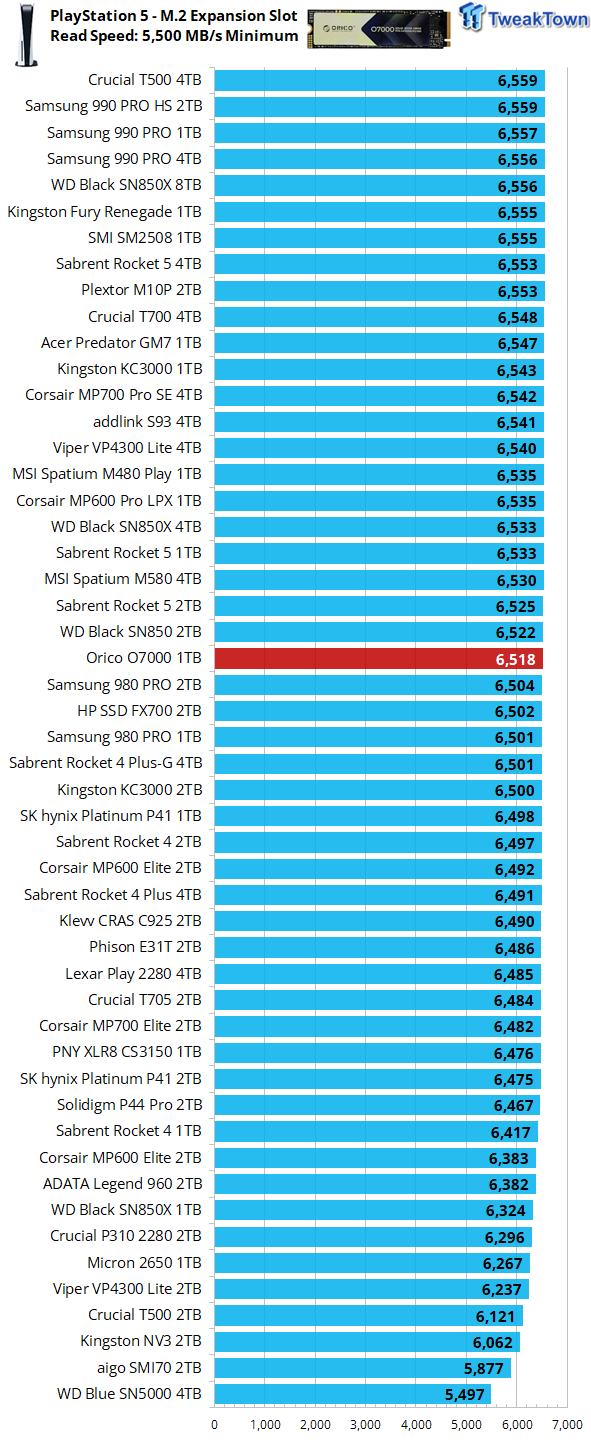
Orico's O7000 1TB can be an excellent choice for PS5 M.2 storage expansion. Not only does it deliver more than enough read throughput to serve competently, but its power efficiency and thermal characteristics bode well for this implementation.
Synthetic Benchmarks: CDM, Max IOPS, ATTO
CrystalDiskMark

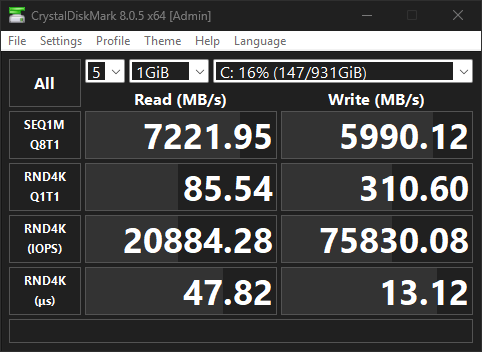
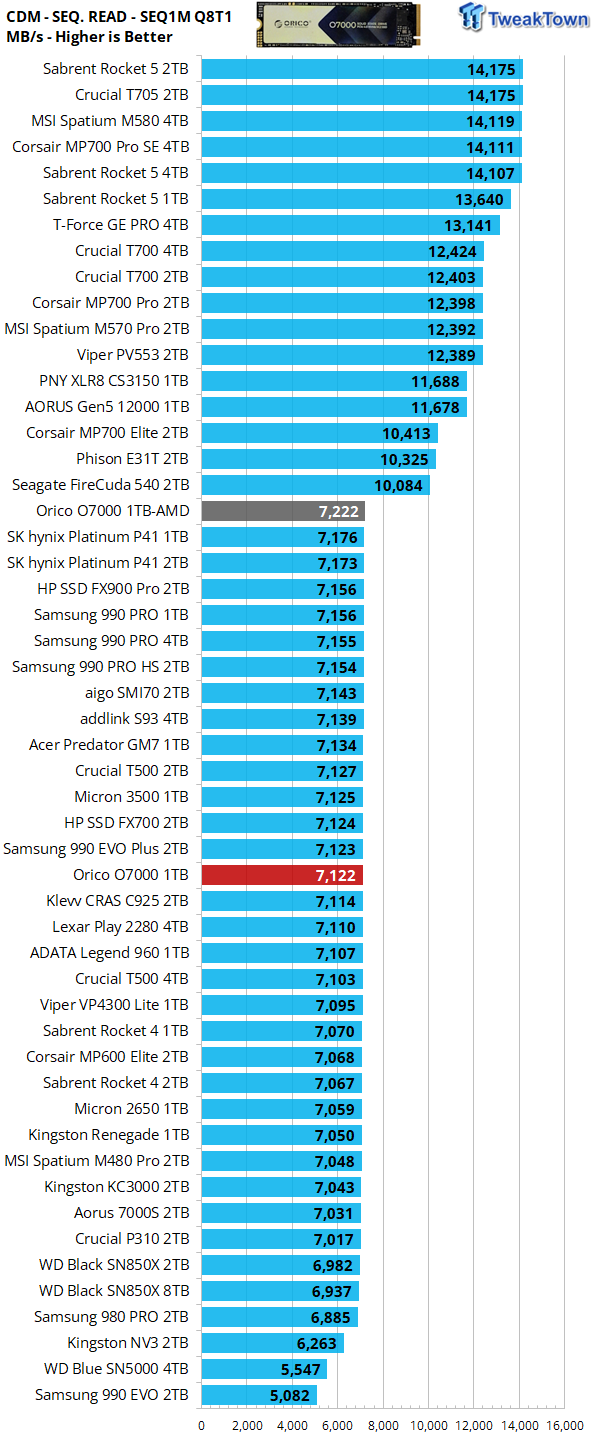
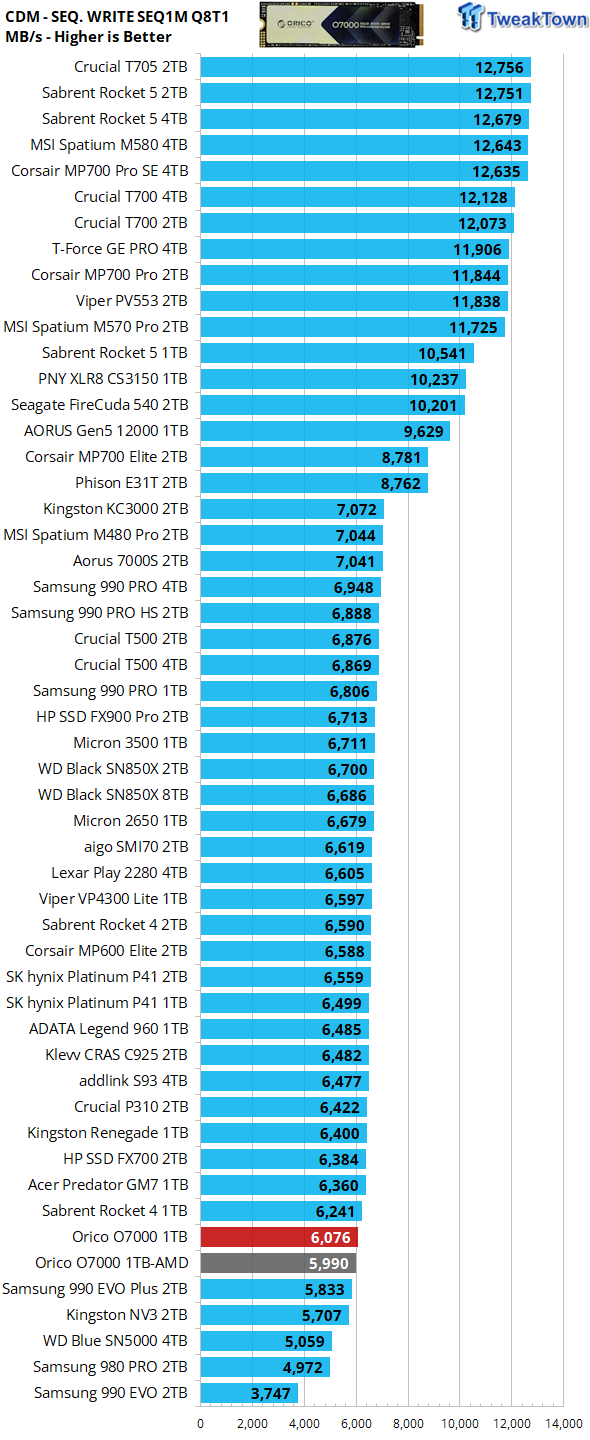
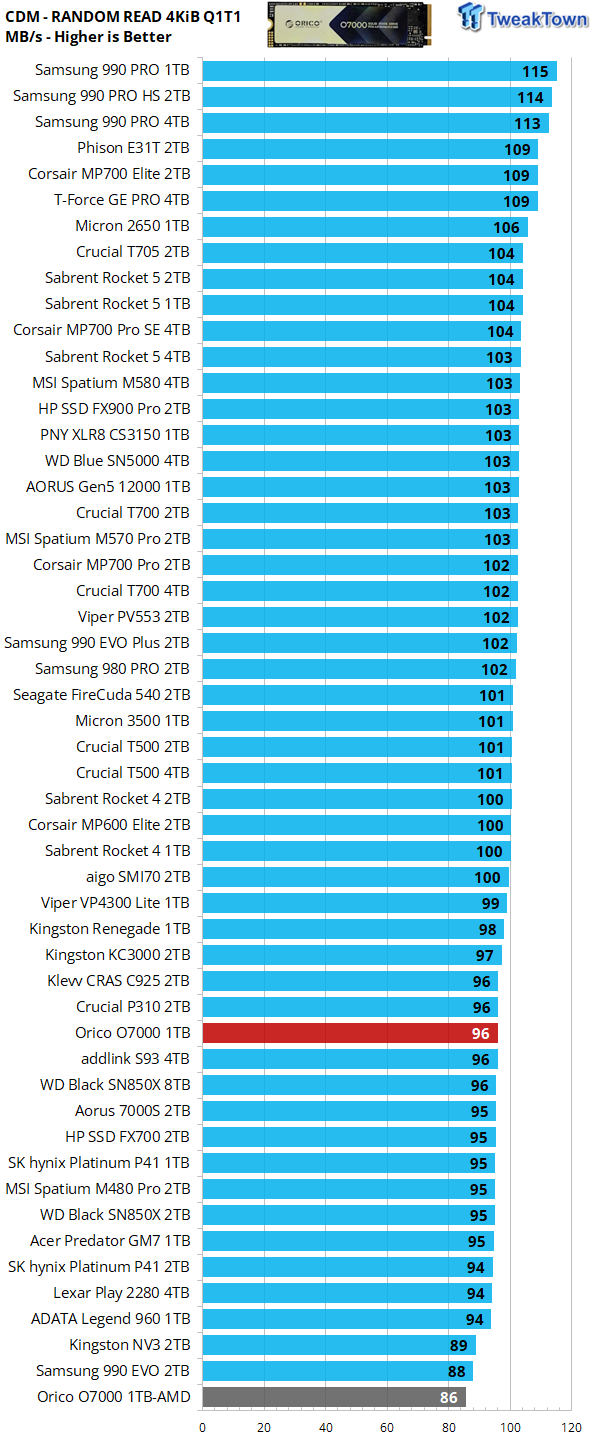
We employ CDM as our standard measurement for both sequential throughput and Q1T1 random read. In terms of sequential throughput, we find our test subject capable of easily exceeding quoted up-to-factory sequential read throughput specifications. Sequential write throughput falls short of the quoted up to 6,500 MB/s. Q1T1 random read performance is exceptional for a QLC arrayed SSD.
Max IOPS
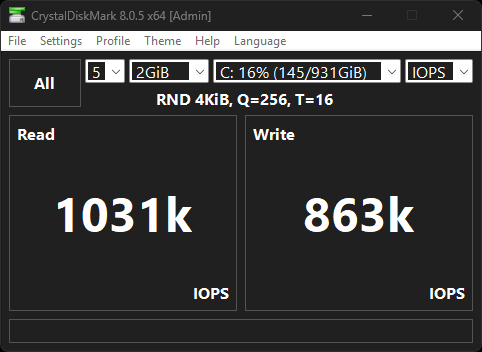
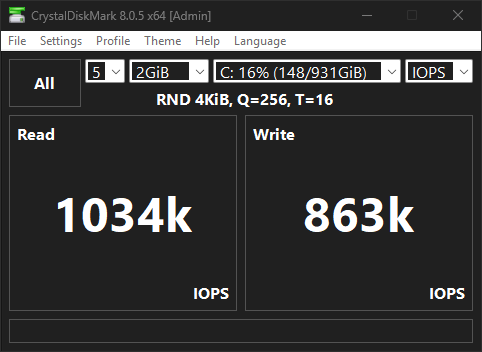
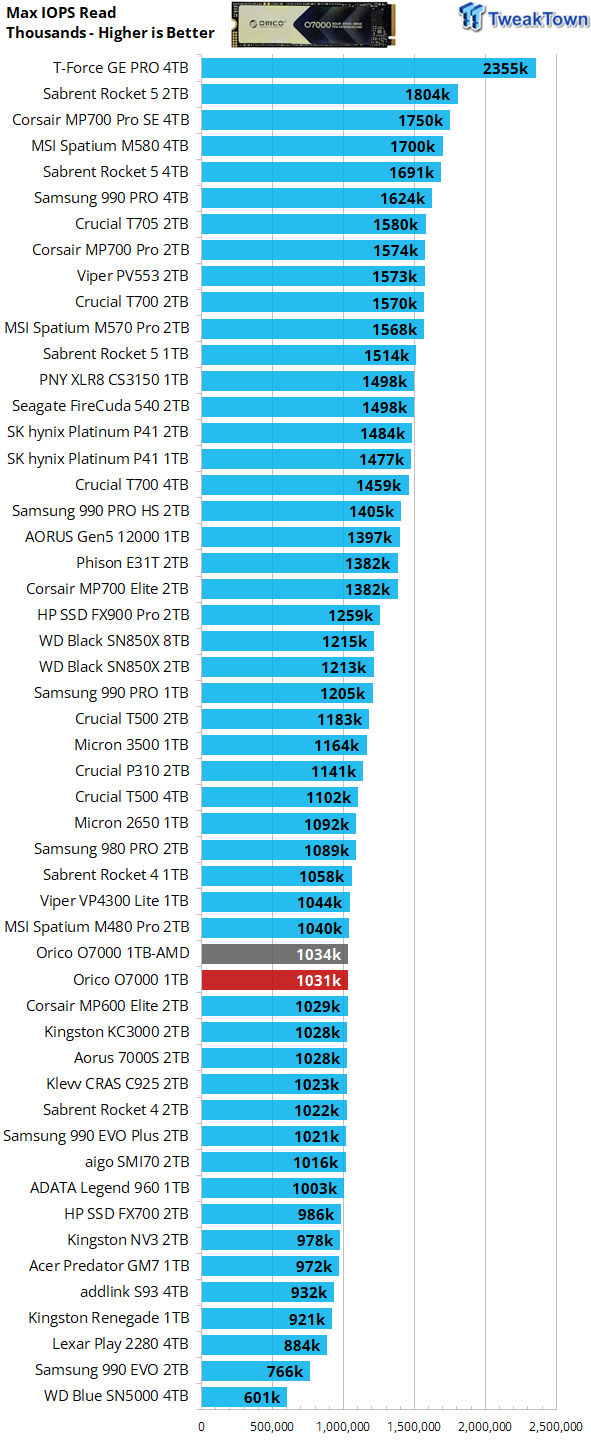
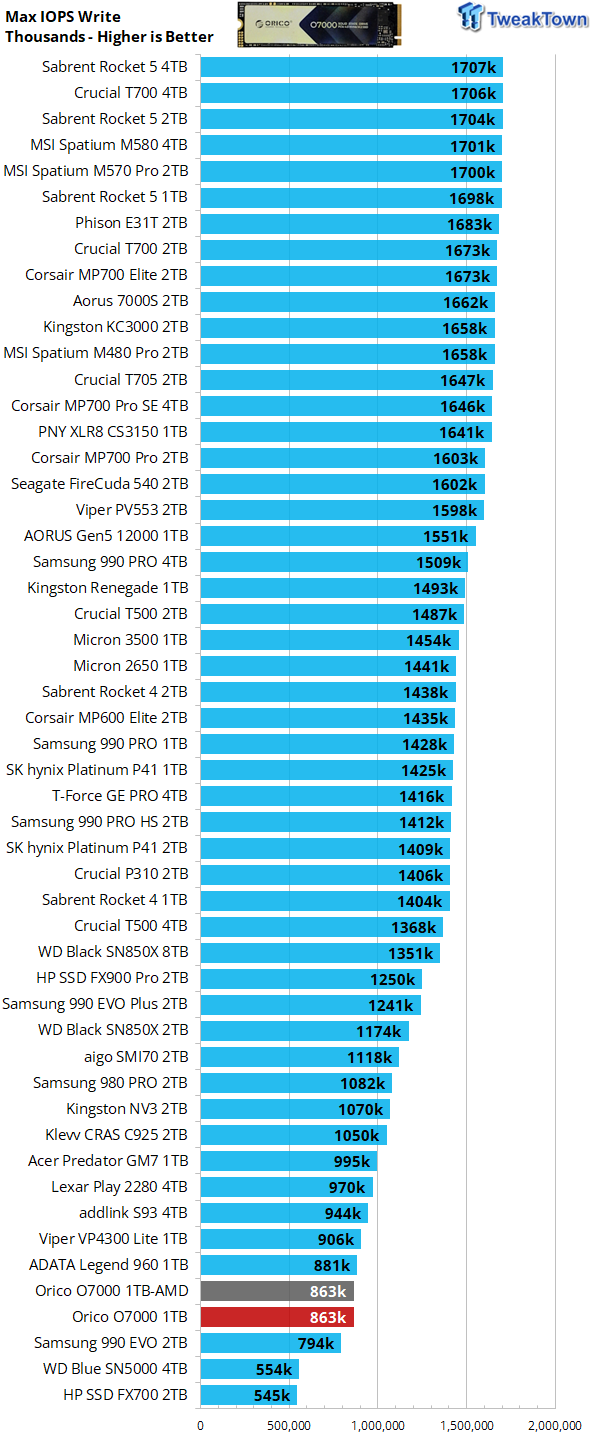
The O7000 1TB is factory spec'd for up to 1000k random read IOPS and up to 800k random write IOPS. We have no issue exceeding those numbers. Excellent.
ATTO
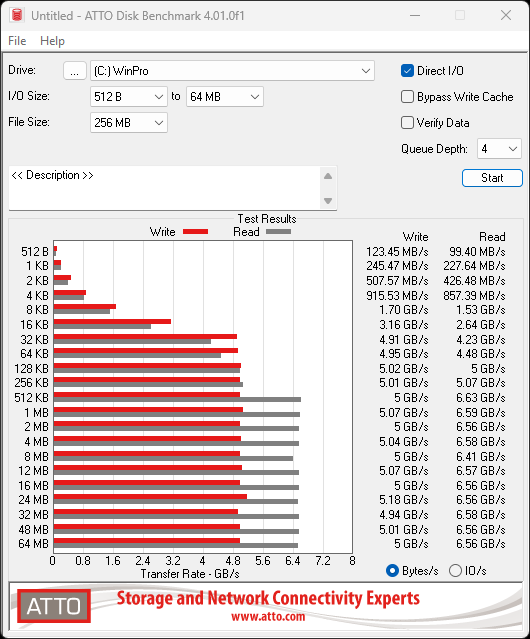
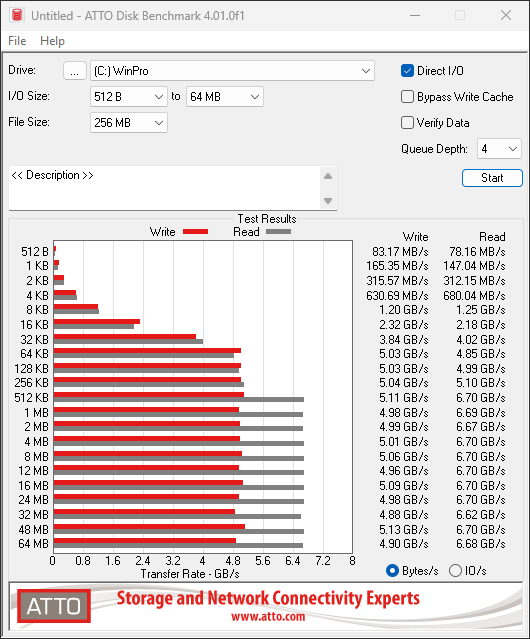
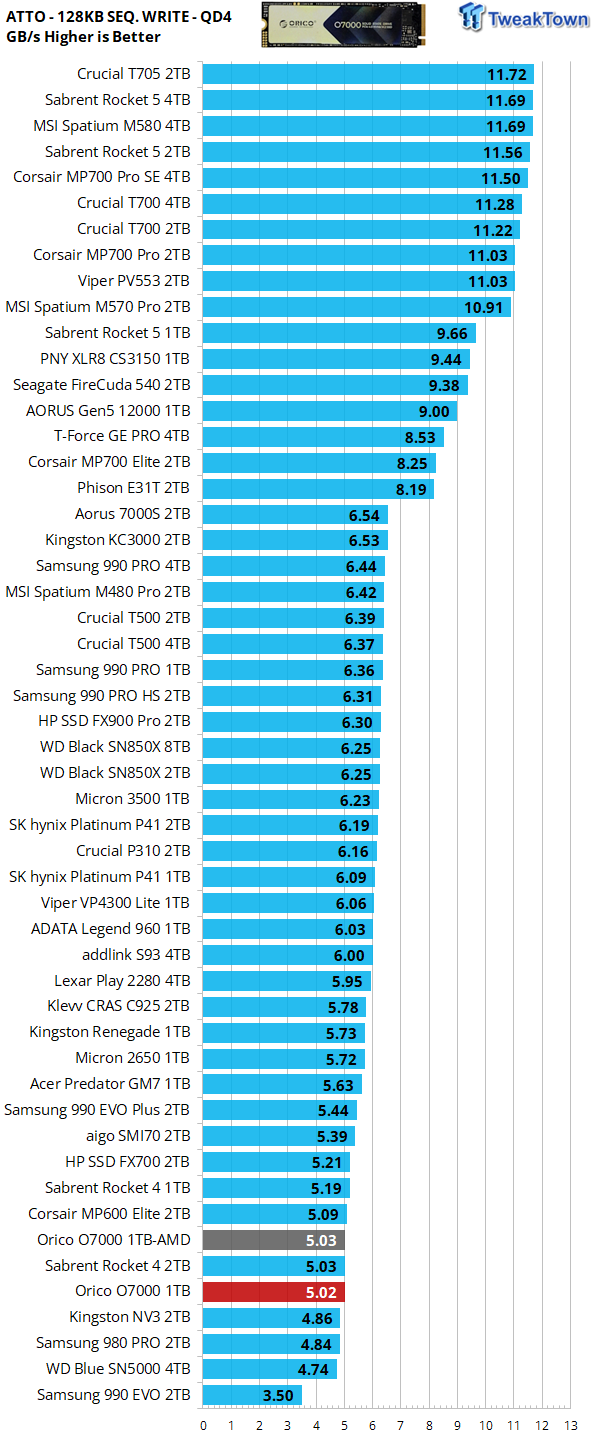
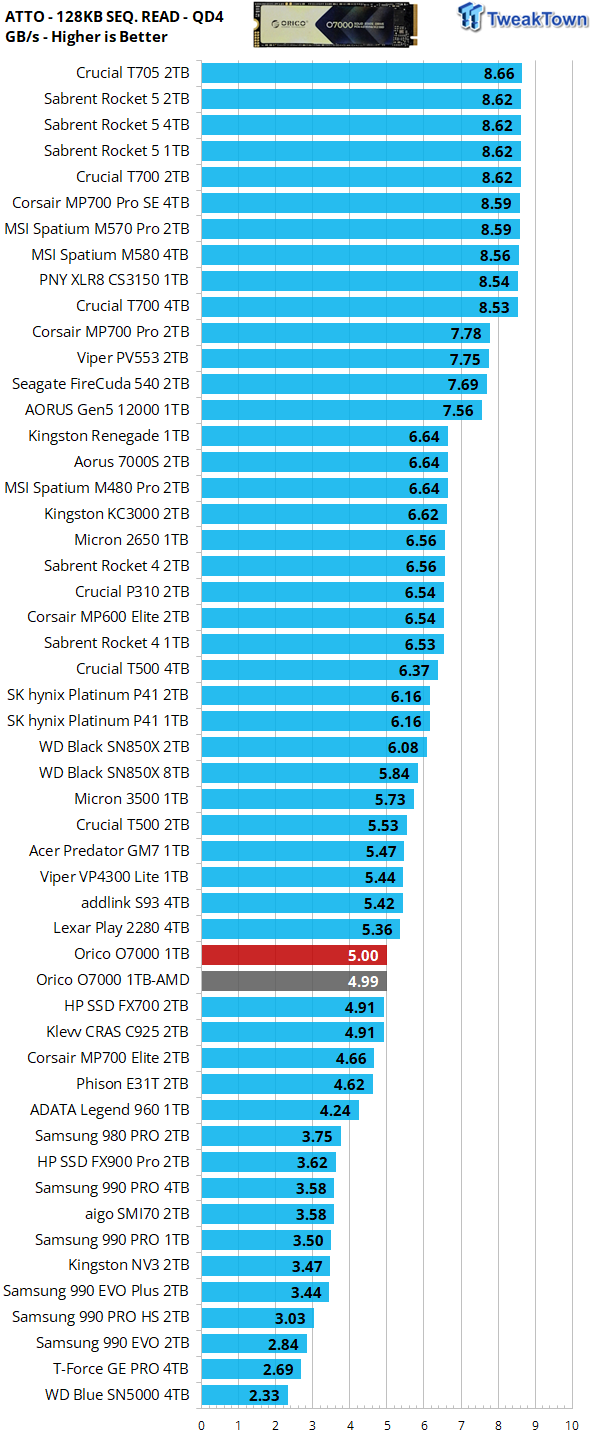
ATTO gives us a clear picture of what transfer sizes a particular SSD favors in terms of QD4 sequential throughput. We chart 128K transfers. At a queue depth of four, the O7000 1TB favors sequential transfers of 512KB or larger when serving data to the host (reading) and 32KB or larger when programming (writing) data.
Real-World Testing: Transfers, 3DMark SSD Gaming Test, PCM10 Storage
Transfer Rates
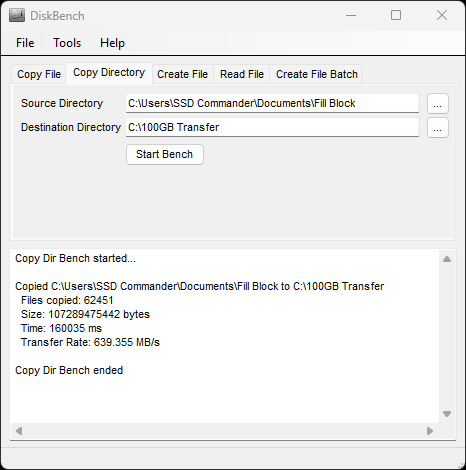

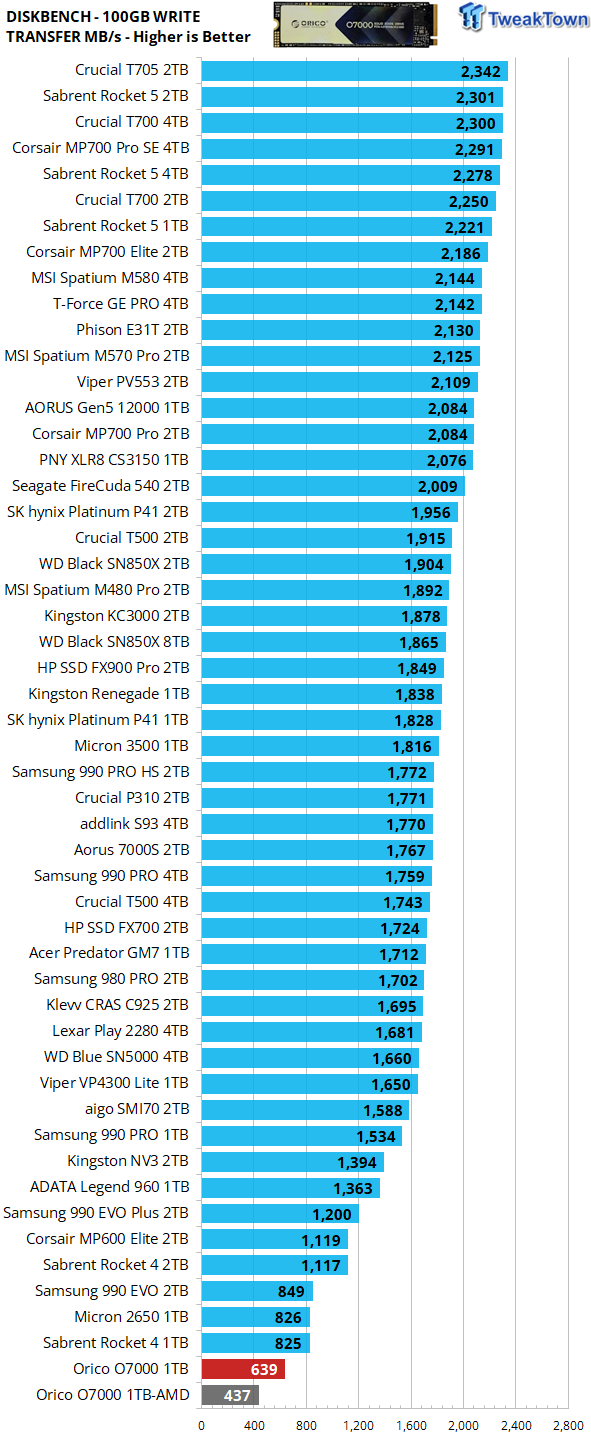
Our 100GB data transfer test is not your ordinary 100GB of data; ours is a crushing mix composed of more than 62K files. Write performance, random or sequential, is an infrequent operation, and as such, we do not consider it to be an important performance metric in the consumer space. An example being how many times is a game installed vs. how many times it's played. Our transfer test is just too big to be masked by the drive's SLC cache resulting in the worst transfer rate we've encountered to date for a modern NVMe SSD.
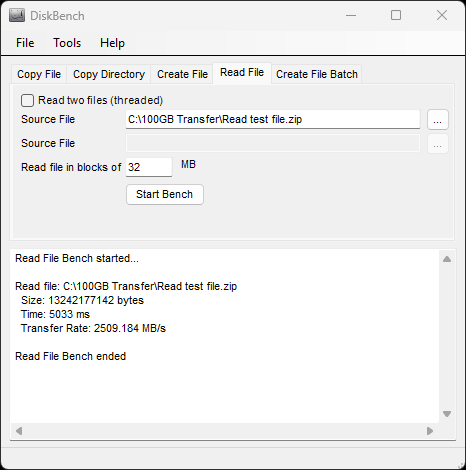
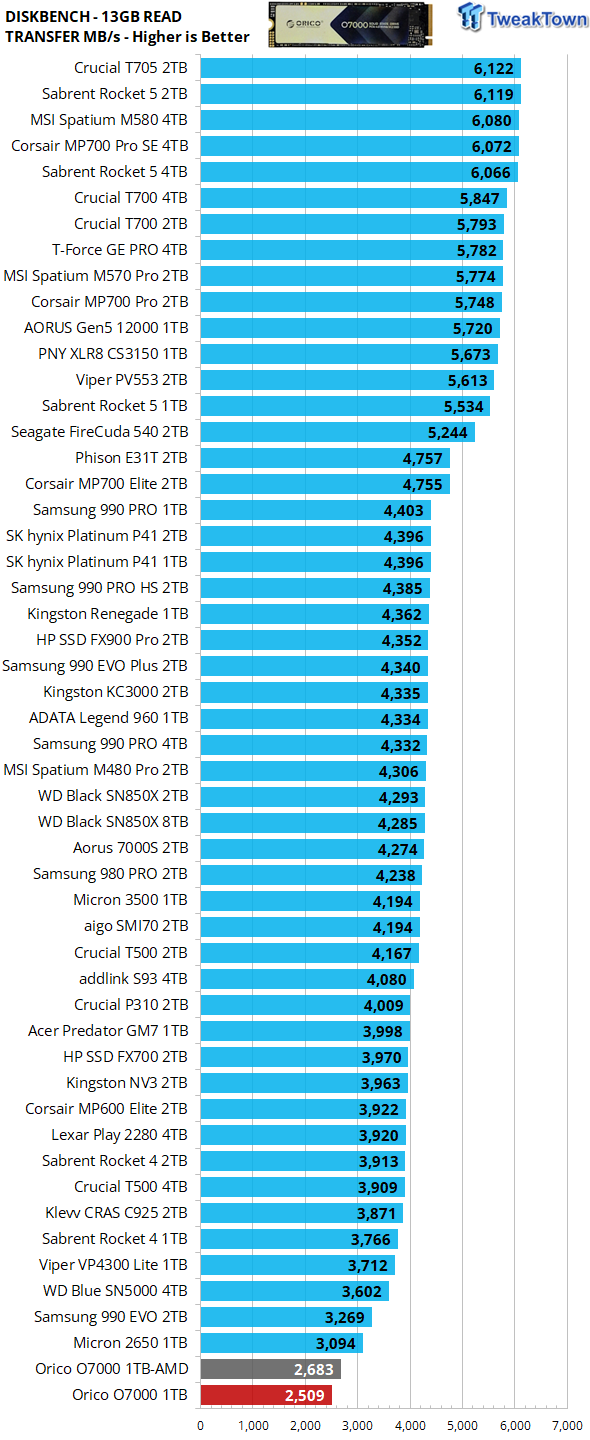
Unlike programming (writing) data, serving data to the host (reading) is typically an important performance metric as it relates to the consumer space. Here again, we find our test subject to be slower than anything of its kind we've come across in recent times.
3DMark SSD Gaming Test
UL's newest 3DMark SSD Gaming Test is the most comprehensive SSD gaming test ever devised. We consider it superior to testing against games themselves because, as a trace, it is much more consistent than variations that will occur between runs on the actual game itself. This test is the same as running the actual game, just without the inconsistencies inherent to application testing. In short, we believe that this is the world's best way to test an SSDs gaming prowess and accurately compare it against competing SSDs. The 3DMark SSD Gaming Test measures and scores the following:
- Loading Battlefield V from launch to the main menu.
- Loading Call of Duty Black Ops 4 from launch to the main menu.
- Loading Overwatch from launch to the main menu.
- Recording a 1080p gameplay video at 60 FPS with OBS (Open Broadcaster Software) while playing Overwatch.
- Installing The Outer Worlds from the Epic Games Launcher.
- Saving game progress in The Outer Worlds.
- Copying the Steam folder for Counter-Strike Global Offensive from an external SSD to the system drive.


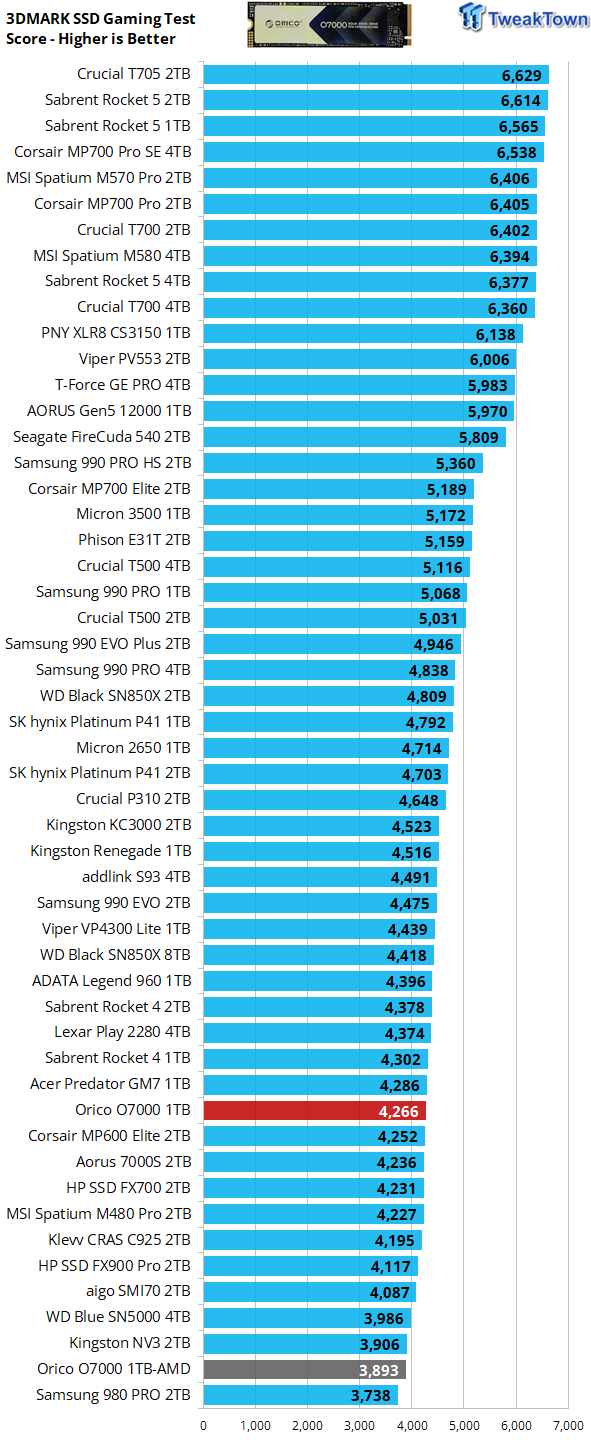
Gaming is a performance metric that matters to most DIY consumers, especially for the enthusiast crowd that TweakTown caters to. Now we've reached the point where results start to matter as they are a direct reflection of user experience.
A score of 4,266 lands our test subject ahead of most of the competition in its class - including the identically configured HP FX700. Impressive.
PCM10 Storage Tests
PCMark 10 Storage Test is the most advanced and most accurate real-world consumer storage test ever made. There are four different tests you can choose from; we run two of them. The Full System Drive Benchmark and the Quick System Drive Benchmark. The Full System Drive Benchmark writes 204 GB of data over the duration of the test. These tests directly correlate with mainstream user experience.
PCMark 10 Full System Drive Benchmark
This test writes 204GB of data covering a broad range of common consumer tasks, including booting Windows 10, file transfers, Adobe and Office applications, and startup times for games such as Battlefield V, COD Black Ops 4, and Overwatch. Unlike synthetic numbers, this is comprehensive real-world data, which is why we use it to rank SSDs in terms of user experience.


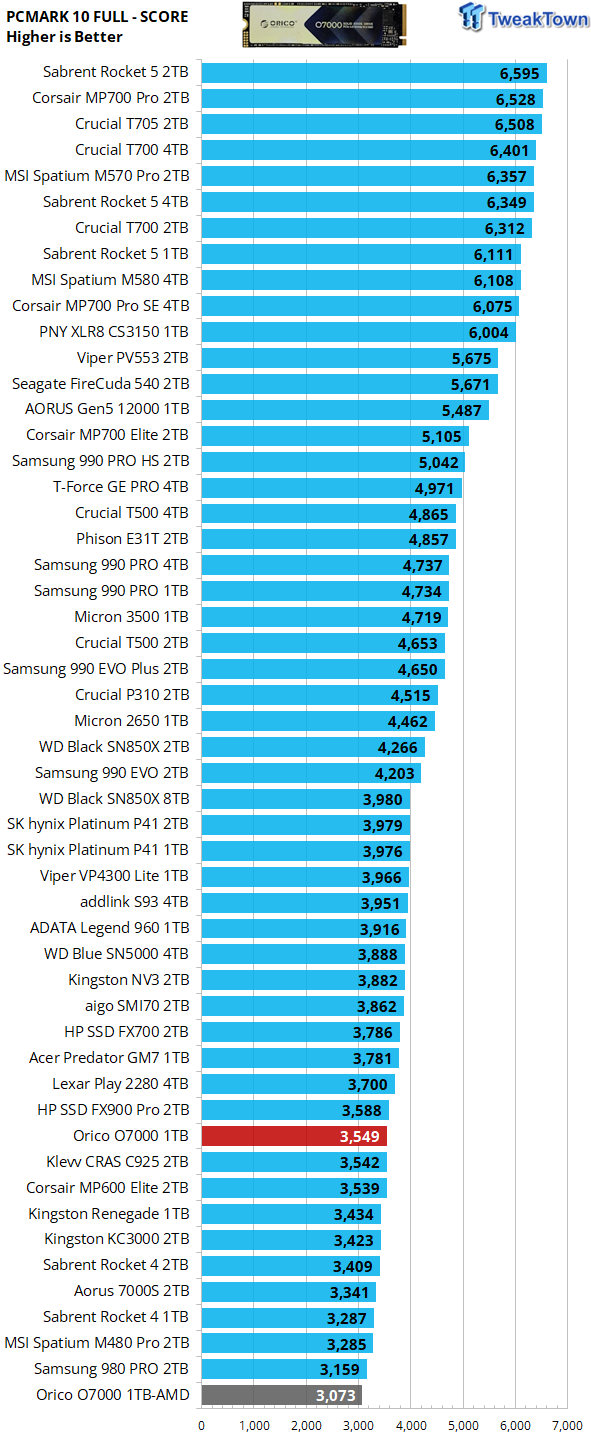
The O7000 1TB manages to outperform the Maxio 1602A controlled, TCL arrayed CRAS C925 here. Additionally, it can outperform all E18 controlled SSDs and even the 980 Pro.
PCMark 10 Quick System Drive Benchmark
The Quick System Drive Benchmark writes 23 GB of data over the duration of the test.


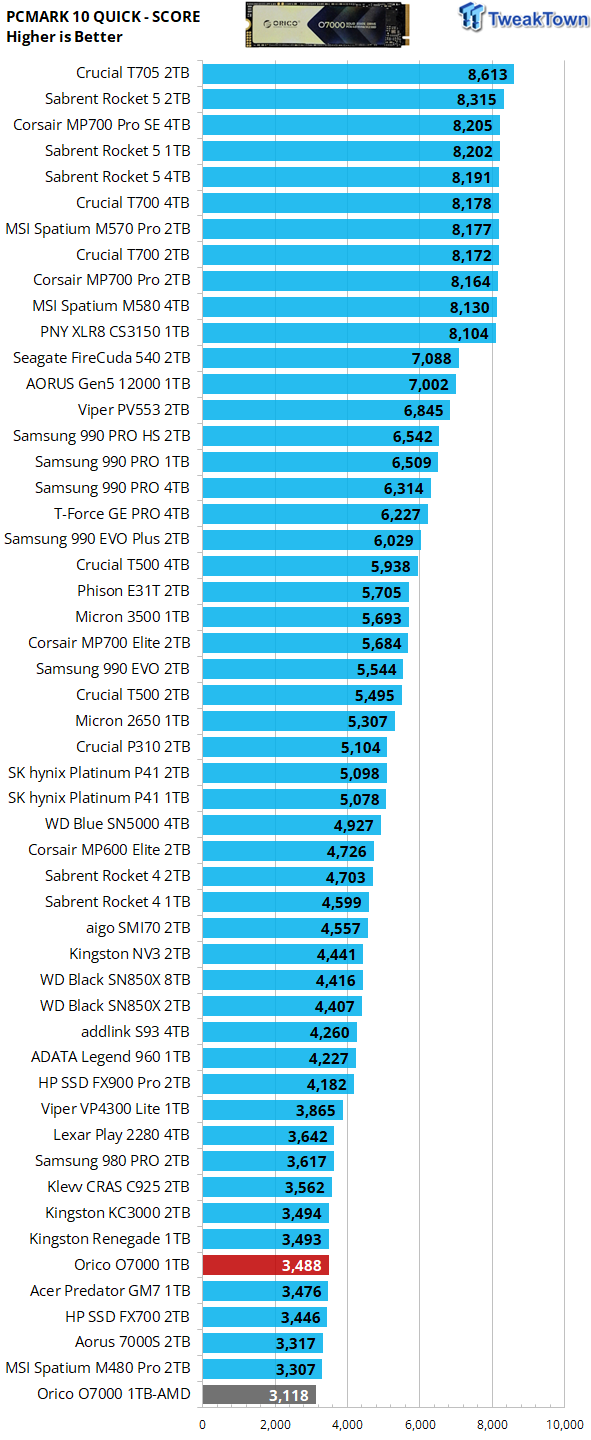
Of all the benchmarks we run, it can be argued that this one offers the best reflection of a typical consumer use case scenario. Although landing near the bottom of this chart, our 1TB test subject is still outperforming the identically configured FX700 2TB and the MAP1602A controlled, TLC arrayed Predator GM7.
Final Thoughts
Overall, the Orico O7000 1TB has a lot to offer at 5.5 cents per gigabyte. The drive performs almost identically to the TLC-arrayed Predator GM7 and does so for a better price. The Chinese-made drive can deliver better than most far more expensive E18-controlled SSDs and even significantly better than Samsung's all-time favorite, the 980 Pro. The only real negative we have with the drive is its unexpectedly low transfer rates, but we don't consider that to be a deal breaker.
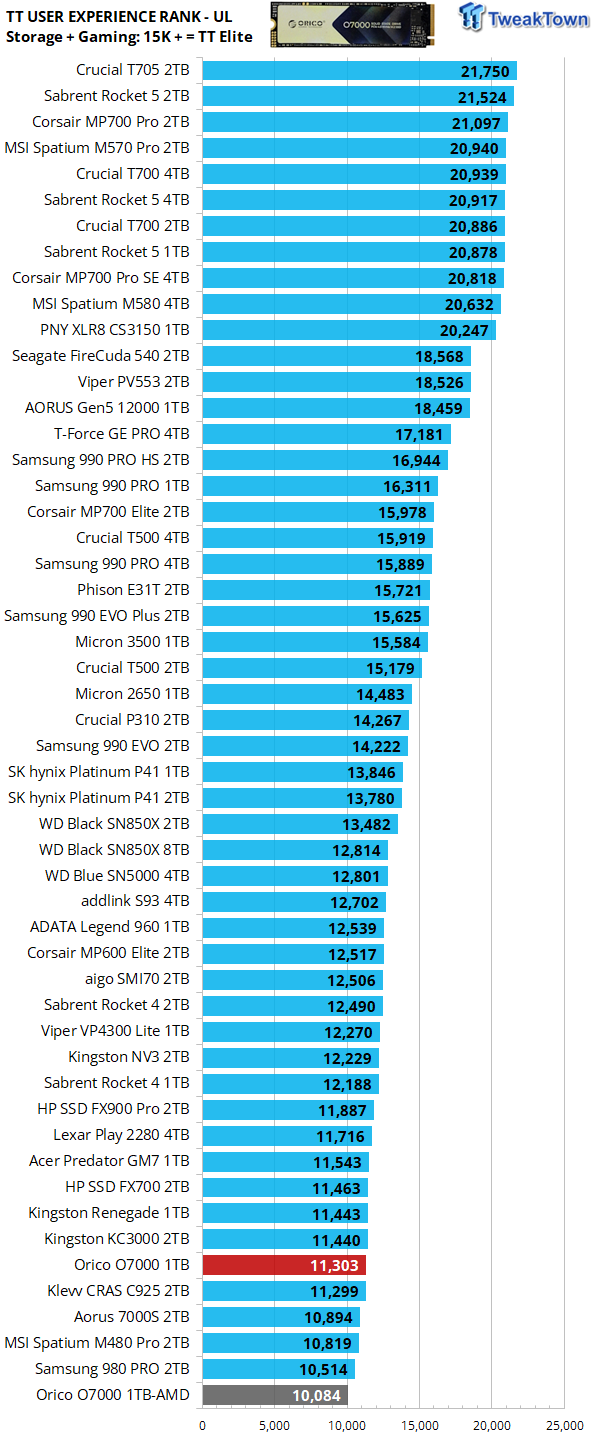
We rank SSDs in terms of overall user experience (performance where it matters most) as expressed by PCMark 10 storage and 3DMark gaming storage tests. Currently, we consider a user experience score of 15K or more to verify an SSD as a TweakTown Elite performer.

PS5 read performance is excellent, PC gaming performance is good, and the pricing is exceptional, earning Orico's O7000 1TB our Best Value Award.
 Samsung 990 2TB SSD Review - Ninth Gen QLC at PCIe Gen4 Speeds
 HighPoint Rocket 1604L Gen5 x16 NVMe Software RAID AIC Review: half the price with full 59 GB/s speed
 UGREEN NASync DXP4800 GT Review: powerful 4-bay NAS with AMD Ryzen and dual 10GbE ports
 Phison E37T SSD Controller Exclusive Preview - The Fastest DRAMless SSD Platform Yet
 Seagate FireCuda X1070 4TB SSD Review - A New Mainstream Contender
 Giveaway: Win an ASRock B850 Riptide WiFi and Phantom Gaming PG-850G PSU
 China's CXMT is on track to nearly match Micron's DRAM production capacity by the end of 2026
 NVIDIA's RTX 50 Super GPUs have reached board partners, but launch is on hold over 3GB GDDR7 pricing
 Amazon's God of War series is recasting Kratos after Ryan Hurst suffered an on-set injury
 Physical games don't matter to GameStop, CEO says
 GameStop CEO Ryan Cohen wants to buy eBay and build out an in-game digital marketplace
 KB5101650 Windows 11 update is causing some Dell PCs to shut down unexpectedly
 Bethesda on Elder Scrolls VI, Fallout 5 Xbox exclusivity: 'It's too early to comment'
 Assassin's Creed Black Flag Resynced makes in one day what Shadows took four days to earn
 Bethesda gives news on Elder Scrolls 6, confirms 4 Fallout projects, new Starfield content
 SteelSeries Arctis Nova 7 Wireless Gen 2 Headset Review - New and Improved, But Is It Enough?
 AMD Ryzen 7 7700X3D Review - Days of Future Past
 ASUS ExpertBook Ultra (Panther Lake) 14" Business Laptop Review
 ASUS ROG Raikiri II Xbox Wireless Controller Review - Ready to Take Control
 MOZA FMP18 Panel Bundle Review: authentic F/A-18 Hornet cockpit controls for flight sims
 Micron 6600 ION 245.76TB Enterprise SSD Review - Best in Class Programming Speeds
 MOZA MA3F EFCM Flight Control Module Review: authentic Airbus A320 autopilot panel for simulators
 Turtle Beach Stealth Pro II Wireless Gaming Headset Review - Premium Sound, Fantastic Features
 MOZA MGX1000 Instrument Panel Review: a realistic Garmin G1000 replica for immersive flight sims
 Hisense U6SF 65-inch MiniLED TV: High Performance Meets Leisurely Convenience
 I stopped digging through Windows menus after I set up this one folder
 Don't sell your Windows laptop until you do these things
 6 PC cleaning mistakes to avoid for safer hardware maintenance
 Phison and Intel Take Aim at Local AI's Memory Wall with aiDAPTIV
 How to Remap Keyboard Keys in Windows using Microsoft PowerToys
 7 tips to organize your Windows files for faster, easier access
 Intel Arc G3 Extreme first impressions with MSI's Claw 8 EX AI+ - Incredible power for an extreme price
 How to fix Wi-Fi Adapter Not Working on Windows laptops: troubleshooting tips
 Hisense U7SG 4K TV: Modern Entertainment for the New Age