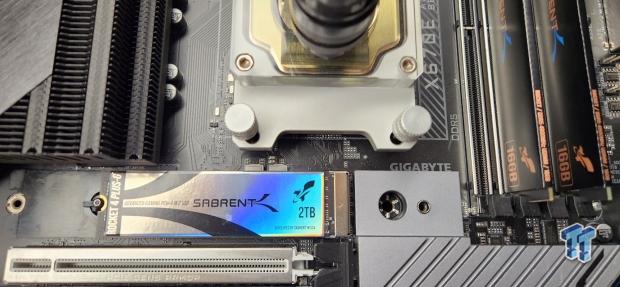
Introduction & Drive Details
AMD has captivated the attention of the PC enthusiast world with the launch of its awesome new 7000 series CPUs. This new series of CPUs represents a lot of firsts for AMD. It's their first DDR5 platform, first PCIe Gen5 platform, and the first time we get an LGA socket on an AMD mainstream consumer platform with the AM5 socket. Its 5nm silicon is another first for a mainstream consumer CPU as well, enabling ambient overclocking to reach new heights. Exciting stuff for any PC enthusiast out there.
So, by now, we've all seen results of how AMD's newest silicon stacks up against its rival Intel in terms of gaming, single-threaded and multi-threaded workloads. Each of the two factions can claim superiority in one benchmark or another. The competition is fierce, with the consumer winning the day because the competitors are so closely matched in terms of performance this time around; they need to entice the consumer with competitive pricing. In fact, we are already seeing price wars beginning to flair up between the two PC giants. Excellent for the consumer.
With TweakTown being the storage enthusiasts that we are, naturally, we have been burning the midnight oil to find out if the new Ryzen 7000 series can recapture the storage performance crown AMD lost with the introduction of Intel's 11th Gen platform. Now we are talking about real performance, not just some meaningless sequential speeds. We are talking about gaming performance and consumer workload performance as it relates to NVMe storage.
Now because storage performance, in its current form, is, for the most part, a direct reflection of IPC (Instructions Per Clock) capabilities of the CPU, this is valuable information for us to begin with as a baseline indicator.
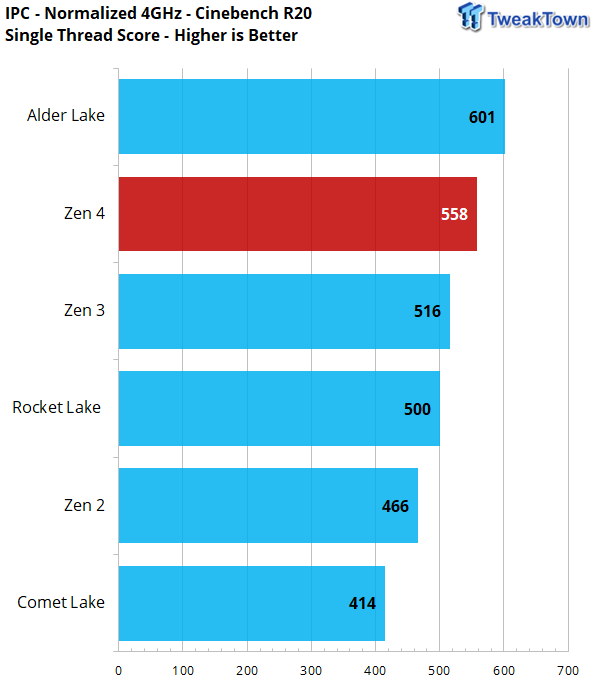
So, what we can glean from this chart is Zen 4 clock for clock is at a 7.7% disadvantage when compared with Alder Lake in terms of IPC capabilities. This, however, does not rule out that when tuned to its maximum and if it can clock higher than Alder Lake, which it can, then this deficit could shrink to the point where it's meaningless or even erased, which is exactly what we saw with Rocket Lake overtaking AMD's 5000 series on the storage performance front.
Bear in mind, we are talking storage performance here, not game FPS or heavily threaded prosumer workloads, just pure unadulterated consumer storage performance where IPC is the dominant influence. So how do we take into account for AMD being the better overclocker than Intel, but Intel having better IPC capabilities? Simple, we max out both platforms squeezing every drop of storage performance from both, and see who lands on top.
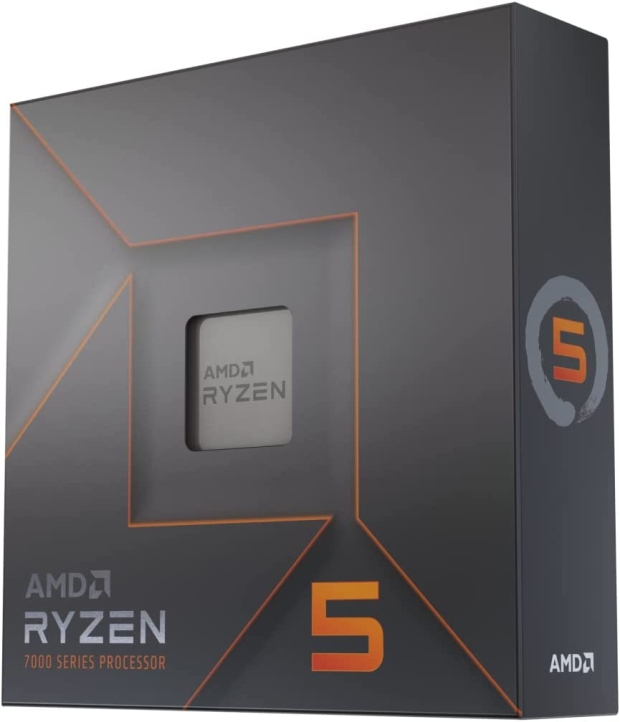
With this in mind and after determining which AMD 7000 CPU can deliver the highest storage performance, we settled on AMD's single CCD 7600X running at 5.7 GHz all core with 6200 MT DDR5 running at an uncore speed of 3100. The fastest and lowest latency we could get from an AMD 7000 series CPU. And yes, we tried the 7950X at 5.7 all core too, but due to its dual CCD architecture, it inherently has higher latency as it relates to storage performance.
For our AMD motherboard, we thoroughly tested both the ASUS X670E Hero and the X670E AORUS Master with both aforementioned 7000 series CPUs. We found the GIGABYTE offering to be substantially the better performer in terms of storage and memory performance - an easy choice when we are looking for every drop of storage performance.
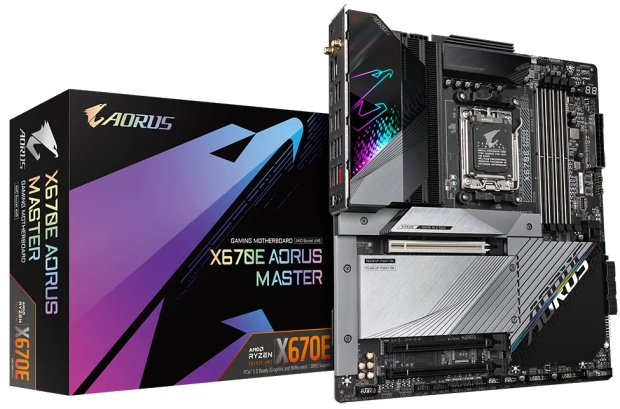
For our Intel system, we are using our tried-and-true 12700K running at 5.6 GHz all core with DDR5 running at 6666 MT memory speed. On the Intel side of things, we love ASUS and prefer the Z690 Hero to anything else out there. Again, every single drop of storage performance we can get.
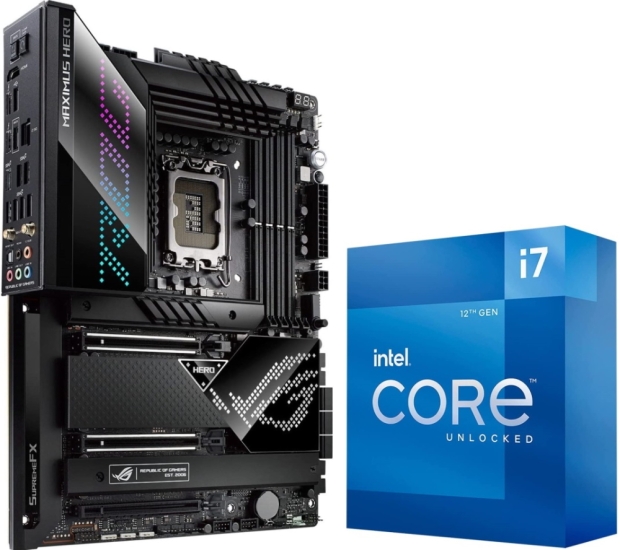
We will directly compare maxed-out storage performance utilizing 10 of our fastest and favorite Gen4 SSDs. Because AMD's Ryzen 7000 series is in the spotlight, we will be presenting a screenshot of the highest performance we could get from any of the ten subjects running on our AMD platform for each benchmark, followed by complete charts for every drive on both platforms.
Jon's Test System Specifications
AMD Test System
- Motherboard: GIGABYTE X670E AORUS Master
- CPU: AMD Ryzen 5 7600X - Buy from Amazon
- Cooler: Alphacool Eissturm Hurricane Copper 45 - Buy from Amazon
- RAM: Sabrent Rocket DDR5 32GB - Buy from Amazon
- Graphics Card: MSI SUPRIM X RTX 3080 12GB - Buy from Amazon
- Case: PrimoChill's Praxis Wetbench - Buy from Amazon
- Power Supply: be quiet! Dark Power Pro 12 1200W - Buy from Amazon
- OS: Microsoft Windows 11 Pro 64-bit - Buy from Amazon
Intel Test System
- Motherboard: ASUS ROG Z690 HERO
- CPU: Intel Core i9-12700K - Buy from Amazon
- Cooler: Alphacool Eissturm Hurricane Copper 45 - Buy from Amazon
- RAM: Sabrent Rocket DDR5 32GB - Buy from Amazon
- Graphics Card: MSI SUPRIM X RTX 3080 12GB - Buy from Amazon
- Case: PrimoChill's Praxis Wetbench - Buy from Amazon
- Power Supply: be quiet! Dark Power Pro 12 1200W - Buy from Amazon
- OS: Microsoft Windows 11 Pro 64-bit - Buy from Amazon

| Today | 7 days ago | 30 days ago | ||
|---|---|---|---|---|
| $212.10 USD | $205.59 USD | |||
| $319 CAD | $319 CAD | |||
| £199.99 | £189.99 | |||
| $212.10 USD | $205.59 USD | |||
|
* Prices last scanned on 3/5/2025 at 4:21 pm CST - prices may not be accurate, click links above for the latest price. We may earn an affiliate commission from any sales.
|
||||
Synthetic Benchmarks: CDM, Anvil, ATTO
CrystalDiskMark
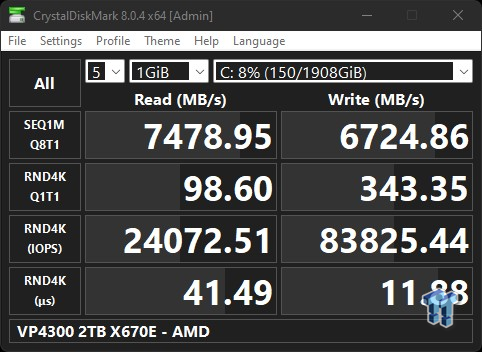
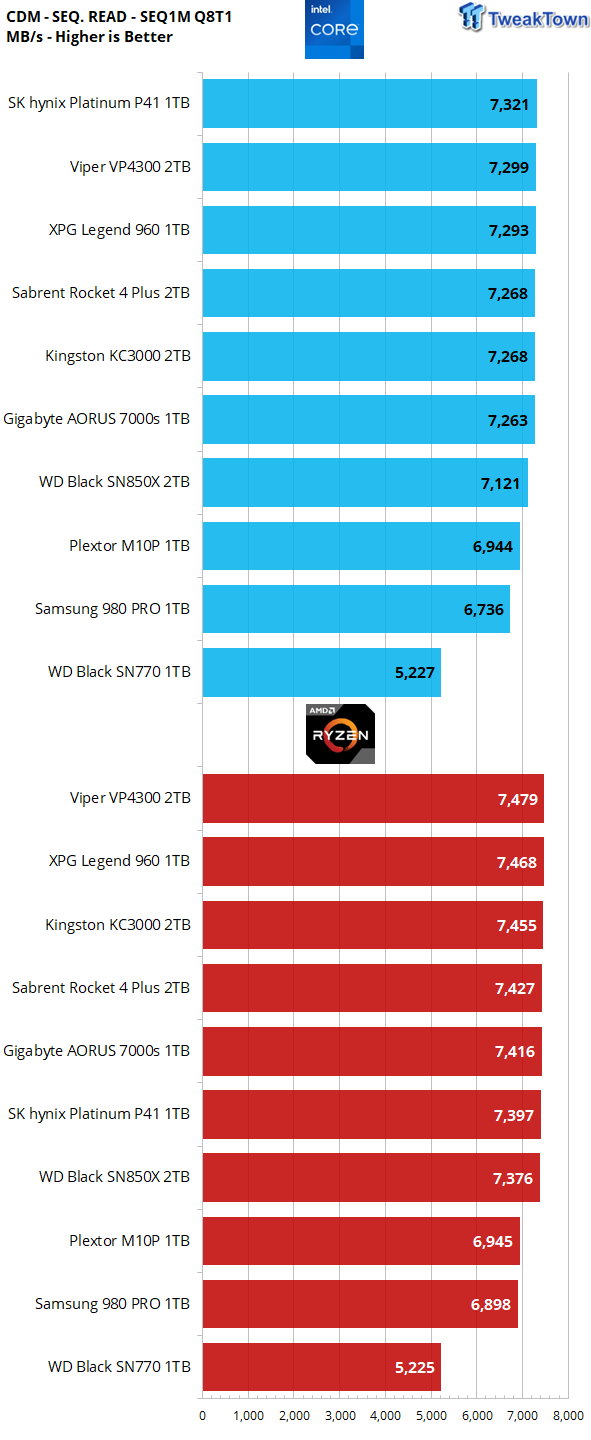
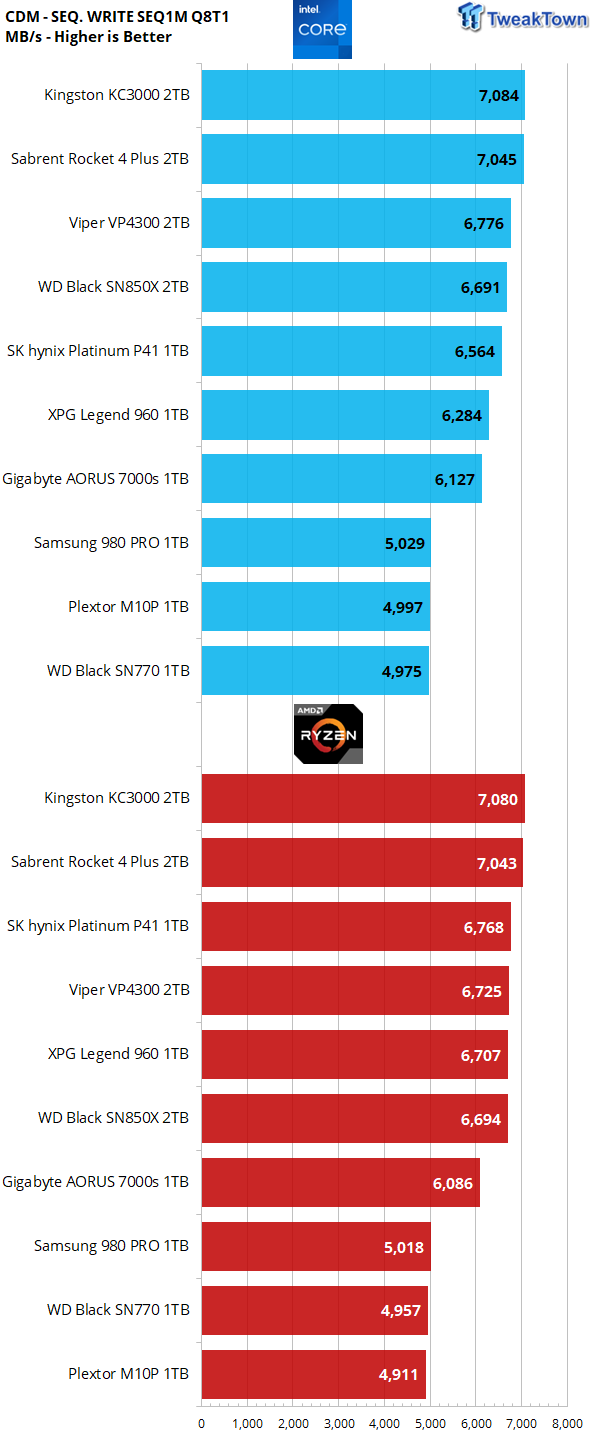
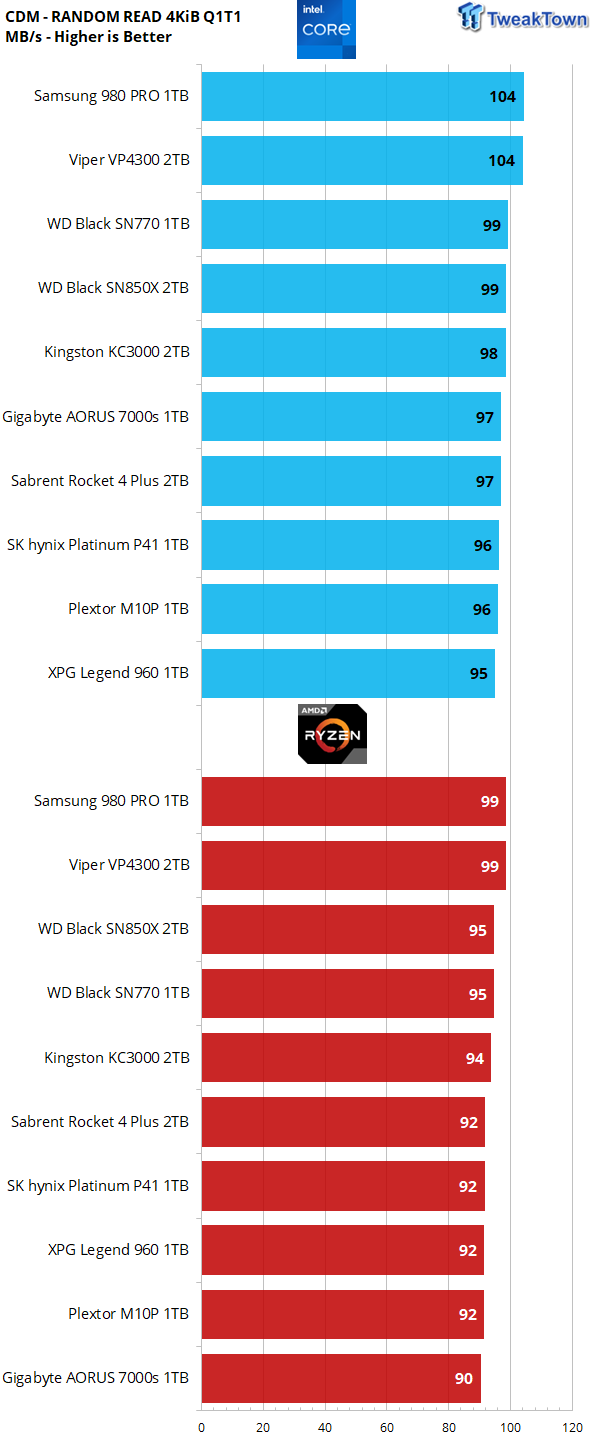
Sequential throughput numbers have been solidly in AMD's favor since Zen 3 first landed. Nothing has changed, as Zen 4 almost always wins here. However, sequential throughput is no measure of real performance. For that, we look to Q1T1 random reads where Intel is generally about 5% faster than Zen 4. This is quite an improvement over Zen 3, where Alder Lake is about 10-12% faster. Winner Intel.
Anvil's Storage Utilities
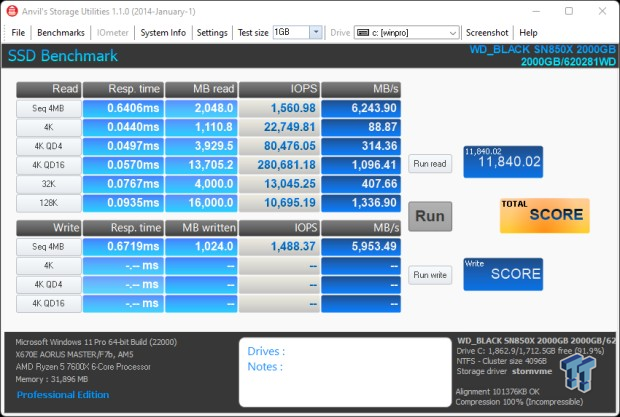
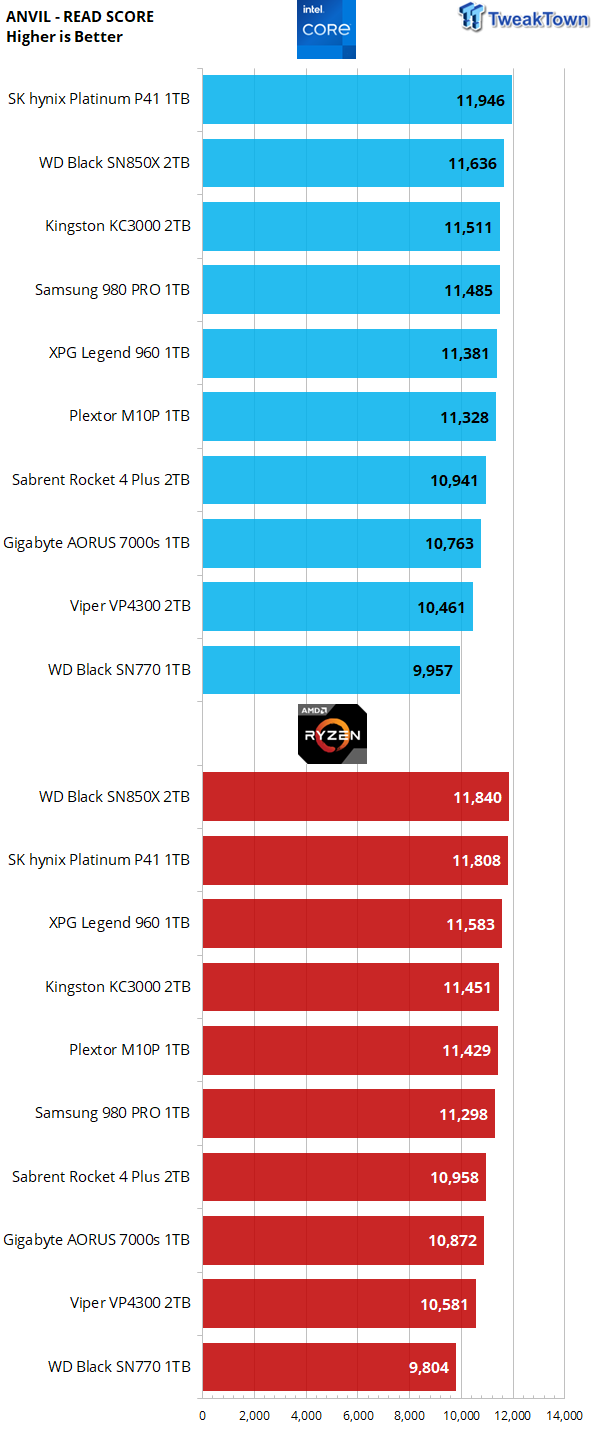
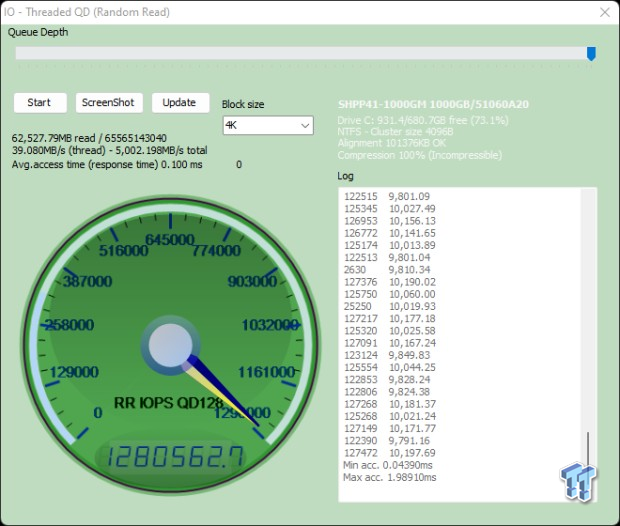
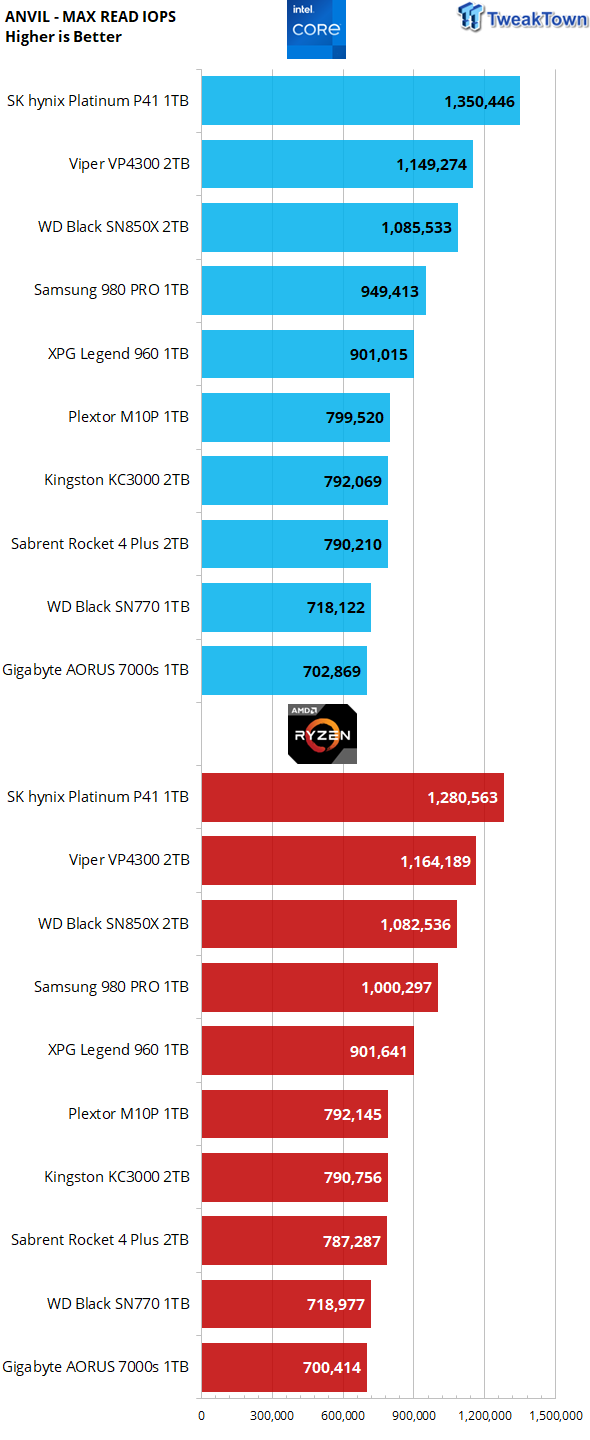
It's pretty hard to determine a winner here as both platforms trade blows in terms of the overall score and, for the most part, deliver the same max random IOPS. We will call this round a tie.
ATTO
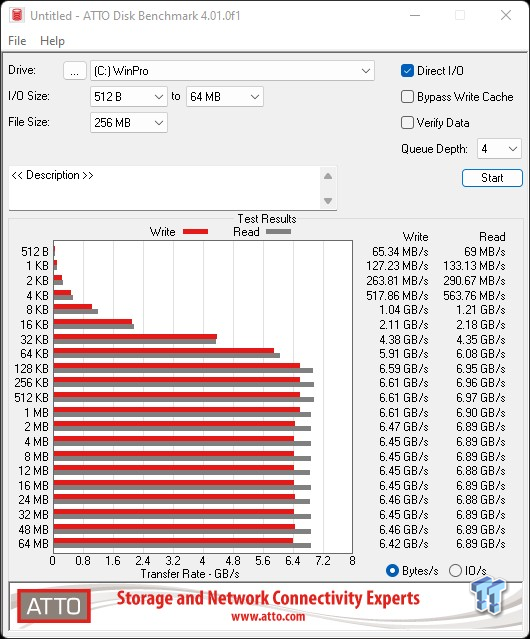
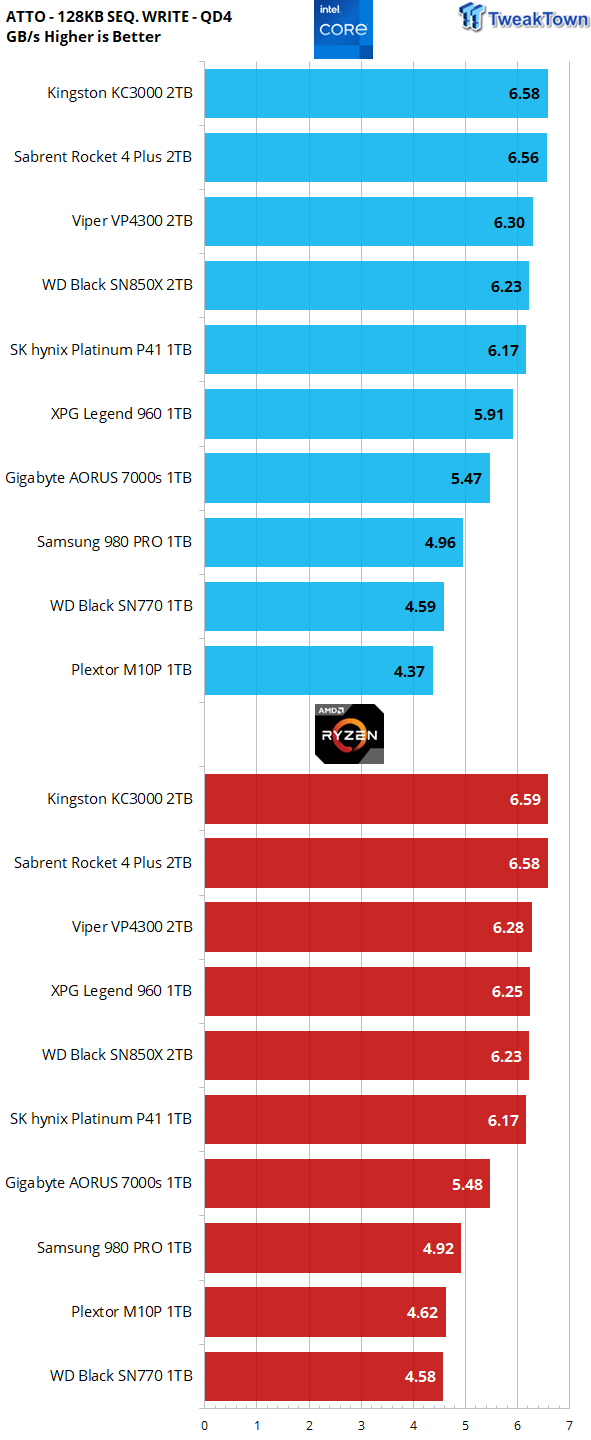
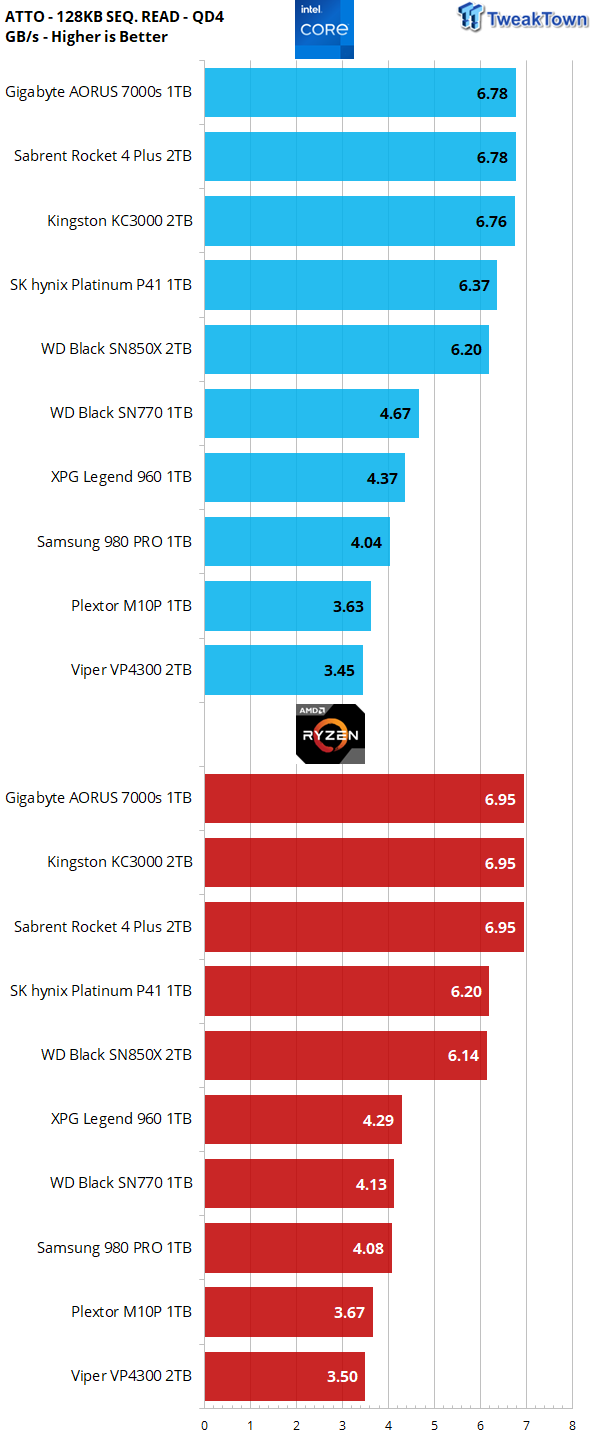
Sequential speeds are still solidly in AMD's favor 90% of the time. AMD is clearly the winner here.
Real-World Testing: Transfers, 3DMark SSD Gaming Test, PCM10 Storage
Transfer Rates
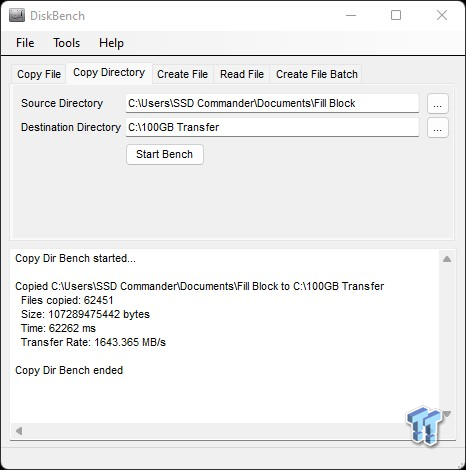
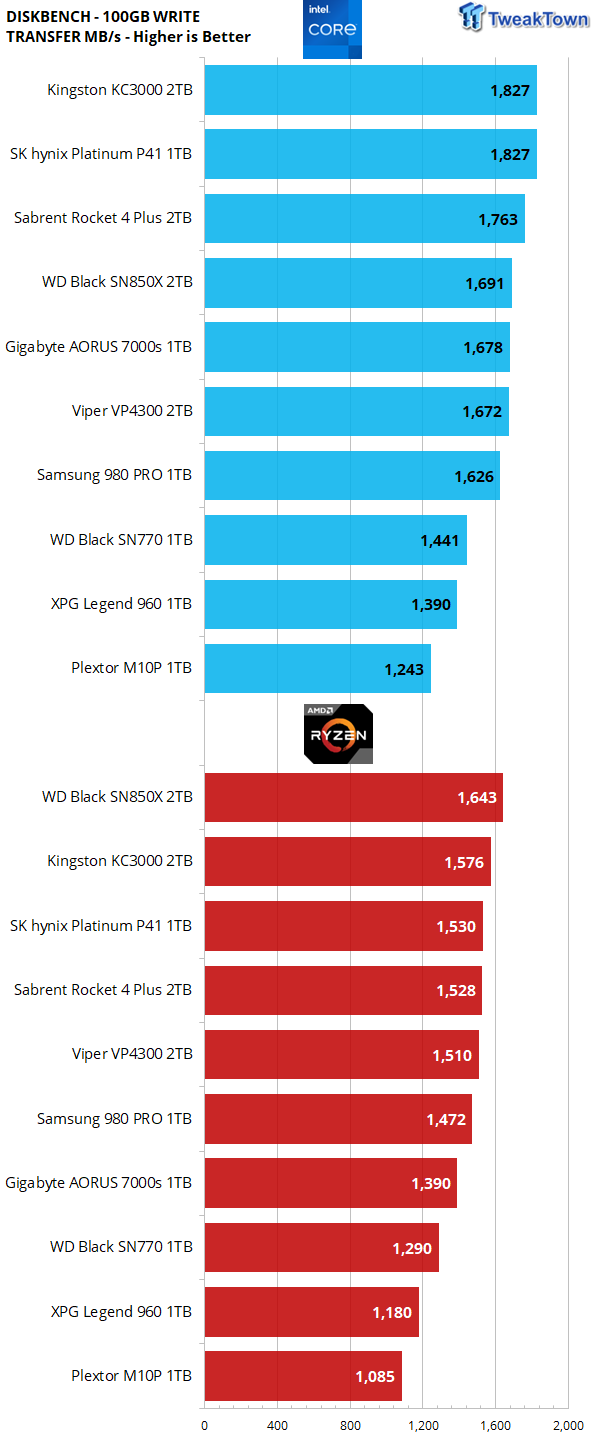
Our 100GB data transfer test is not your ordinary 100GB of data. Ours is a crushing mix composed of more than 62K files. Overall, write performance as it applies to the consumer realm is the least important performance metric, simply because the consumer realm is write infrequently, read frequently. For example, how many times is a game installed vs. how many times it's played?
Intel has a higher IPC even with factoring in our AMD chip's 100 MB/s higher clock speed, so it comes as no surprise that Alder Lake wins here.
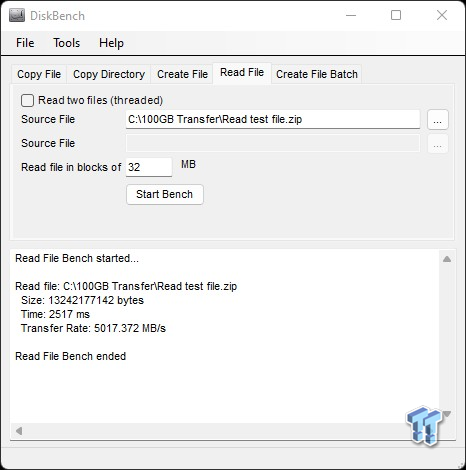
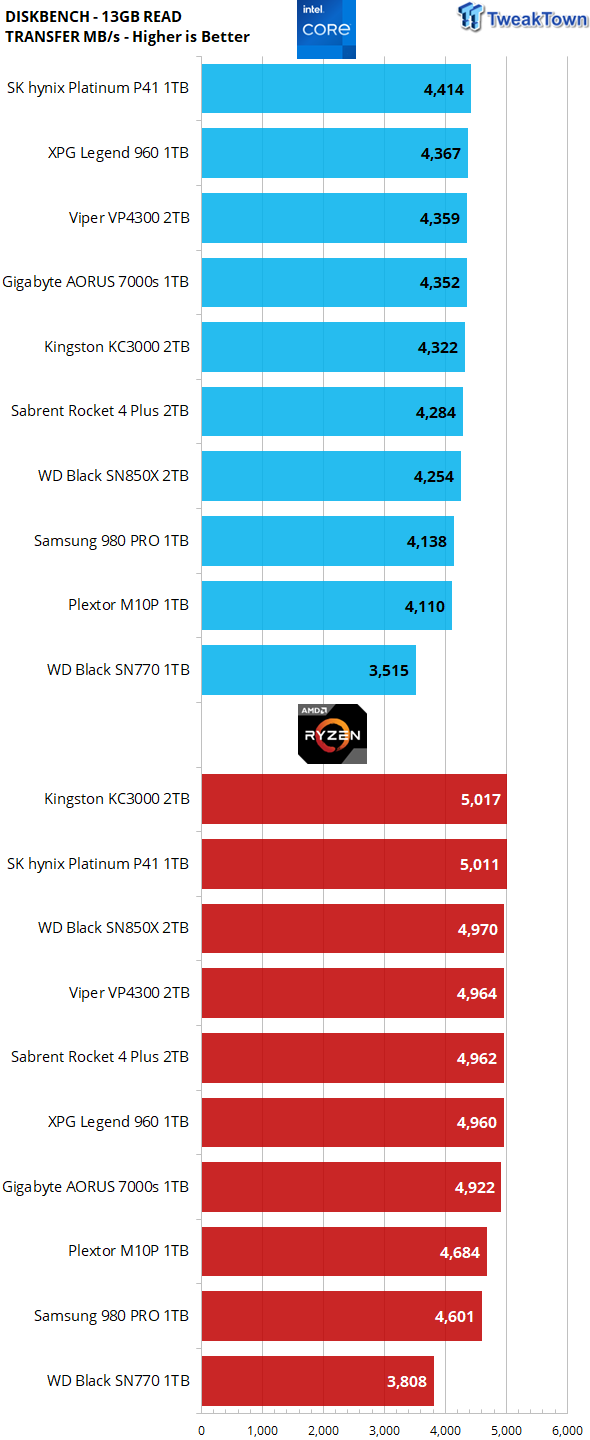
AMD really destroys Intel here simply because this is one chunk of data being served to the host, meaning it's sequential in nature and right up AMD's alley. Winner AMD
3DMark SSD Gaming Test
UL's newest 3DMark SSD Gaming Test is the most comprehensive SSD gaming test ever devised. We consider it superior to testing against games themselves because, as a trace, it is much more consistent than variations that will occur between runs on the actual game itself. This test is in fact the same as running the actual game, just without the inconsistencies inherent to application testing.
In short, we believe that this is the world's best way to test an SSDs gaming prowess and accurately compare it against competing SSDs. The 3DMark SSD Gaming Test measures and scores the following:
- Loading Battlefield V from launch to the main menu.
- Loading Call of Duty Black Ops 4 from launch to the main menu.
- Loading Overwatch from launch to the main menu.
- Recording a 1080p gameplay video at 60 FPS with OBS (Open Broadcaster Software) while playing Overwatch.
- Installing The Outer Worlds from the Epic Games Launcher.
- Saving game progress in The Outer Worlds.
- Copying the Steam folder for Counter-Strike Global Offensive from an external SSD to the system drive.
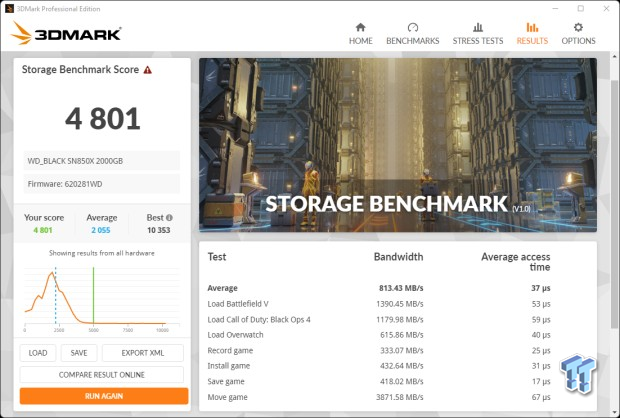
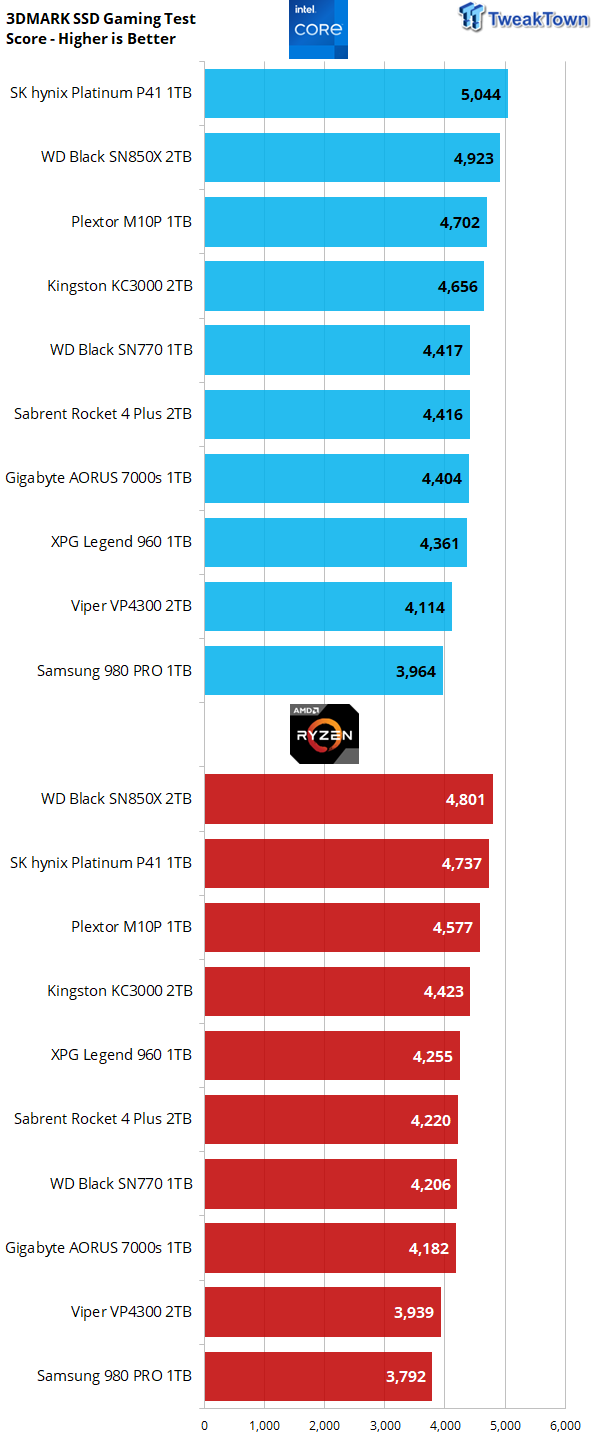
Gaming is a performance metric that matters to the majority of DIY consumers, especially to the enthusiast crowd that TweakTown caters to. This is performance that matters, real-world performance, a place where IPC comes into play big time. Intel wins across the board here.
Again, bear in mind that this is not an FPS test where other factors like CPU cache factor into the equation. This is a storage performance test as it relates to gaming, how fast it can load levels, record gameplay, save progress, and transfer game assets. Winner Intel.
PCM10 Storage Tests
PCMark 10 Storage Test is the most advanced and most accurate real-world consumer storage test ever made. There are four different tests you can choose from; we run two of them.
The Full System Drive Benchmark and the Quick System Drive Benchmark. The Full System Drive Benchmark writes 204 GB of data over the duration of the test. The Quick System Drive Benchmark writes 23 GB of data over the duration of the test. These tests directly correlate with mainstream user experience.
PCMark 10 Full System Drive Benchmark
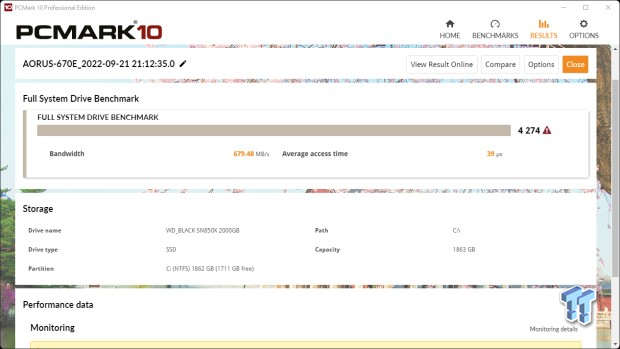
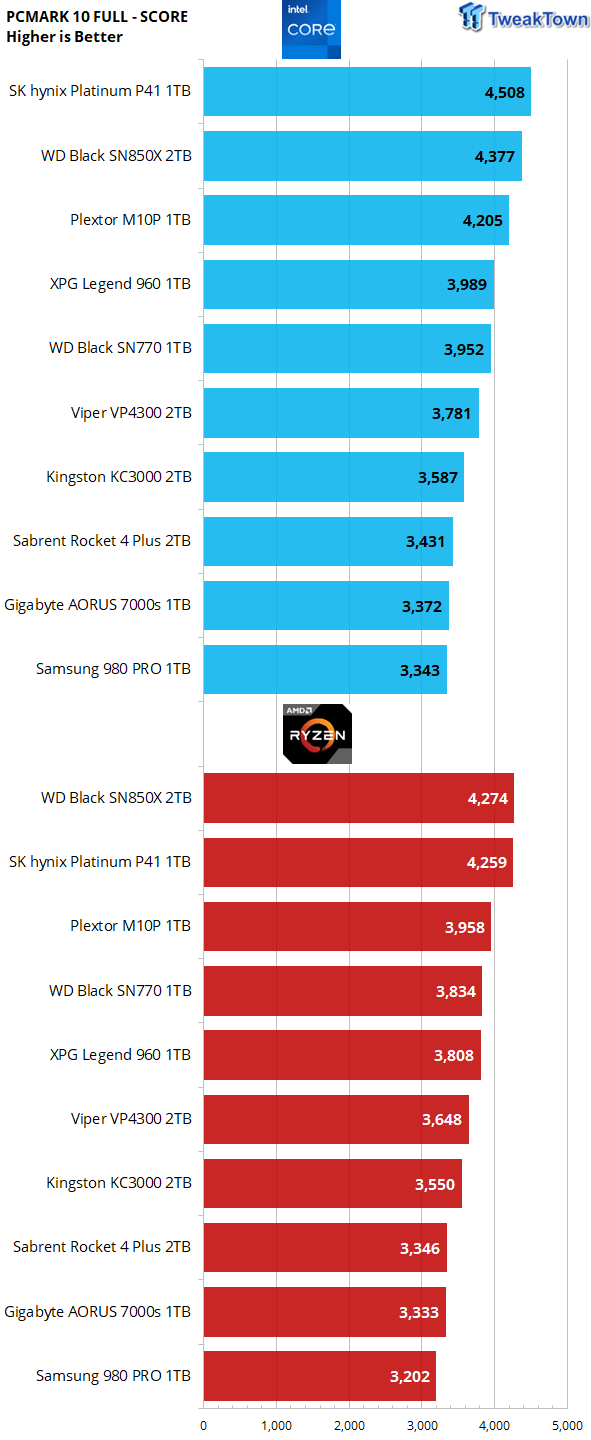
This particular test writes 204GB data and covers a broad range of common consumer tasks, including booting Windows 10, file transfers, Adobe and Office applications, and startup times for games, including Battlefield V, COD Black Ops 4, and Overwatch. Unlike synthetic numbers, this is comprehensive real-world data which is why we use it to rank SSDs in terms of user experience.
This is a long test taking approximately 30 minutes to complete. IPC adds up here, and because Alder Lake has the better IPC even when Zen 4 has the speed advantage, Intel wins 10 out of 10 times. This is performance that matters. Winner Intel
PCMark 10 Quick System Drive Benchmark
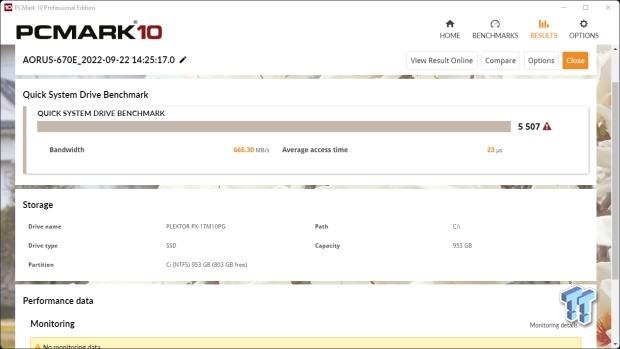
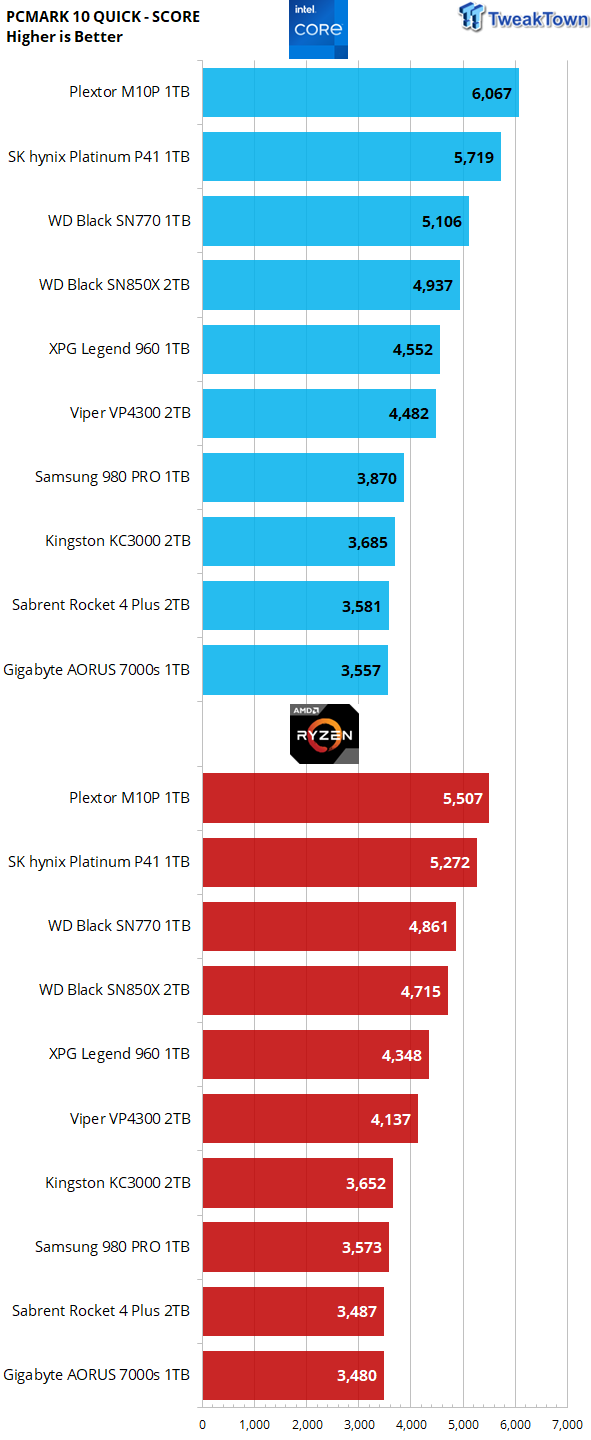
As expected, Intel again wins all ten comparisons, sometimes by as little as 1% (E18 SSDs) or by as much as 10%. We would point out that E18-controlled SSDs are not a good comparison as they always underperform here for some reason that points to its architecture being the root cause, so we would not want to consider the KC3000 or Rocket Plus as indicative of really anything here. Winner Intel.
Final Thoughts
We rank SSDs in terms of overall user experience (performance where it matters most) as expressed by PCMark 10 storage and 3DMark gaming storage tests. We consider a user experience score of 12K or more to verify an SSD as a TweakTown Elite performer.
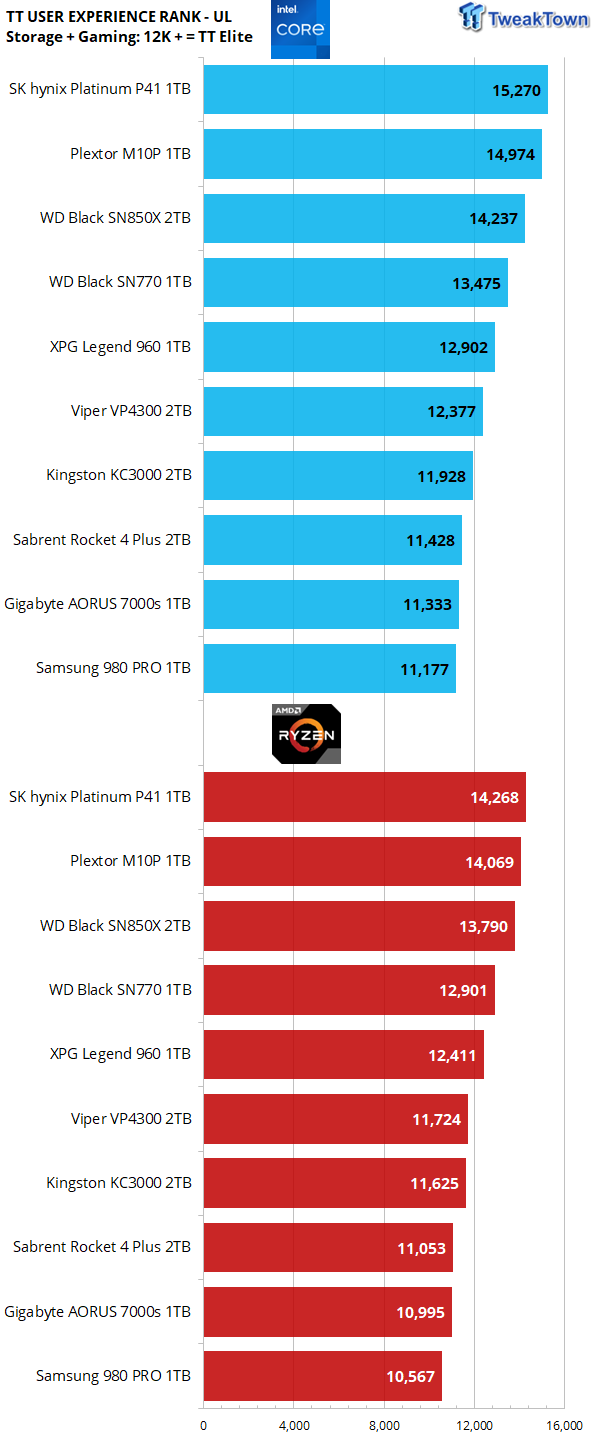
We believe this chart is a highly accurate representation that we can confidently assert a percentage that we would stand behind 100% in saying Intel's best has better real-world storage performance than AMD's best, with both platforms running at the absolute best they can at ambient temps.
Notice the pecking order is identical on both platforms? This is a testament to the accuracy of our User Experience Ranking methodology. Add up the scores, and we find Intel delivers, on average, a 4.6% better storage-related user experience than AMD.
4.6%, as we see it, factoring in a 100 MHz advantage for AMD, is likely almost exactly translated as the IPC advantage Intel has over AMD when AMD is at 5.7GHz, and Intel is at 5.6 GHz. It could also be translated directly to the most important synthetic performance metric, Q1T1 random read, where Intel has a 4.7% average advantage. Amazing and further testament to the deadly accuracy of our user experience ranking methodology.
Storage performance is indeed exactly correlated with CPU IPC capabilities. Of the ten SSDs we tested, six scored 12K or better on our Intel platform, and five got there on our AMD platform.
So, does a 4.6% real-world storage performance advantage really matter to the average enthusiast? Almost certainly not, except for a few outliers, maybe. However, we are finding that Intel and AMD are so closely matched at this moment that splitting hairs like we've done here today might actually be useful information.
Plus, it was fun as hell too. Make of it what you will. We are not on one side or the other; we love them both.

