











Most of us only use Task Manager to close unresponsive apps, but it can do much more. It can show which processes are using the most resources, help you identify performance bottlenecks, manage startup apps, monitor system resources, and identify the cause of many common Windows problems. Here are some Task Manager features every Windows user should know.
Use Efficiency Mode to Tame Resource-Hungry Apps
Not every app running on your PC needs the same level of system resources. While active programs should get the performance they need, background tasks - such as software updates, cloud syncing, or other non-essential processes - can sometimes consume more power than necessary. For these situations, Task Manager's Efficiency mode can help.
Popular Now: RTX 5090 stock dries up as prices soar past $10,000Efficiency mode tells Windows to give lower priority to selected processes, allowing more system resources to remain available for the apps you're actively using. To enable it, open Task Manager, go to the "Processes" tab, right-click a process that's using a lot of resources but isn't important at the moment, and select "Efficiency Mode."

The app may run a little slower afterward, but it will consume fewer resources, helping your PC stay more responsive.
Generate a Memory Dump for Crashing Programs
Sometimes, an app keeps crashing or freezing without showing any useful error message, making it difficult to figure out what's wrong or explain the issue to the app's support team. In such cases, Task Manager lets you create a memory dump, which captures a snapshot of the app's memory at the moment the problem occurs.

Best Deals: Samsung SSD 990 PRO 1TB PCIe 4 0 M 2 2280
Price Trend:
Prices last scanned 12 hours and 9 minutes ago

7 days ago: $239.99 USD30 days ago: $238.88 USD

7 days ago: $299.5 USD30 days ago: $299.5 USD
7 days ago: $379.99 CAD30 days ago: $390.40 CAD

7 days ago: $39930 days ago: $469
This file can help developers or support teams identify what caused the crash and troubleshoot the issue more effectively. To create one, open Task Manager, go to the "Processes" or "Details" tab, right-click the affected app, and select "Create Memory Dump File." Windows will generate the file and show you where it's saved.

Memory dump files can be quite large, so once you're done troubleshooting or have shared the file with the support team, you can safely delete it to free up disk space. Keep in mind that this is an advanced troubleshooting feature. You generally only need to create a memory dump if a developer or support team specifically asks you to provide one.
Our Latest TweakTown Guides
- I stopped trusting the Startup apps tab after I opened this utility on my PC
- I audited every credential Windows had stored for me and deleted three-quarters of them
- The Complete Windows 11 Tweaking Guide for 2026: What to Change and What to Avoid
- Using Multiple Monitors? Change these Windows settings for a Better Experience
- Windows Sandbox is The Windows Security Feature Most People Never Use
View the Command Line to Spot Suspicious Processes
Malware often disguises itself as a legitimate Windows process, making it difficult to spot. In some cases, it may even run alongside genuine instances of the same process, making the malicious one blend in. One way to identify suspicious processes is by viewing the command-line arguments used to launch them.

Frequently Asked Questions
Open a question for an answer from TweakTown's coverage of this guide, or ask your own below.
How do I enable Efficiency Mode for a background process in Task Manager?
How can I add and view the Command Line column to check a process's executable path?
How do I identify and disable high-impact startup apps using Task Manager?
What indicators in the Performance tab show which hardware component is causing a bottleneck?
Have a question that isn't listed here? Ask below, and TweakBot will answer it.

The Command Line column shows the executable's path along with any launch parameters, making it easier to tell where a process originated. If you notice a process running from an unusual location or with suspicious arguments, you can open its file location and investigate it further.
To enable this information, open Task Manager, switch to the "Details" tab, right-click any column header, and select "Select Columns." Then check "Command Line" and click "OK." You'll now be able to see the executable path and launch parameters for every running process, making it easier to spot anything that looks out of place.

Find Exactly Which App Is Slowing Down Your PC
By default, Task Manager lists all running processes, but it doesn't immediately show which ones are putting the most strain on your system. Instead of inspecting each process manually, simply open the "Processes" tab and click the CPU, Memory, Disk, Network, or GPU column header. Task Manager will sort the list, placing the biggest resource consumers at the top.

For example, clicking the CPU column shows which processes are using the most processor resources. Likewise, sorting by Memory, Disk, or Network helps you quickly identify apps consuming excessive RAM, constantly reading or writing data, or using high bandwidth. Once you identify the culprit, you can decide whether to close it, troubleshoot it, or let it finish its task.
Analyze Startup Impact Before Disabling Apps
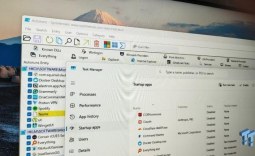
Want to speed up your PC's startup time? Disabling startup apps can help, but turning them off at random isn't the best approach. Task Manager shows how much each startup app affects boot time, making it easy to identify the ones worth disabling. Open Task Manager and go to the "Startup Apps" tab. Alongside each app, you'll see a "Startup Impact" rating.

The rating can be Low, Medium, or High, depending on how much each app affects boot time. Click the "Startup Impact" column to sort the list and bring the highest-impact apps to the top. If you find apps you don't need that have a high startup impact, disable them. Prioritizing these apps can noticeably improve boot times without affecting the programs you actually use.
Understand What's Causing the Bottleneck
The Processes tab shows how much of your system resources apps are using in real time, but if you want a better overview of your PC's performance, the Performance tab is even more useful. It displays live graphs for your CPU, memory, disk, GPU, and network usage, making it easier to spot hardware bottlenecks that may be limiting your computer's performance.
To view this information, open Task Manager and switch to the "Performance" tab. There, you'll find separate sections for the CPU, Memory, Disk, GPU, and Network, each with a live usage graph. If you notice that one of these components frequently reaches or remains close to 100% utilization, it's a good indication that it's becoming a bottleneck.

You can then focus your troubleshooting on that specific component or consider upgrading it if it's consistently limiting your PC's performance.
You now have a better idea of how powerful Task Manager can be. The next time your PC feels slow or behaves unexpectedly, use these tips to identify the root cause instead of guessing. Spending just a few minutes analyzing Task Manager can help you pinpoint performance bottlenecks, troubleshoot problems, and save yourself a lot of time and frustration.