


Introduction

Enthusiasts are always-on the lookout for the newest and fastest technology. This is specifically what I do here at TweakTown. I am on a never-ending quest for the ultimate enthusiast OS disk. Over the past year, we have examined what will deliver the ultimate storage performance in an OS setting, and SATA based RAID 0 has been the clear winner to date.
Recently we have seen a wave of PCIe based SSD's hit the market all claiming to break the chains of the SATA bottleneck. It is true that certain the PCIe drives recently introduced do have sequential performance that exceeds SATA III bandwidth, and in that respect, they do break the SATA bottleneck. PCIe drives such as OCZ's recently launched Revo 350, Comay's Blade drive, Plextor's M6E, Samsung's X941 and so on can all deliver superior sequential performance in comparison to a SATA based SSD.
When it comes to choosing the ultimate OS disk, those big time, sequential numbers as we have demonstrated time, and time again, mean exactly nothing in an OS environment. Random file performance, 4k write performance at a low queue depth in particular, is what makes for a superior performing OS disk. SATA based RAID 0 delivers far superior 4k random write performance to the recently launched PCIe drives I mentioned. In fact, the only consumer based PCIe drive that can actually outperform a high performing single SATA based SSD in a heavy usage enthusiast setting is Samsung's X941 m.2 PCIe SSD. However, when we RAID 0 our SATA based SSD's, the PCIe drives I listed get blown away in an OS environment.
The main downfall all of these PCIe SSD's is that they communicate utilizing the AHCI protocol. Using AHCI drivers means these PCIe drives cannot take full advantage of the PCIe interface's superior latency potential. This is where NVMe comes in to change everything. The NVMe protocol is so superior to AHCI that it is almost hard to fathom. We aren't going to get into why it's so superior here, but if you want to know all the details, you can read Paul Alcorn's "Defining NVMe" article.
We want to know if Intel's game changing NVMe PCIe drive, the DC P3700, can actually outperform our fastest SATA based RAID 0 array in an OS environment. Intel has demonstrated that their new DC P3700 can provide performance equivalent to (7) DC S3700's when attached via an HBA card. This demonstration, however, pertains to secondary attached storage arrays in a data center setting and not an operating system volume in an enthusiast setting. Nothing we have tested to date has been a remote threat to dethrone even a 2-drive SSD SATA array's performance superiority when utilized as an OS disk, so this should be an interesting showdown.
It is important to keep in mind that Intel did not design the DC P3700 with consumer-based workloads in mind. The DC P3700 is an enterprise drive through and through. However, because the DC P3700 is not priced completely out of the enthusiast's budget, you can be certain it will make its way into some upper tier enthusiast's PC's; after all, it's the fastest single SSD ever made.
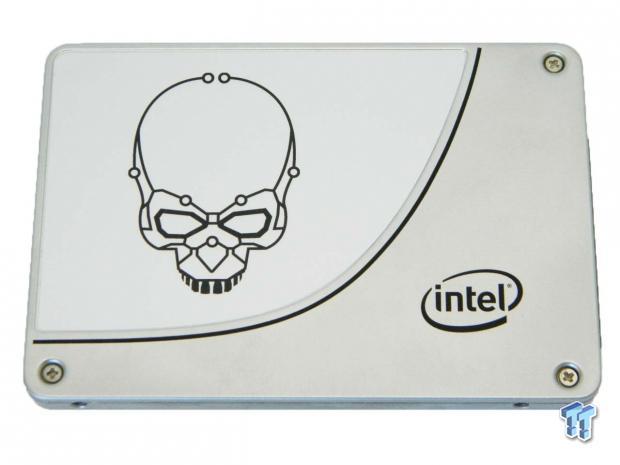
Today we have our fastest arrays composed of Intel's powerful 730 480GB SATA III SSD's in RAID 0. So far, Intel's 730 series SSD has been a SATA based RAID 0 juggernaut. Nothing else we have tested is in the same league, which is the reason Intel's 730 480GB SSD is TweakTown's current SATA based RAID 0 champion. The showdown is on; it's Intel vs. Intel. The fastest motherboard based SATA array vs. the fastest PCIe drive ever made, Intel's NVMe based DC P3700 PCIe SSD.
Our Latest RAID Article Coverage
- HighPoint Rocket 1604L Gen5 x16 NVMe Software RAID AIC Review: half the price with full 59 GB/s speed
- HighPoint Rocket 7604A Gen5 x16 NVMe RAID AIC Review - Half the Size, All the Speed
- OWC Accelsior 8M2 4TB PCIe RAID Card - 26 GB/s on the cheap
- Cheap Samsung SM961 NVMe VROC RAID SSD Performance
- LaCie 2Big RAID Desktop Storage Review
Specifications, Test System Setup, Drive Properties, Pricing and Availability
Specifications
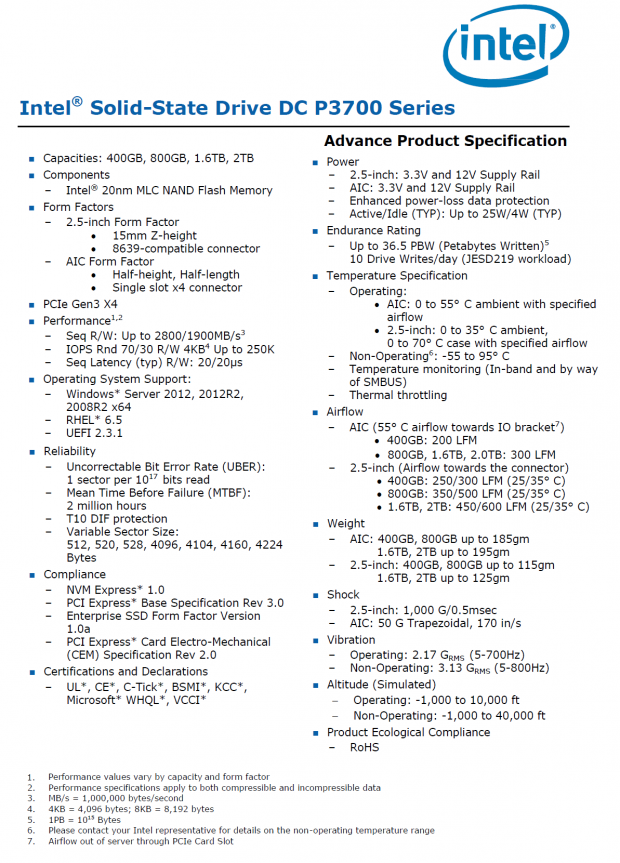

Intel's DC P3700 Series SSD's are available in four capacity sizes - 400GB, 800GB, 1.6TB, and 2TB. Specifications list Sequential R/W of up to 2800/1900MB/s. IOPS is listed at Rnd 70/30 R/W 4KB of up to 250K. The DC P3700 has an endurance rating of 10 drive writes a day for five years.
For a more in-depth look at the Intel DC P3700's feature set, I will refer you to Paul Alcorn's "Defining NVMe" article.
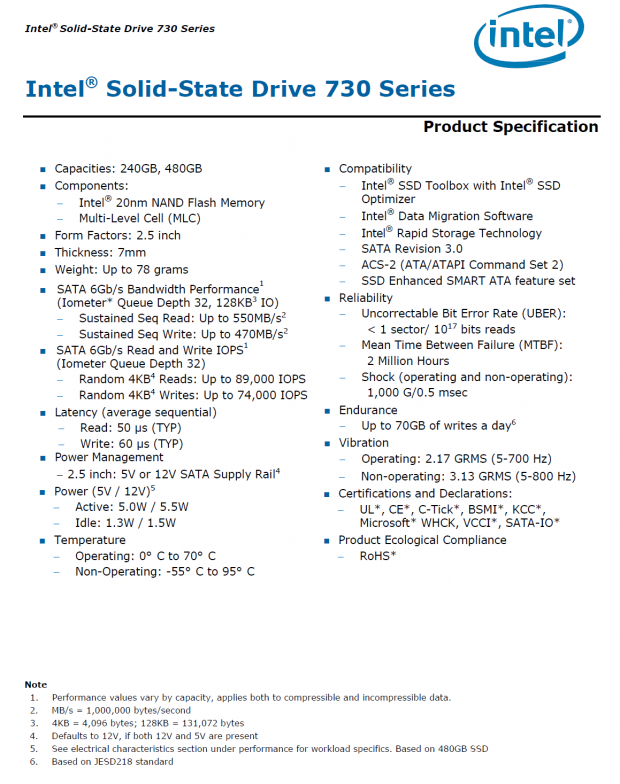
Intel's 730 Series 2.5" SATA III SSD is available in two capacity sizes - 240GB and 480GB. Specifications list the 2.5" 730 Series SSD's as having a bandwidth performance of up to 540MB/s sequential reads and 490MB/s sequential writes. 4KB random read performance is listed at up to 89,000 IOPS and 4KB random write performance is listed at up to 74,000 IOPS.
For a more in-depth look at the Intel 730's feature set, I will refer you to Chris Ramseyer's extensive review of Intel's 730 Series SSD.
Test System Setup
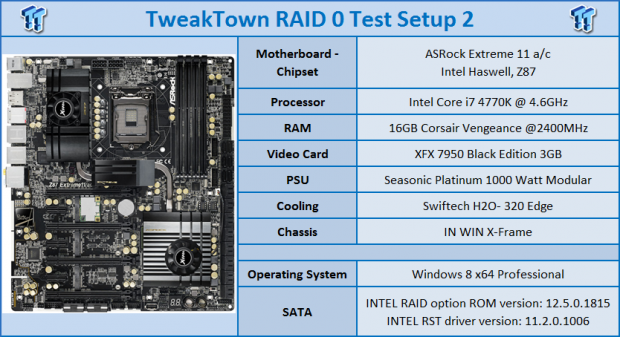
We are running our DC P3700 800GB on our Test Setup 2
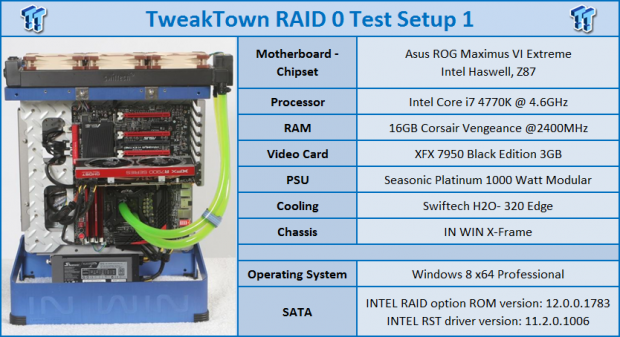
We are running our 730 Series 480GB arrays on our Test Setup 1
- Drive Properties

The majority of our testing is performed with our test drive/array as our boot volume. Our boot volume is 75% full for all OS Disk "C" drive testing to mimic a typical consumer OS volume implementation. We are utilizing Windows 8.1 64-bit for all of our testing.
PRICING: You can find both test subjects for sale below. The prices listed are valid at the time of writing but can change at any time. Click the link to see the very latest pricing for the best deal.
United States: The Intel DC P3700 (800GB) retails for $2841.00 at Amazon.
United States: The Intel 730 (480GB) retails for $395.99 at Amazon.
Canada: The Intel 730 (480GB) retails for CDN$660.23 at Amazon Canada.
Synthetic Benchmarks - ATTO, Anvil Storage Utilities, CrystalDiskMark & AS SSD
ATTO
Version and / or Patch Used: 2.47
ATTO is a timeless benchmark used to provide manufacturers with data used for marketing storage products.

Even as our OS volume at 75% full, the DC P3700 has no problem hitting advertised sequential speeds. Write speeds ramp up quickly, read speeds start coming on strong at 128k transfers.
Sequential Write

All of our arrays run stronger than the DC P3700 until we exceed 4k transfer sizes. By 8k transfers, our 4-6 drive arrays have maxed out the available bandwidth of our Lynx Point chipset equipped motherboard. The DC P3700 has no such bandwidth limitation and is able to reach its advertised sequential write speed by 8MB transfers.
Sequential Read
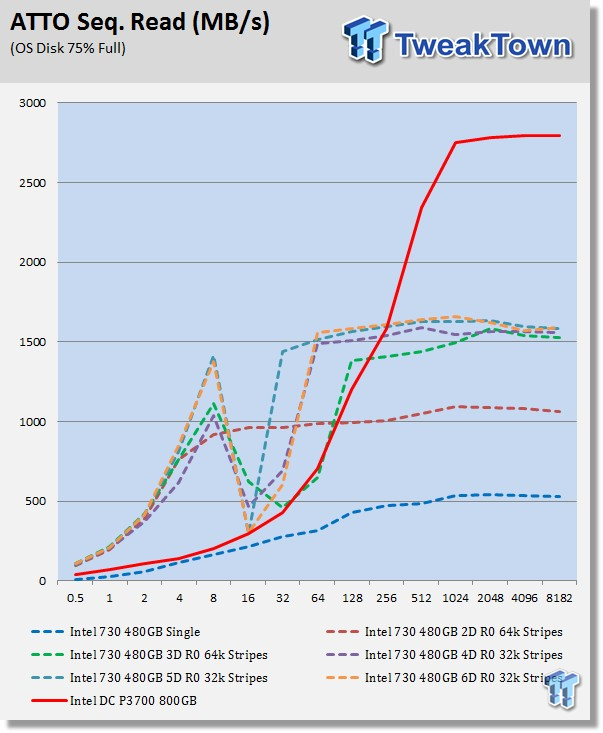
Again, our arrays are able to out-perform the DC P3700 with smaller file transfer sizes. Bandwidth limitations level off our arrays performance after 128k transfers. The DC P3700 continues climbing and essentially hits its advertised sequential read speed by 1MB transfer sizes.
Anvil Storage Utilities
Version and / or Patch Used: RC6
Anvil's Storage Utilities is a storage benchmark designed to measure the storage performance of SSDs. The Standard Storage Benchmark performs a series of tests; you can run a full test or just the read or write test, or you can run a single test, i.e. 4k QD16.
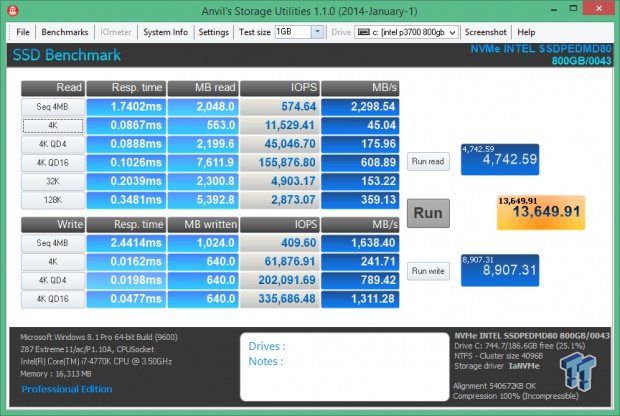
Killer score, better than any of our arrays can achieve. At least when our arrays are running on Windows 8.1 OS.
Read IOPS through Queue Depth Scale
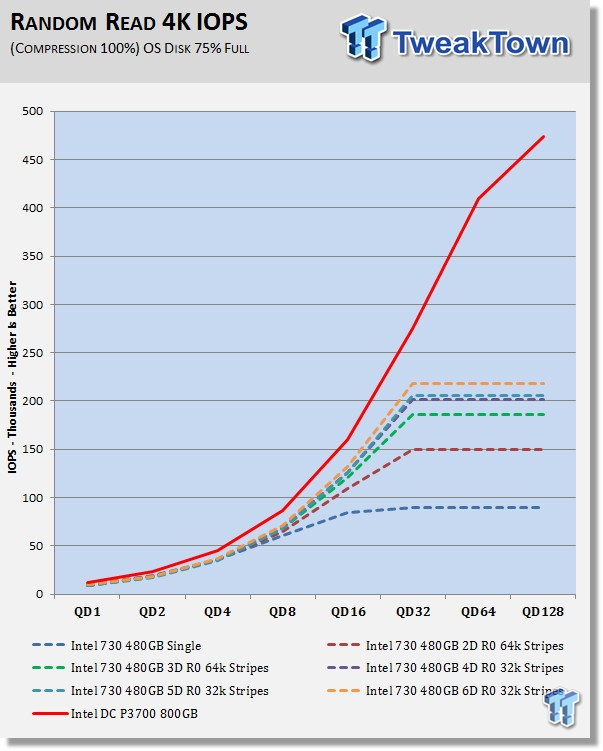
Normally we only test to a queue depth of 32 because that's the limits of the SATA protocol. The DC P3700 is just starting to get warmed up at QD32. This as expected, is a dominating performance for our NVMe SSD. The DC P3700 is able to easily outperform all of our arrays at every QD and provides more than double the IOPS of our 6-drive array hitting 475,000 IOPS at QD128.
Write IOPS through Queue Scale

At low QD levels, all of our arrays deliver superior write performance to the DC P3700. Windows 8 takes the legs out from under out arrays over QD4 causing a performance drop of nearly 100,000 IOPS as we go from QD4 to QD8.
Windows 8, 8.1 and Server 2012 data flushing compliance causes our RST powered arrays to choke on themselves at queue depths above 4. Windows 7 does not have the same issue and this is the reason Windows 7, Server 2008 both have superior SATA based storage performance in comparison to Windows 8, 8.1, and Server 2012. At high QD levels, the DC P3700 is delivering double the performance of our arrays.
CrystalDiskMark
Version and / or Patch Used: 3.0 Technical Preview
CrystalDiskMark is disk benchmark software that allows us to benchmark 4k and 4k queue depths with accuracy.
Note: Crystal Disk Mark 3.0 Technical Preview was used for these tests since it offers the ability to measure native command queuing at 4 and 32.

Sequential write performance is topping out at factory specification. Single QD 4K write performance is less than half the speed we can get from our arrays. 4K read performance at QD1-4 is superior to any array we've tested

The DC P3700 is delivering read performance superior to all of our arrays with the exception of 4K QD:32.

SATA bandwidth limitations are holding back our array's write performance. The DC P3700 has superior sequential write performance, but as we saw with our Anvil's IOPS testing, our arrays pump out more than double the 4k write performance of the DC P3700 at 4k QD1. Most consumer-based workloads do not exceed 4k QD1-4 99% of the time, so this is an indication that a SATA array may be capable of delivering better performance than the DC P3700 in a consumer environment in write intensive scenarios. PCMark 8 Extended testing is where we will see this play out.
AS SSD
Version and / or Patch Used: 1.7.4739.38088
AS SSD determines the performance of Solid-State Drives (SSD). The tool contains four synthetic as well as three practice tests. The synthetic tests are to determine the sequential and random read and write performance of the SSD.


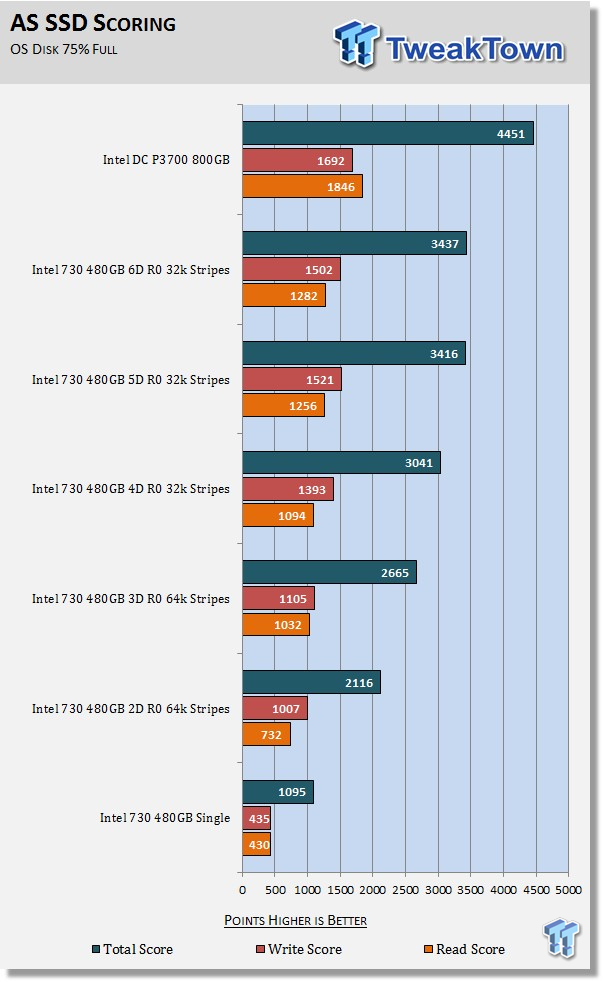
Sequential read performance is much better when testing with AS-SSD than with CDM. Curiously enough, we see the same thing from the 730. The DC P3700's 4k-64 thread performance is delivering 400,000 read IOPS and 330,000 write IOPS.
Benchmarks (Trace Based OS Volume) - PCMark Vantage, PCMark 7 & PCMark 8
Light Usage Model
We are going to categorize these tests as indicative of a light workload. If you utilize your computer for light workloads like browsing the web, light gaming, and office related tasks, then this category of results is most relevant for your needs.
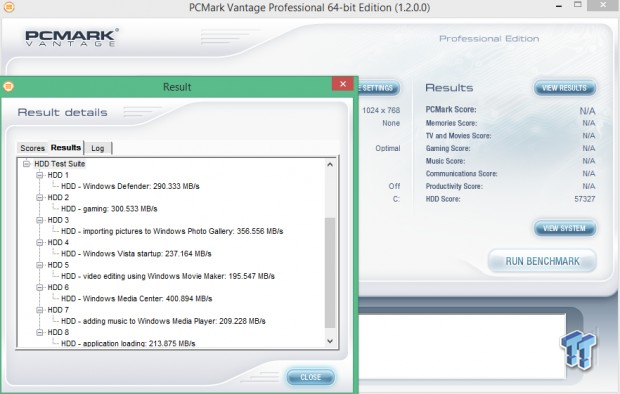
PCMark Vantage - Hard Disk Tests
Version and / or Patch Used: 1.2.0.0
The reason we like PCMark Vantage is because the recorded traces are played back without system stops. What we see is the raw performance of the drive. This allows us to see a marked difference between scoring that other trace-based benchmarks do not exhibit. An example of a marked difference in scoring on the same drive would be empty vs. filled vs. steady state.
We run Vantage three ways. The first run is with the OS drive/Array 75% full to simulate a lightly used OS volume filled with data to an amount we feel is common for most users. The second run is with the OS volume written into a "Steady State" utilizing SNIA's guidelines (Rev 1.1). Steady state testing simulates a drive/array's performance similar to that of a drive/array that has been subjected to consumer workloads for extensive amounts of time. The third run is a Vantage HDD test with the test drive/array attached as an empty, lightly used secondary device.
OS Volume 75% Full - Lightly Used

OS Volume 75% Full - Steady State
Secondary Volume Empty - Lightly Used

As you can see, there's a big difference between an empty drive/array, one that's 75% full/used, and one that's in a steady state.

The important scores to pay attention to are "OS Volume Steady State" and "OS Volume 75% full." These two categories are most important because they are indicative of typical of consumer user states.
When a drive/array is in a steady state, it means garbage collection is running at the same time that it's reading/writing. This is exactly why we focus on steady state performance. Here we can see that the DC P3700 is tuned for enterprise workloads.
PCMark 7 - System Storage
Version and / or Patch Used: 1.4.00
We will look to the Raw System Storage scoring for RAID 0 evaluations because it's done without system stops and therefore allows us to see significant scoring differences between drives/arrays.
OS Volume 75% Full - Lightly Used
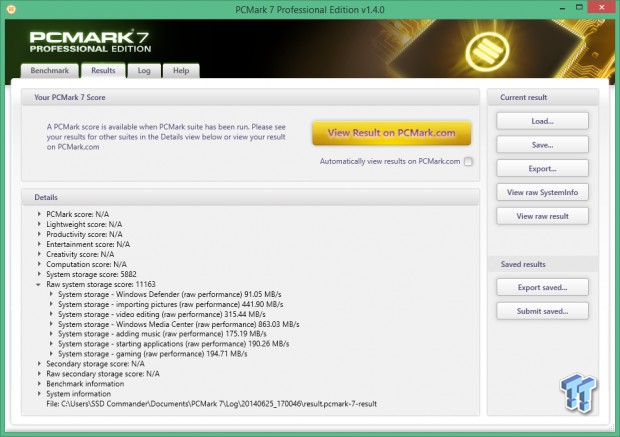

More of what we saw with Vantage testing. The DC P3700 is tuned for enterprise workloads and because of that, it's easily bested a 2-drive array when subjected to the type of consumer workloads that comprise Vantage and PCMark 7.
This is a little deceptive because Intel's 730 is so much more powerful than any other drive we have tested to date when RAIDed. There are many other arrays that cannot exceed 11,000 points, even when we RAID six of them together.
PCMark 8 - Storage Bandwidth
Version and / or Patch Used: 1.2.157
We use the PCMark 8 Storage benchmark to test the performance of SSDs, HDDs, and hybrid drives with traces recorded from Adobe Creative Suite, Microsoft Office, and a selection of popular games. You can test the system drive or any other recognized storage device, including local external drives. Unlike synthetic storage tests, the PCMark 8 Storage benchmark highlights real-world performance differences between storage devices.
OS Volume 75% Full - Lightly Used
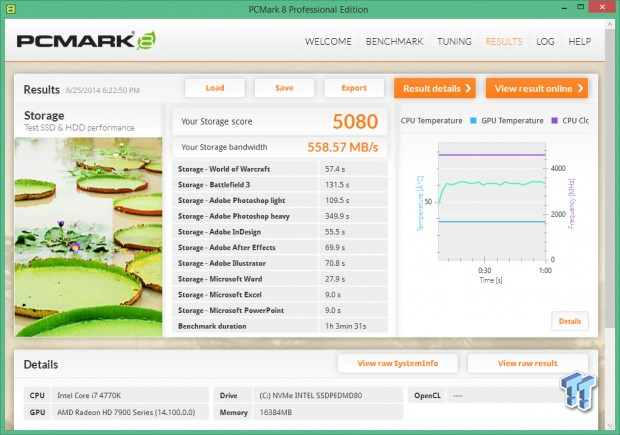

Usually we do not see a contradiction in our light usage model-testing suite; however there it is. The DC P3700 smokes all of our arrays; delivering the best performance we have ever seen from this test. I am more inclined to toss out Vantage and PCMark 7 and take this result as a standalone indication that the DC P3700 can actually outperform any motherboard based array in a light usage scenario.
Benchmarks (Secondary Volume) - Disk Response & Transfer Rates
Iometer - Disk Response
Version and / or Patch Used: 1.1.0
We use Iometer to measure disk response times. Disk response times are measured at an industry accepted standard of 4k QD1 for both write and read. Each test is run twice for 30 seconds consecutively, with a 5 second ramp-up before each test. The drive/array is partitioned and attached as a secondary device for this testing.
Write Response
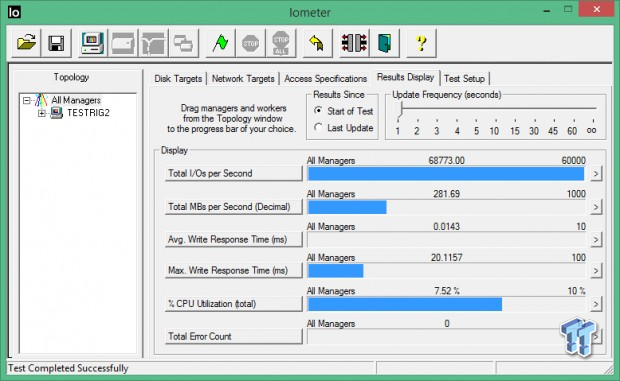
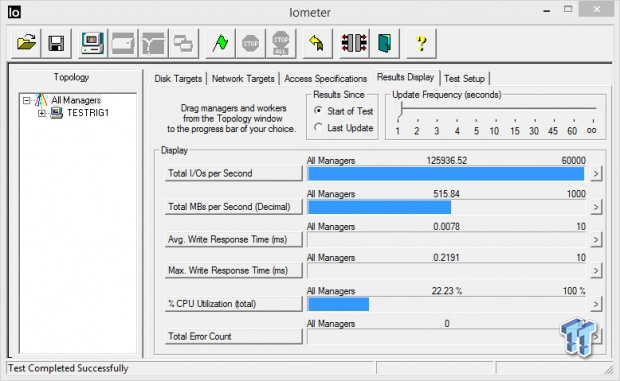
One of the many advantages of the NVMe protocol is that it is able to utilize less CPU cycles to deliver the same performance as SATA Based RAID arrays. Our array is delivering 1.83x the write IOPS of the DC P3700, but it is doing so at a CPU utilization of 22.23%. The DC P3700 is delivering its performance at a CPU utilization of just 7.52%.
Read Response
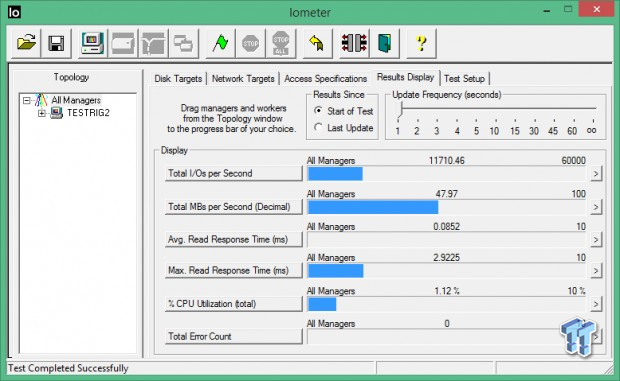
Average Disk Response
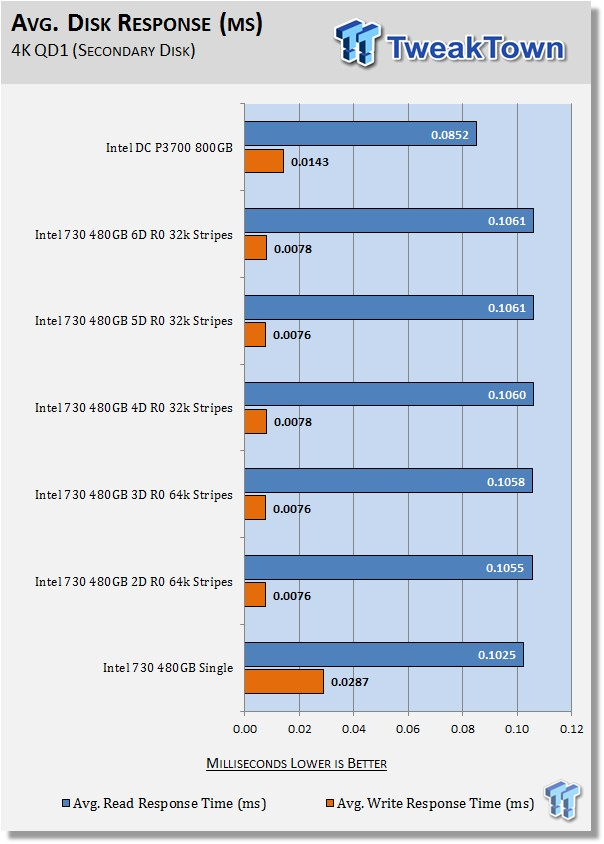
Write response times benefit most from RAID 0 because of write caching. There is a slight latency increase in read response times for an array vs. a single drive. The DC P3700 has better read response than our SATA arrays. Our arrays have better write response.
DiskBench - Directory Copy
Version and / or Patch Used: 2.6.2.0
We use DiskBench to time a 28.6GB block (9,882 files in 1,247 folders) of mostly incompressible random data as it's transferred from our OS array: to our test drive/array. We then read from a 6GB zip file that's part of our 28.6GB data block to determine the test drive/array's read transfer rate. The system is restarted prior to the read test to clear any cached data, ensuring an accurate test result.
Write Transfer Rate

Read Transfer Rate


We are only charting transfer up to a three drive array for the simple reason we don't have anything fast enough to feed an array of more than three drives. We are transferring data from a 3-drive array to a 3-drive array. Read transfers scale very well, but write transfers are handicapped by SATA architecture's single lane signaling.
To test the DC P3700, we created a secondary partition to transfer data from and to itself. Read performance with an actual data transfer is lightning quick. Write transfer performance is faster than a 3-drive array, but not a whole lot faster. I have a 3-drive array on the bench now that can beat the write transfer capabilities of the DC P3700. There is nothing sequential about the data we are transferring, so the speeds we are getting are entirely expected.
Benchmarks (Secondary Volume) - PCMark 8 Extended
Futuremark PCMark 8 Extended - Consistency Test
Heavy Usage Model
We consider PCMark 8's consistency test to be our heavy usage model test. This is the usage model most enthusiasts, heavy-duty gamers, and professionals fall into. If you do a lot of gaming, audio/video processing, rendering, or have workloads of this nature, then this test will be most relevant to you.
PCMark 8 has built-in, command line executed storage testing. The PCMark 8 Consistency test measures the performance consistency and the degradation tendency of a storage system.
The Storage test workloads are repeated. Between each repetition, the storage system is bombarded with a usage that causes degraded drive performance. In the first part of the test, the cycle continues until a steady degraded level of performance has been reached. (Steady State)
In the second part, the recovery of the system is tested by allowing the system to idle and measuring the performance with long intervals. (TRIM)
The test reports the performance level at the start, the degraded steady-state, and the recovered state, as well as the number of iterations required to reach the degraded state and the recovered state.
We feel Futuremark's Consistency Test is the best test ever devised to show the true performance of solid state storage in a heavy usage scenario. This test takes on average 13 to 17 hours to complete, and it writes somewhere between 450GB and 13,600GB of test data, depending on the drive(s) being tested. If you want to know what an SSD's performance is going to look like after a few months or years of heavy usage, this test will show you.
Here's a breakdown of Futuremark's Consistency Test:
Precondition phase:
1. Write to the drive sequentially through up to the reported capacity with random data.
2. Write the drive through a second time (to take care of overprovisioning).
Degradation phase:
1. Run writes of random size between 8*512 and 2048*512 bytes on random offsets for 10 minutes.
2. Run performance test (one pass only).
3. Repeat 1 and 2 for 8 times, and on each pass increase the duration of random writes by 5 minutes.
Steady state phase:
1. Run writes of random size between 8*512 and 2048*512 bytes on random offsets for 50 minutes.
2. Run performance test (one pass only).
3. Repeat 1 and 2 for 5 times.
Recovery phase:
1. Idle for 5 minutes.
2. Run performance test (one pass only).
3. Repeat 1 and 2 for 5 times.
Storage Bandwidth
PCMark 8's Consistency test provides a ton of data output that we can use to judge a drive/arrays performance.

We consider steady state bandwidth (the blue bar) our test that carries the most weight in ranking a drive/arrays performance. The reason we consider steady state performance more important than TRIM is that when you are running a heavy-duty workload, TRIM will not be occurring while that workload is being executed. TRIM performance (the orange and red bars) is what we consider the second most important consideration when ranking a drive/arrays performance. Trace based consistency testing is where true high performing SSDs are separated from the rest of the pack.
The DC P3700 puts up a monster performance for a single drive, delivering 2.5x the performance of OCZ's newly launched Revo 350 PCIe SSD. This is a perfect example of what NVMe protocol brings to the table. The Revo 350 has the hardware specifications to be much faster than it actually is, but because it communicates through AHCI protocol, it performs like a monster engine with a tiny carburetor.
In a heavy-duty consumer based OS workload environment, there is still nothing that can defeat a SATA based array composed of three or more Intel 730 480GB SSD's. RAID is the magic sauce, and as enthusiasts, we want our RAID array to be bootable, which is not currently an option for PCIe drives when in RAID mode.
It is likely that if Intel were to tune the DC P3700 for consumer workloads, it would be able to outperform our 730 arrays. I will point out again that this result is as far as we have seen is particular to the 730. All non-730 3-6 drive arrays we have tested cannot outperform Intel's DC P3700 800GB NVMe.
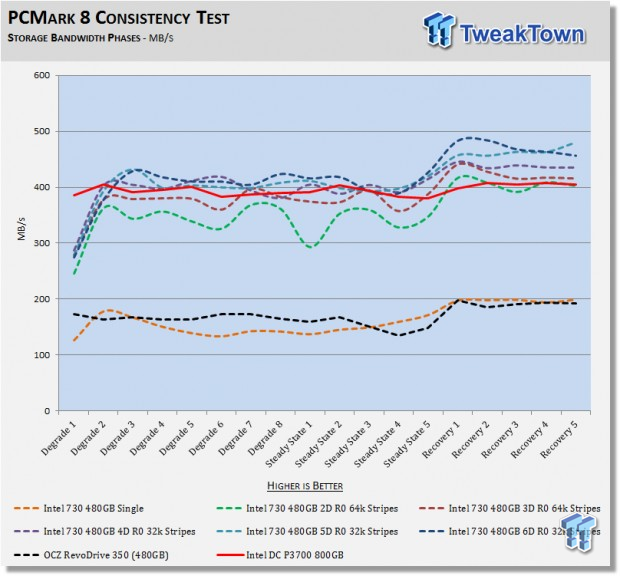
We chart our test subject's storage bandwidth as reported at each of the test's 18 trace iterations. This gives us a good visual perspective of how our test subjects perform as testing progresses.
Total Access Time (Latency)
Access time is the time delay or latency between a request to an electronic system and the access being completed or the requested data returned. Access time is how long it takes to get data back from the disk. We chart the total time the disk is accessed as reported at each of the test's 18 trace iterations.
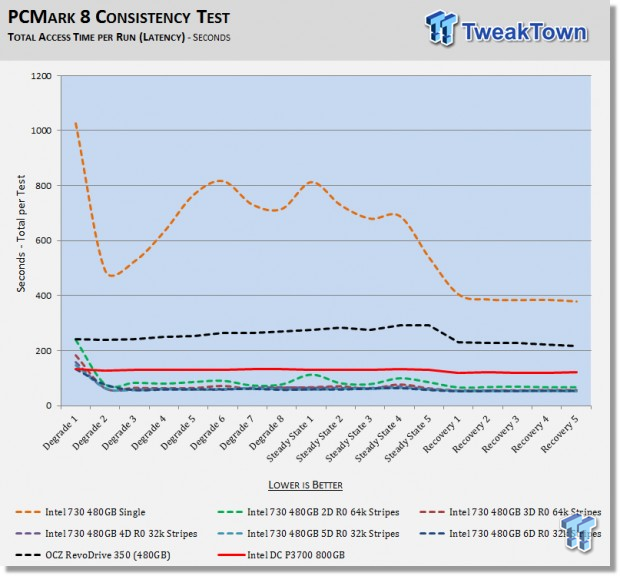
Our arrays have superior write latency at low queue depths where consumer workloads reside. The DC P3700 delivers the most consistent latency, however, our arrays deliver lower latency.
Disk Busy Time
Disk Busy Time is how long the disk is busy working. We chart the total time the disk is working as reported at each of the tests 18 trace iterations.
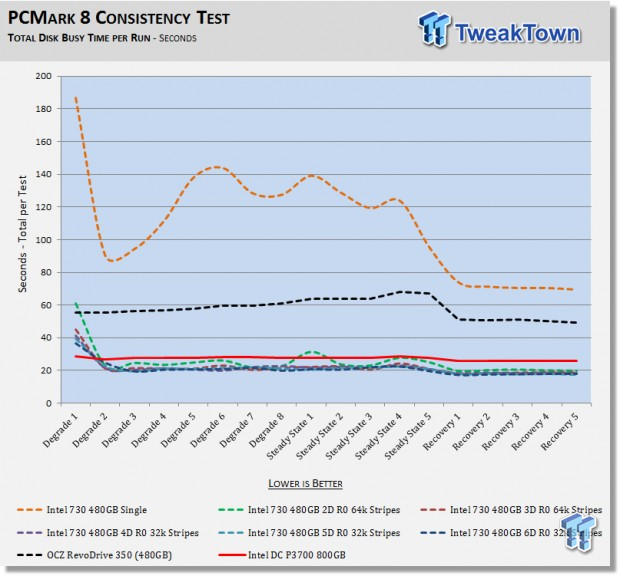
When latency is low, disk busy time is low as well.
Data Written
We measure the total amount of random data that the drive/arrays are capable of writing during the degradation phases of the consistency test. The total combined time that degradation data is written to the drive/arrays is 470 minutes. This can be very telling. The better the drive/array can process a continuous stream of random data, the more data will be written.

In this aspect of our testing, the DC P3700 really delivers. This is a testament to the power of NVMe. Look at the Revo 350; it is so limited by AHCI protocol that it cannot equal a single 730 480GB SSD in this test. Our DC P3700 is able to deliver random write performance that falls right in-between our 5 and 6 drive arrays.
Final Thoughts
Solid state storage is the most important performance component found in a modern system today. Without it, you do not even have a performance system.
For those enthusiasts out there contemplating biting the bullet and purchasing a drive like the DC P3700, let's talk for a minute about how the DC P3700 operates as an OS volume. I installed Windows 8.1 on my DC P3700 with a GPT partition and BIOS set to boot UEFI only. This resulted in a problem-free installation. The first time I tried it, it just worked.
My system boots very fast with the DC P3700, although not quite as fast as with a SATA array. There is no annoying BIOS startup routine like you typically get from PCIe drives and RAID cards. Overall, I would say the responsiveness of my system felt the same in comparison to a RAID array. The only issue I had was trying to use RST 11.2 RAID driver for secondary arrays. Installing that driver rendered my system unbootable. The default RAID driver worked without issue and I could create secondary arrays. RST 12.9 driver also worked for creating secondary RAID volumes. Intel's DC P3700 makes an awesome boot volume, provided that your motherboard is compatible.
The main consideration of course is going to be the price of the DC P3700. While it is a downright bargain in the enterprise sector, it is akin to purchasing a Ferrari in the consumer sector. The drive we tested today will cost you around $2800 for 800GB (745 GiB - usable space in Windows). If you go out and purchase six 730 480GB drives, it will cost you around $2400 for 2880GB (2682 GiB - usable space in Windows). You get more than three times the capacity by going SATA RAID, and for $400 less. So from a capacity standpoint, there is really no comparison SATA RAID is a much better value in the client space.
From a purely performance perspective where money is no object, I'm going to call this showdown a draw. Technically in a steady state heavy usage model (PCMark 8 Extended testing), our 3-6 drive arrays delivered higher performance than the DC P3700 800GB, but the DC P3700 was able to outperform our arrays in enough of our other testing to leave me with no clear winner.
I want to emphasize once again that the DC P3700 is not intended for the client space and it is tuned for enterprise workloads. However, enthusiasts want the latest and greatest, and if money is no option, then a drive like the DC P3700 is an enthusiast's dream come true.
What I take away from this showdown of the fastest SSD vs. the fastest SATA array, are two things. NVMe is vastly superior to AHCI and the power of SATA RAID 0 should not be underestimated. If you are not running RAID 0, I have to ask; what are you waiting for?
RAIDing two or more drives together provides you with storage that takes performance to the next level and is something I recommend you try. Think of it as the SLI of storage. Once you go RAID, there's no going back!
PRICING: You can find both test subjects for sale below. The prices listed are valid at the time of writing but can change at any time. Click the link to see the very latest pricing for the best deal.
United States: The Intel DC P3700 (800GB) retails for $2841.00 at Amazon.
United States: The Intel 730 (480GB) retails for $395.99 at Amazon.
Canada: The Intel 730 (480GB) retails for CDN$660.23 at Amazon Canada.
 Samsung 990 2TB SSD Review - Ninth Gen QLC at PCIe Gen4 Speeds
 HighPoint Rocket 1604L Gen5 x16 NVMe Software RAID AIC Review: half the price with full 59 GB/s speed
 UGREEN NASync DXP4800 GT Review: powerful 4-bay NAS with AMD Ryzen and dual 10GbE ports
 Phison E37T SSD Controller Exclusive Preview - The Fastest DRAMless SSD Platform Yet
 Seagate FireCuda X1070 4TB SSD Review - A New Mainstream Contender
 God of War Laufey gets a release date and Kratos is making a return
 GTA 6 trailer 3 expected to arrive within two weeks, according to insider
 Thieves stole 16 RAM sticks from Chinese eSports hotels, arrested
 Lisuan LX7G100 GPU achieves playable FPS in system with no Intel AMD or NVIDIA hardware inside
 Elder Scrolls 6 roadmap not affected by layoffs, Bethesda says
 Intel and AMD are locking Chinese customers into long-term CPU deals as server chip prices climb more than 40%
 Ubisoft CEO says Sony's PlayStation disc shutdown will not disturb the industry too much
 Vibe coding is flooding the App Store with new apps - on track for record submissions in 2026
 Geekbench 7 is out with CUDA support, smarter multi-core scoring, and new AI workloads across all major platforms
 GTA 6 physical copies in Japan have a 170-day expiration date
 Thrustmaster T.Flight HOTAS 5 MSFS Edition Review
 SteelSeries Arctis Nova Pro Omni Wireless Headset Review - One Headset to Rule Them All
 SteelSeries Arctis Nova 7 Wireless Gen 2 Headset Review - New and Improved, But Is It Enough?
 AMD Ryzen 7 7700X3D Review - Days of Future Past
 ASUS ExpertBook Ultra (Panther Lake) 14" Business Laptop Review
 ASUS ROG Raikiri II Xbox Wireless Controller Review - Ready to Take Control
 MOZA FMP18 Panel Bundle Review: authentic F/A-18 Hornet cockpit controls for flight sims
 Micron 6600 ION 245.76TB Enterprise SSD Review - Best in Class Programming Speeds
 MOZA MA3F EFCM Flight Control Module Review: authentic Airbus A320 autopilot panel for simulators
 The Ultimate Guide to Personalizing Your Windows 11 Taskbar
 How to Turn Your Windows Laptop Into a Second Monitor with Miracast and Wireless Display in Minutes
 6 Mistakes to Avoid When Buying a Windows Laptop
 I capped Windows Update's bandwidth with Delivery Optimization, and my downloads stopped choking
 I use this decade-old free tool that finds files faster than Windows Search does
 I install and update most of my apps with this Windows command now, and I stopped downloading sketchy installers
 Hisense U6SF 65-inch MiniLED TV: High Performance Meets Leisurely Convenience
 I stopped digging through Windows menus after I set up this one folder
 Don't sell your Windows laptop until you do these things
 6 PC cleaning mistakes to avoid for safer hardware maintenance