


Our Verdict
Introduction, Drive Specifications, Pricing and Availability
OCZ Storage Solutions (OCZ) is back in the game. Since being acquired by Toshiba, OCZ has cranked out a few SSDs all of which have been decent performers except the TRION 100. However, none of OCZ's recently released SSDs have carried enough performance to challenge Samsung or Intel in enthusiast circles. Today that changes. Intel was first to launch a line of NVMe SSDs and for a short time, their 750 series was the undisputed performance leader. Samsung responded with their 950 Pro M.2 NVMe SSD and since October of last year, Samsung's 950 Pro has dominated the enthusiast space as the go to consumer NVMe SSD for bleeding edge performance.
Several factors make the 950 Pro more appealing to hardcore enthusiasts than Intel's 750 Series SSDs. Number one is, of course, better performance, which is usually first on an enthusiast's check list. Pricing is the next reason for the 950 Pro's success; with an MSRP of $349.99 for the 512GB model, Samsung's 950 Pro costs considerably less per gigabyte than Intel's 750 series SSDs. Lastly, the 950 Pro comes in a far more appealing M.2 form factor.
A couple of weeks ago, we got the chance to review Toshiba's XG3 1TB M.2 NVMe SSD. Toshiba's OEM XG3 lit up our charts and cemented itself as the second best performing non-enterprise client (OEM) SSD that we've ever tested. Toshiba's XG3 stunned us with its superior sequential and random write performance, which turned out to be far better than Samsung's M.2 NVMe offerings. In addition, the XG3 handily outperformed Intel's 750 series SSDs with real-world performance testing.
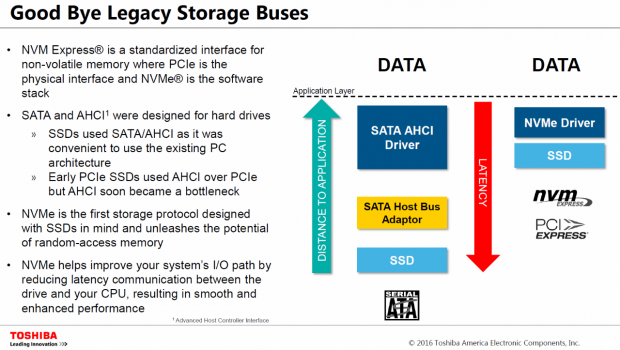
In our XG3 review, we mentioned that a retail version was coming soon via OCZ's RevoDrive 400. We speculated that OCZ's RevoDrive 400, or RD400, as we will refer to it going forward, was about to launch and that the RD400 would likely deliver even better performance than the XG3. Both of our assumptions turned out to be correct. Today, OCZ introduces the world to the RD400. OCZ's RD400 is their first stab at a consumer-based NVMe SSD. The RD400 is an M.2 form factor SSD with a PCIe Gen 3x4 physical interface, which we find most appealing. Contrary to popular belief, NVMe in not a physical interface, it is a software stack that runs on the PCIe interface.
The RD400 employs a Toshiba 15nm MLC planar flash array. Utilizing planar flash is the reason why OCZ's RD400 costs less per gigabyte than Samsung's 950 Pro. Reliability and endurance are essential to any high-performance SSD solution. To address this, the RD400 employs Toshiba's proprietary Quadruple Swing-By Code (QSBC) error-correction technology, a highly efficient error correction code (ECC), which helps protect customer data from corruption, improves reliability, and extends the life of Toshiba SSDs. QSBC is rumored to be even more efficient than LDPC.
OCZ enhances reliability and performance even further with its proprietary NVMe driver. The RD400 will run fine with Microsoft's in-box NVMe driver, but even better with OCZ's NVMe driver. Additionally, OCZ's proprietary driver supports Windows 7 and can be F6 loaded with your Windows 7 install, making it easy for Windows 7 users to run the RD400 as their OS disk.
If you have a notebook with a PCIe Gen 3x4 interface that supports an M.2 x 2280 SSD and you are looking to upgrade, OCZ's RD400 is an excellent choice because it is not only powerful, it is also power efficient. OCZ engineered the RD400 family of SSDs for power efficiency, through lower power-state modes and the use of components engineered for power efficiency.
Our Latest SSD Review Coverage
- Phison E37T SSD Controller Exclusive Preview - The Fastest DRAMless SSD Platform Yet
- Seagate FireCuda X1070 4TB SSD Review - A New Mainstream Contender
- Micron 3610 2TB SSD Review - DRAMless QLC at 11,000 MB/s
- SK hynix Platinum P51 2TB SSD Review - A Powerful Gen5 Alternative
- Biwin Black Opal X570 Pro 8TB SSD Review - Massive Capacity with Elite Performance
Drive maintenance is imperative to the end-user and it doesn't get any better than OCZ's SSD Utility. This utility allows the RD400 end-user to monitor drive health, tune their system for maximum performance, easily perform a secure erase or advanced format, update firmware, and perform a whole host of additional functions, quickly and easily. We will briefly cover the main functions of OCZ's SSD Utility on page three of this review.
Let's take a close look at the RD400's factory specifications.
Specifications

The RD400 is available in four capacities: 128GB, 256GB, 512GB, and 1024GB (1-terabyte). There are two versions: Standalone M.2 and M.2 with Add-In-Card (AIC). Sequential specifications: Read up to 2600MB/s, Write up to 1600MB/s. Random 4K performance tops out 210K for read, 140K for write. Performance varies by capacity point, so please refer to the spec sheet above. Power consumption: Active 6-6.4W typical, Low Power State 6.0mW typical. MTTF checks in at 1.5 million hours. TBW varies by capacity from 74TB -592TB.
The RD400 in the 256GB capacity without AIC carries an MSRP of $169.99, and the 512GB model goes for $309.99. This is $30-$40 less respectively than the MSRP of Samsung's 950 Pro at each capacity point. We do recommend the AIC version, for an additional $20 you get a high quality AIC to M.2 adapter. The AIC provides additional versatility along with potentially better performance.

OCZ's Advanced Warranty is the best in the business. As implemented on the RD400, it is a limited five-year warranty that features advanced replacement of a defective product with no return shipping cost to the customer.
Drive Details
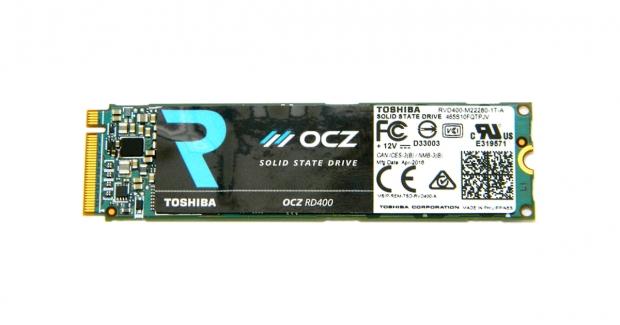
OCZ RevoDrive 400 M.2 NVME PCIe SSD
We have three capacity points we are going to cover in this review. 256GB, 512GB, and 1TB - all three tested on the included AIC adapter that came with our review samples. All the drives are physically similar, so we are only going to take photos of one of them.

The retail packaging for the RD400 with AIC adapter is absolutely gorgeous. The front of the black themed box features blue highlights and a picture of the RD400 installed on the included AIC adapter.

The back of the box is just as gorgeous. Features of the drive are listed along with various bits of relevant information. We note the RD400 is not compatible with Intel's RST driver.

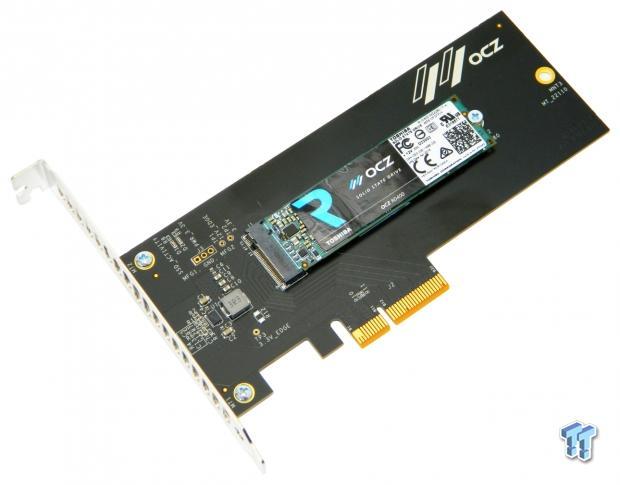
Inside the box, the drive is protected by a clear plastic two-piece enclosure. Even this is of high quality; very rigid and well formed. A half-height bracket is included.

We have many M.2 to PCIe adapters on hand here at the lab, and we can tell you that OCZ's adapter is top quality. In addition, it is worth noting that this particular adapter is the first we've used that does not incur a performance hit. In fact, we tried the RD400 with and without the adapter and it ran slightly better with the adapter. We feel the additional $20 spent to get the adapter is money well spent. Even with the adapter, the RD400's MSRP is $10-$20 lower than a 950 Pro at similar capacity points.
The back of the adapter is devoid of components.

Pulling the drive from the adapter reveals a gray thermal/support pad.

This side of the PCB is covered with an attractive manufacturer's label. The label covers the drive's controller, DRAM package, and two flash packages. We wondered if the label would impede thermal dissipation, but we found that if it does; it's not enough to matter. We ran our tests with the label on and without any airflow; we experienced no thermal throttling.

This side of the PCB features another manufacturer's label that gives us the part number, serial number, shipping firmware, and date of manufacturer.

With the label removed, we can see the drive's controller, DRAM cache package, and two flash packages.
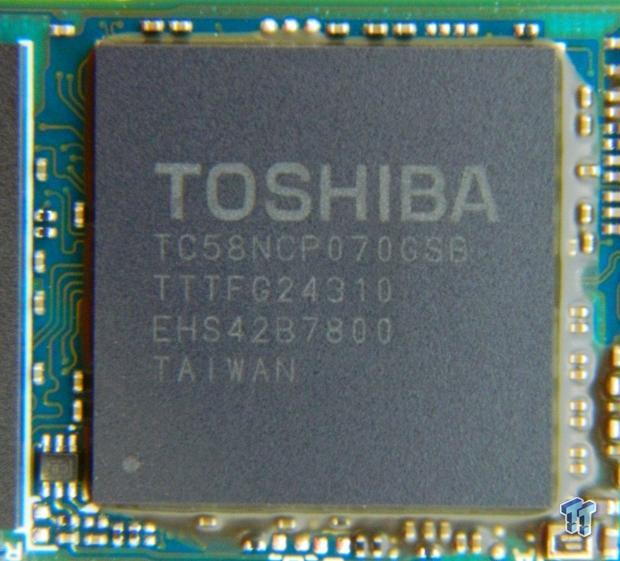
A detailed view of the drive's proprietary NVMe controller.

A detailed view of one of the drive's 15nm MLC BGA flash packages.

A detailed view of the drive's DRAM cache package and edge connector.
Test System Setup, Drive Properties, & OCZ SSD Utility
Jon's Consumer PCIe SSD Review Test System Specifications
- Motherboard: ASRock OC Formula Z170 - Buy from Amazon / Read our review
- CPU: Intel Core i7 6700K @ 4.7GHz - Buy from Amazon / Read our review
- Cooler: Swiftech H2O-320 Edge - Buy from Amazon / Read our review
- Memory: Corsair Vengeance LPX DDR4 16GB 3200MHz - Buy from Amazon
- Video Card: Onboard Video
- Case: IN WIN X-Frame - Buy from Amazon / Read our review
- Power Supply: Seasonic Platinum 1000 Watt Modular - Buy from Amazon / Read our review
- OS: Microsoft Windows 10 Professional 64-bit - Buy from Amazon
- Drivers: Intel RAID option ROM version 14.6.0.1029 and OCZ NVMe driver
We would like to thank ASRock, Crucial, Intel, Corsair, RamCity, IN WIN, and Seasonic for making our test system possible.
Drive Properties
256GB 75% full
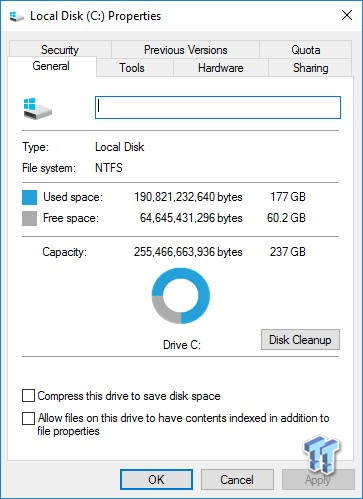
1TB 75% full

512GB 75% full

The majority of our testing is performed with our test drive as our boot volume. Our boot volume is 75% full for all OS Disk "C" drive testing to replicate a typical consumer OS volume implementation. We feel that most of you will be utilizing your SSDs for your boot volume and that presenting you with results from an OS volume is more relevant than presenting you with empty secondary volume results.
System settings: Cstates and Speed stepping are both disabled in our systems BIOS. Windows High-Performance power plan is enabled. Windows write caching is enabled, and Windows buffer flushing is disabled. We are utilizing Windows 10 Pro 64-bit OS for all of our testing except for our MOP (Maxed-Out Performance) benchmarks where we switch to Windows Server 2012 R2 64-bit.
OCZ SSD Utility
OCZ's SSD Utility is a feature-rich toolbox that makes maintenance and monitoring of OCZ SSDs rather user friendly. We will cover the main features of this utility; there are several additional features that we will not elaborate on.

The Dashboard located on the Overview tab displays capacity, firmware, driver, health, and temperature. It also verifies that you are connected via a PCIe Gen 3x4 connection.

SSD Details lists the particulars of your OCZ SSD. We note that the Config ID is listed as XG3_57CZ indicating that the RD400 is an XG3 variant.
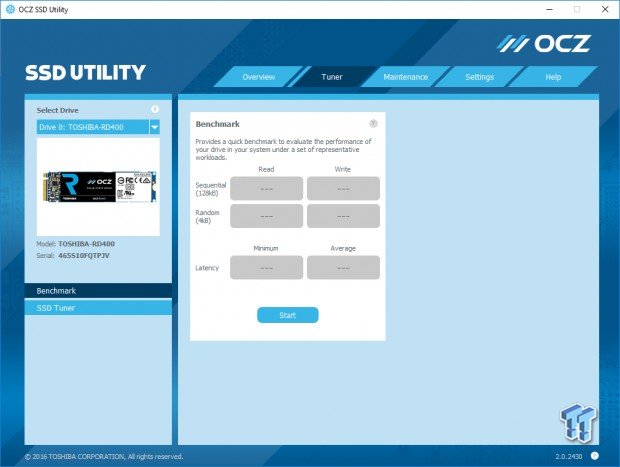
OCZ's SSD Utility has a built-in benchmark so you can easily verify that your configuration is delivering advertised speeds.

Secure erasing your RD400 while attached as a secondary device is as simple as clicking the erase button.

To perform functions, like secure erase, while the RD400 is attached as your primary HDD, you can create a bootable version of OCZ's SSD Utility.

The Help tab creates a host report. Live support and support forums are just a click away.
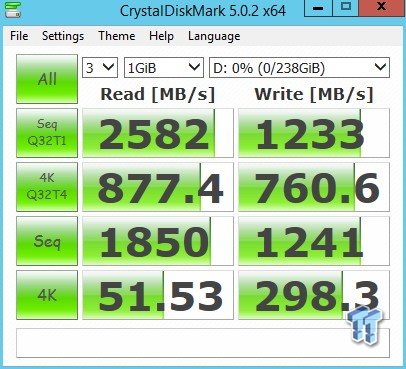
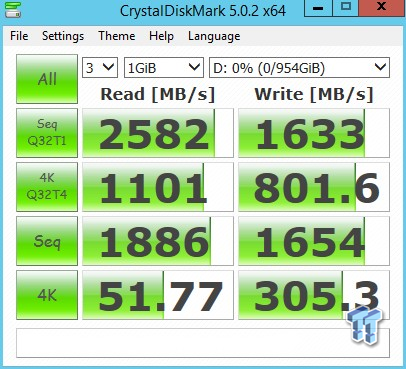
We will be charting three capacities of the RD400 and presenting screenshot benchmarks of the 512GB RD400. We believe the 512GB RD 400 will be the best-selling capacity point, so we want to highlight its performance with screenshots.
Synthetic Benchmarks - ATTO & Anvil Storage Utilities
ATTO
Version and / or Patch Used: 2.47
ATTO is a timeless benchmark used to provide manufacturers with data used for marketing storage products.

Sequential read/write transfers max out at an impressive 2,697/1644 MB/s with the 512GB RD400. Keep in mind this is our OS volume, and it is filled to 75% of its total capacity. We note the impressive performance at 4K transfers. The highest sequential performance is achieved at 512KB transfers.
Sequential Write
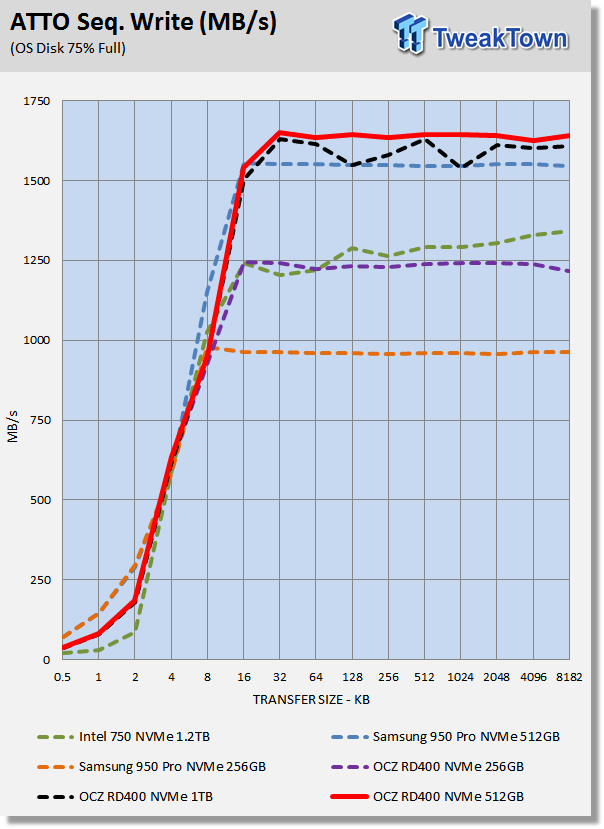
Both the 512GB and 1TB RD400 exceed the performance of the 950 Pro at 32KB-8MB. The 1TB RD400 outpaces the 512GB model. The 256GB RD400 outperforms the 256GB 950 Pro handily.
Sequential Read
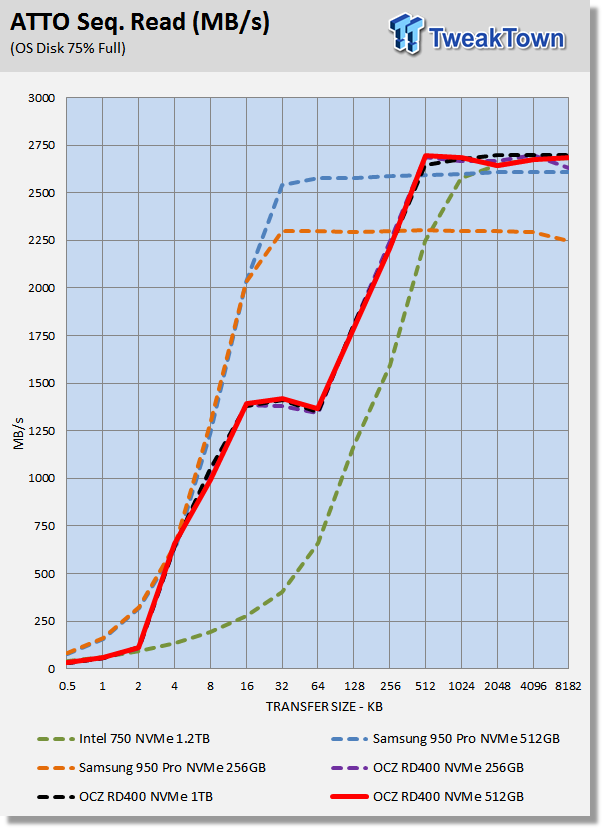
The RD400's all perform similarly when reading sequential data. All three capacity points outperform Intel's best consumer SSD. We observe the RD400's momentary lapse in performance at 32-64KB transfers. This is exactly what we observed when we tested the XG3. Overall the 950 Pro's display a better performance curve.
Anvil Storage Utilities
Version and / or Patch Used: 1.1.0
Anvil's Storage Utilities is a storage benchmark designed to measure the storage performance of SSDs. The Standard Storage Benchmark performs a series of tests; you can run a full test or just the read or write test, or you can run a single test, i.e. 4k QD16.

Scoring

Anvil's scoring gives a good indication of a drive's overall performance. In terms of overall scoring, the RD400's are able to best Samsung's competing solutions. The RD400's superior write performance really adds to the overall score which is the reason their total score exceeds that of the 950 Pro's. This is also the reason Intel's 1.2TB 750 wins this test with a high score of 12.7K. The 950 Pro's display superior read performance, while the Intel 750 displays inferior read performance at consumer queue depths.
(Anvil) Read IOPS through Queue Depth Scale

The RD400's outperform the Intel 750 up to QD16 (consumer queue depth). The Samsung drives display the best performance up to QD16 and QD32. At queue depths above 32, Intel's 750 1.2 TB hits its stride and distances itself from the competition. Realistically, though, it is a rare occurrence when a consumer based SSD hits queue depths of 32 or greater.
(Anvil) Write IOPS through Queue Scale

The Intel's 1.2 TB 750 easily wins this test. The Samsung SSDs max out at QD2-4. The RD400's all display better QD1 write performance than the 950 Pro's and much better write performance overall. Just as it is listed in OCZ's factory specifications, the 256GB RD400 delivers the highest write IOPS of the three capacity points at QD32. We note that we are getting far higher write IOPS at QD32 than factory specifications indicate. We note that at QD8 and above the 256GB RD400 is pumping out double the IOPS of Samsung's 950 Pro 256GB.
Synthetic Benchmarks - CrystalDiskMark & AS SSD
CrystalDiskMark
Version and / or Patch Used: 3.0 Technical Preview
CrystalDiskMark is disk benchmark software that allows us to benchmark 4k and 4k queue depths with accuracy. Note: Crystal Disk Mark 3.0 Technical Preview was used for these tests since it offers the ability to measure native command queuing at QD4.

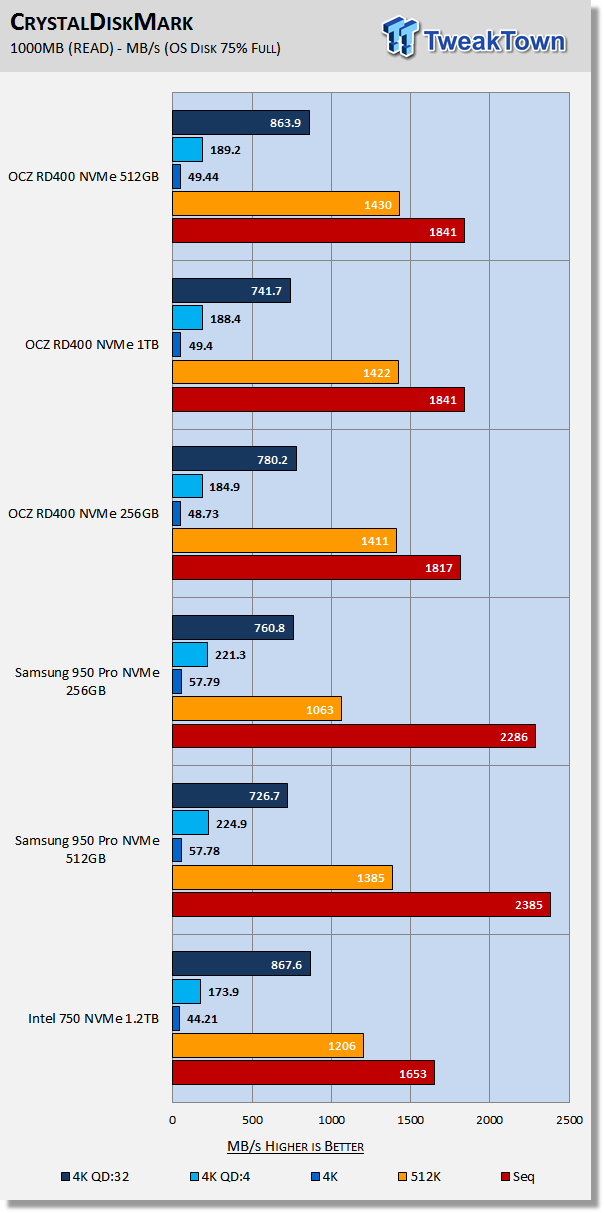
The RD400's kill it with 512K and 4K QD32 transfers. The 950 Pro's display overwhelming sequential read performance at QD1 as well as at 4K QD1-4 random read. Intel's 750 1.2TB displays ever so slightly better 4K QD32 performance than the 512GB RD400.

The 512GB and 1TB RD400 both eviscerate the 512GB 950 Pro across the board. The 256GB RD400 eviscerates the 256GB 950 Pro across the board. Intel's 1.2TB 750 delivers the best 4K random performance of the bunch.
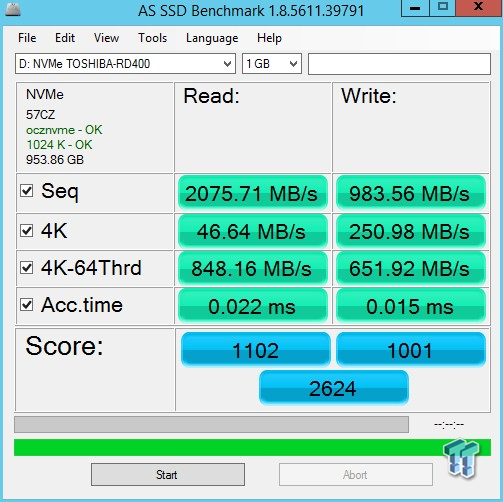
AS SSD
Version and / or Patch Used: 1.7.4739.38088
AS SSD determines the performance of SSDs. The tool contains four synthetic as well as three practice tests. The synthetic tests are to determine the sequential and random read and write performance of the SSD.


AS SSD is a demanding test, and the RD400's lose a significant amount of sequential write performance in comparison to CDM. The 512GB 950 Pro delivers a higher total score than both the RD400 512GB and 1TB model. The 256GB RD400 is able to best the 256GB 950 Pro with a higher total score. The RD400's outscore the 950 Pro on the write portion of this test, however, all three capacity points are handily outperformed by the 950 Pro's on the read portion of the test. Because so much of the total scoring comes from 4K-64Thread performance, Intel's 750 1.2TB crushes the competition by well over a thousand points.
Benchmarks (OS) - PCMark Vantage, PCMark 7 & PCMark 8
Moderate Workload Model
We categorize these tests as indicative of a moderate workload environment.
PCMark Vantage - Hard Disk Tests
Version and / or Patch Used: 1.2.0.0
The reason we like PCMark Vantage is because the recorded traces are played back without system stops. What we see is the raw performance of the drive. This allows us to see a marked difference between scoring that other trace-based benchmarks do not exhibit. An example of a marked difference in scoring on the same drive would be empty vs. filled vs. steady state.
We run Vantage three ways. The first run is with the OS drive 75% full to simulate a lightly used OS volume filled with data to an amount we feel is common for most users. The second run is with the OS volume written into a "Steady State" utilizing SNIA's guidelines. Steady state testing simulates a drive's performance similar to that of a drive that been subjected to consumer workloads for extensive amounts of time. The third run is a Vantage HDD test with the test drive attached as an empty, lightly used secondary device.
OS Volume 75% Full - Lightly Used

OS Volume 75% Full - Steady State

Secondary Volume Empty - FOB

There's a big difference between an empty drive, one that's 75% full/used, and one that's in a steady state.
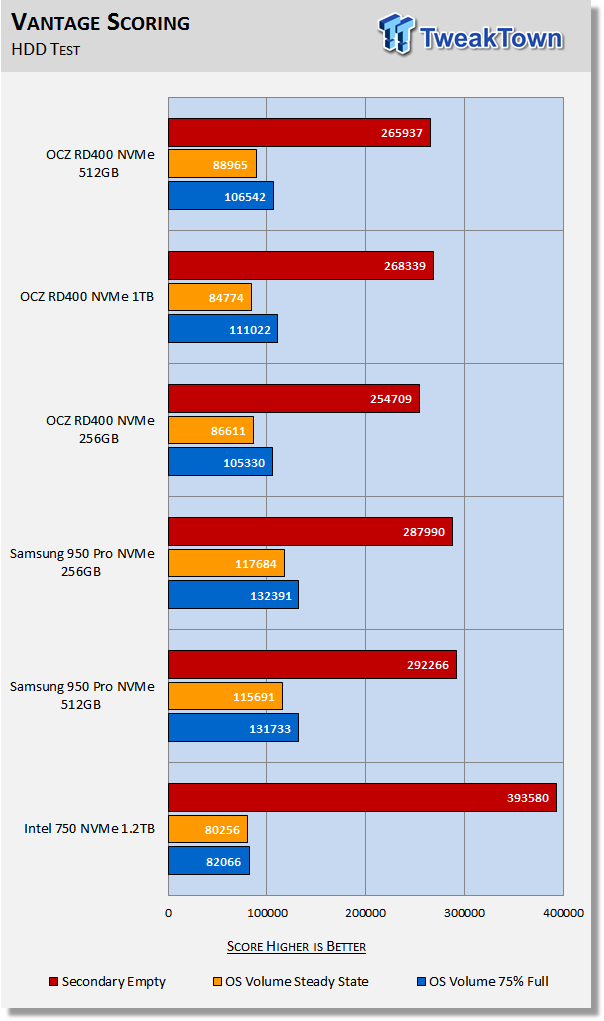
The important scores to pay attention to are "OS Volume Steady State" and "OS Volume 75% full." These two categories are most important because they are indicative of typical consumer user states. When a drive is in a steady state, it means garbage collection is running at the same time it's reading/writing. This is exactly why we focus on steady state performance.
This is the first time a non-Samsung consumer-based SSD has been able to hit over 100K at 75% full. Steady-state performance checks in at 84-88K, which is better than Intel's 1.2TB 750 SSD. Samsung's NVMe SSDs have always dominated our moderate workload testing and it looks like this trend will continue albeit with much less of a cushion than before.
PCMark 7 - System Storage
Version and / or Patch Used: 1.4.0
We will look to Raw System Storage scoring for evaluation because it's done without system stops and, therefore, allows us to see significant scoring differences between drives.
OS Volume 75% Full - Lightly Used
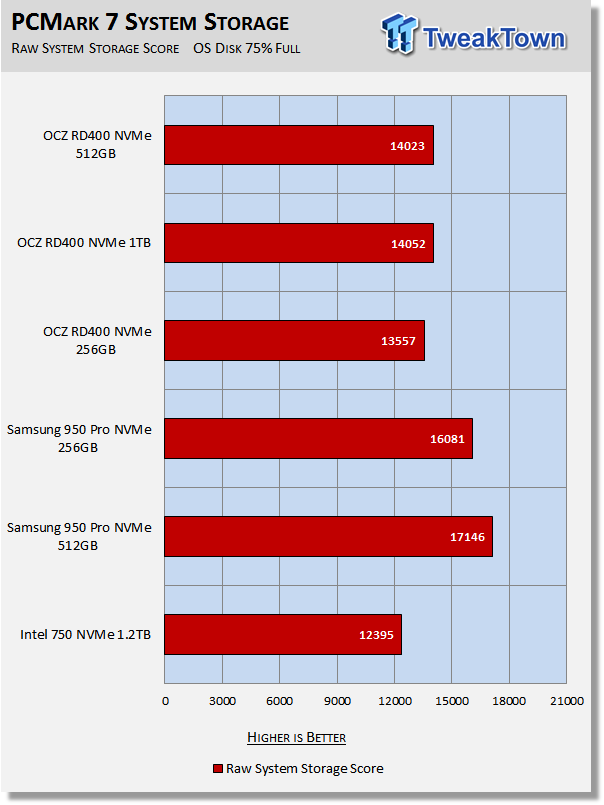
When we tested the XG3 it was able to muster a score of 11,470 which is below that of Intel's 750 1.2TB. The RD400 does indeed perform much better than the XG3 easily defeating Intel's 750 1.2TB SSD at all three capacity points. We attribute better performance to OCZ's proprietary NVMe driver. This makes us wonder if we can use this driver with the XG3. Samsung's offerings continue to display class-leading moderate workload performance due to their superior 4K QD1 read performance.
PCMark 8 - Storage Bandwidth
Version and / or Patch Used: 2.4.304
We use PCMark 8 Storage benchmark to test the performance of SSDs, HDDs, and hybrid drives with traces recorded from Adobe Creative Suite, Microsoft Office, and a selection of popular games. You can test the system drive or any other recognized storage device, including local external drives. Unlike synthetic storage tests, the PCMark 8 Storage benchmark highlights real-world performance differences between storage devices.
OS Volume 75% Full - Lightly Used


PCMark 8 is the most intensive moderate workload simulation we run. With respect to moderate consumer type workloads, this test is what we consider the best indicator of a drive's performance. The RD400's cannot catch Samsung's offerings, but all three capacity points have no trouble dispatching Intel's 1.2TB 750.
Benchmarks (Secondary) - IOPS, Response & Transfer Rate
Iometer - Maximum IOPS
Version and / or Patch Used: Iometer 2014
We use Iometer to measure high queue depth performance. (No Partition)
Max IOPS Read

Max IOPS Write


OCZ's factory specifications list the RD400 as capable of up to 210K random read and up to 140K random write IOPS depending on capacity point. Both of these specifications are given at QD32. We test PCIe drives at QD256. At QD256, with our configuration, we are able to greatly exceed OCZ's given maximum IOPS for both read and write. When we look back at our Anvil's IOPS testing, we find that the 512GB and 1TB models both hit about 220K read IOPS at QD32, the 256GB model 200K. It is important to keep in mind that we ran that test with our drives filled to 75% of their capacity which is a big handicap. Looking at our Anvils write IOPS shows the drives averaging about 180K write IOPS which clearly shows that OCZ is being conservative with their maximum IOPS specifications.
Intel's 750 clearly displays higher max IOPS than the RD400's and the 950 Pro's. The 950 Pro's display better maximum random read performance than the RD400's. The RD400's are capable of double the max write IOPS of the 950 Pro's. It is evident at this point that Samsung's 950 Pro's deliver better read performance than OCZ's RD400 and OCZ's RD400's deliver superior write performance in comparison to the 950 Pro's.
Iometer - Disk Response
Version and / or Patch Used: Iometer 2014
We use Iometer to measure disk response times. Disk response times are measured at an industry accepted standard of 4K QD1 for both write and read. Each test runs twice for 30 seconds consecutively, with a 5-second ramp-up before each test. We partition the drive/array as a secondary device for this testing.
Avg. Write Response
Avg. Read Response

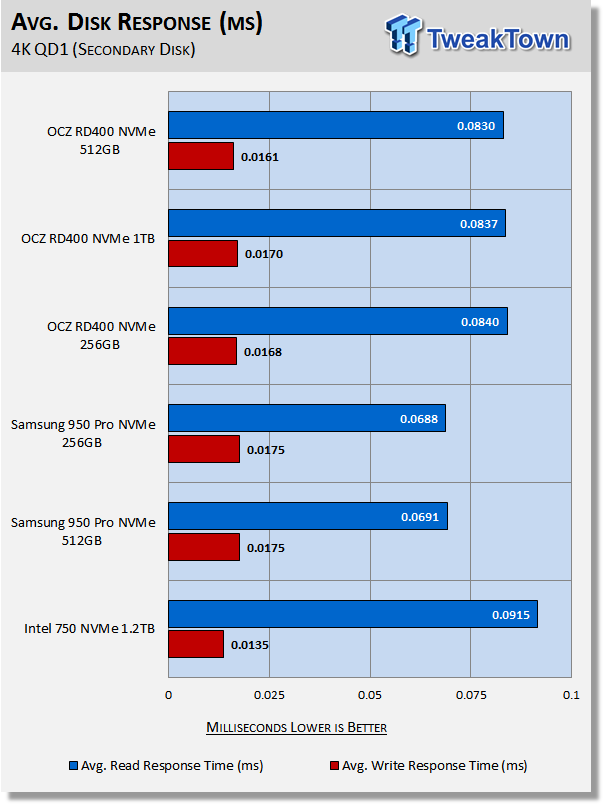
The Samsung drives in our test pool deliver the best (lowest) read latency at QD1. Intel's 750 delivers by far the best write response. Again we see that the RD400's deliver better write performance than the 950 Pro's and the 950 Pro's better read performance than the OCZ drives.
DiskBench - Transfer Rate
Version and / or Patch Used: 2.6.2.0
We use DiskBench to time a 28.6GB block (9,882 files in 1,247 folders) composed primarily of incompressible sequential and random data as it's transferred from our DC P3700 PCIe NVME SSD to our test drive. We then read from a 6GB zip file that's part of our 28.6GB data block to determine the test drive's read transfer rate. Our system is restarted prior to the read test to clear any cached data, ensuring an accurate test result.
Write Transfer Rate

Read Transfer Rate


Throughout our testing one thing has remained consistent, the RD400's deliver better write performance and the 950 Pro's better read performance. However, our transfer testing does not follow this established pattern. All three RD400's deliver better read transfer rates than the 950 Pros. They even deliver better read transfer rates than Intel's 750 1.2TB behemoth. The 256GB RD400 easily dispatches the 950 Pro 256GB with both read and write transfers, which is unexpected. We expected the 256GB 950 Pro to have superior read transfer rate, but it does not - it is 200MB/s slower than the RD400 256GB.
The larger capacity RD400's completely reverse the established pattern. They both deliver better read transfer rates than the 512GB 950 Pro, but lower write transfer rates. As expected, Intel's 750 provides the best write transfer rates of our test pool.
Benchmarks (Secondary Volume) - PCMark 8 Extended
Futuremark PCMark 8 Extended
Heavy Workload Model
PCMark 8's consistency test simulates an extended duration heavy workload environment. PCMark 8 has built-in, command line executed storage testing. The PCMark 8 Consistency test measures the performance consistency and the degradation tendency of a storage system.
The Storage test workloads are repeated. Between each repetition, the storage system is bombarded with a usage that causes degraded drive performance. In the first part of the test, the cycle continues until a steady degraded level of performance has been reached. (Steady State)
In the second part, the recovery of the system is tested by allowing the system to idle and measuring the performance after 5-minute long intervals. (Internal drive maintenance: Garbage Collection (GC)) The test reports the performance level at the start, the degraded steady-state, and the recovered state, as well as the number of iterations required to reach the degraded state and the recovered state.
We feel Futuremark's Consistency Test is the best test ever devised to show the true performance of solid state storage in an extended duration heavy workload environment. This test takes on average 13 to 17 hours to complete and writes somewhere between 450GB and 14,000GB of test data depending on the drive. If you want to know what an SSDs steady state performance is going to look like during a heavy workload, this test will show you.
Here's a breakdown of Futuremark's Consistency Test:
Precondition phase:
1. Write to the drive sequentially through up to the reported capacity with random data.
2. Write the drive through a second time (to take care of overprovisioning).
Degradation phase:
1. Run writes of random size between 8*512 and 2048*512 bytes on random offsets for 10 minutes.
2. Run performance test (one pass only).
3. Repeat 1 and 2 for 8 times, and on each pass increase the duration of random writes by 5 minutes.
Steady state phase:
1. Run writes of random size between 8*512 and 2048*512 bytes on random offsets for 50 minutes.
2. Run performance test (one pass only).
3. Repeat 1 and 2 for 5 times.
Recovery phase:
1. Idle for 5 minutes.
2. Run performance test (one pass only).
3. Repeat 1 and 2 for 5 times.
Storage Bandwidth
PCMark 8's Consistency test provides a ton of data output that we use to judge a drive's performance.

We consider steady state bandwidth (the blue bar) our test that carries the most weight in ranking a drive/arrays heavy workload performance. Performance after Garbage Collection (GC) (the orange and red bars) is what we consider the second most important consideration when ranking a drive's performance. Trace-based steady state testing is where true high performing SSDs are separated from the rest of the pack.
The 950 Pro's both outperform the RD400's at their respective capacity points. The 1TB RD400 delivers the best performance of the OCZ drives. Intel's 750 beats the 950 Pro at steady five, but this chart does not tell the whole story. The next chart paints a different picture.
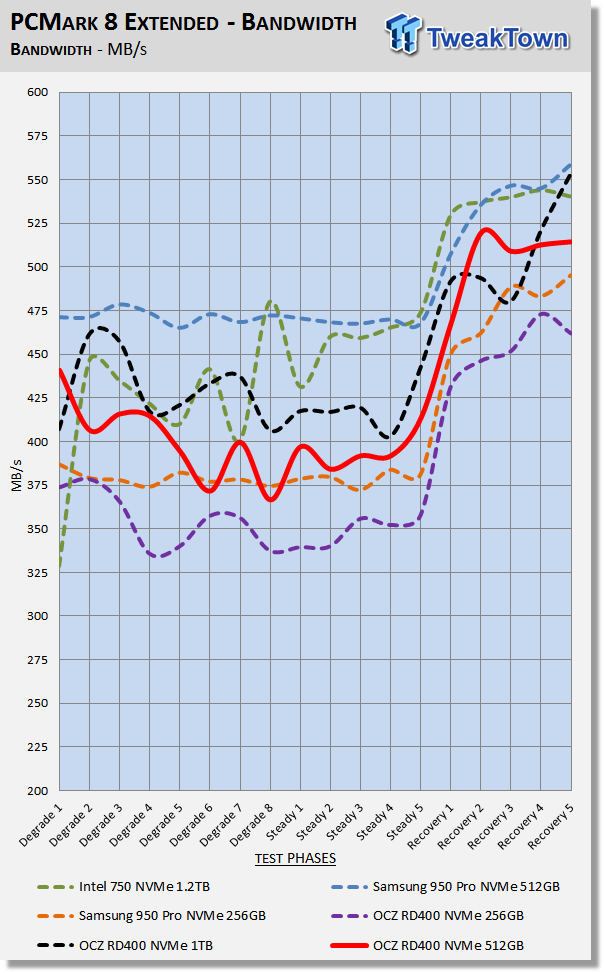
We chart our test subject's storage bandwidth as reported at each of the test's 18 trace iterations. This gives us a good visual perspective of how our test subjects perform as testing progresses. This chart sheds more light on how the drives perform as they progress through the testing phases. Although the 750 squeaks out a win at steady five, we can see that the 950 Pro 512GB consistently delivers more storage bandwidth for most of the testing phases.
Total Access Time (Latency)
We chart the total time the disk is accessed as reported at each of the test's 18 trace iterations.

In terms of total latency, the RD400's perform better than the 950 Pro's. Intel's 750 Series SSD delivers the lowest overall latency. We measure the total combined read/write access times for this testing which is why the result may not translate directly to how snappy the drive feels to the end-user. In this case, it does not. Of the drives in our test pool, the Intel 750 feels the least responsive to the end-user. The 950 Pro and the RD400 feel about the same with a slight edge going to the 950 Pro. We believe that this is because snappiness to the end-user is mostly a function of low QD read latency, and both the RD400 and the 950 Pro have better performance than the Intel 750 in this metric.
Disk Busy Time
Disk Busy Time is how long the disk is busy working. We chart the total time the disk is working as reported at each of the tests 18 trace iterations.
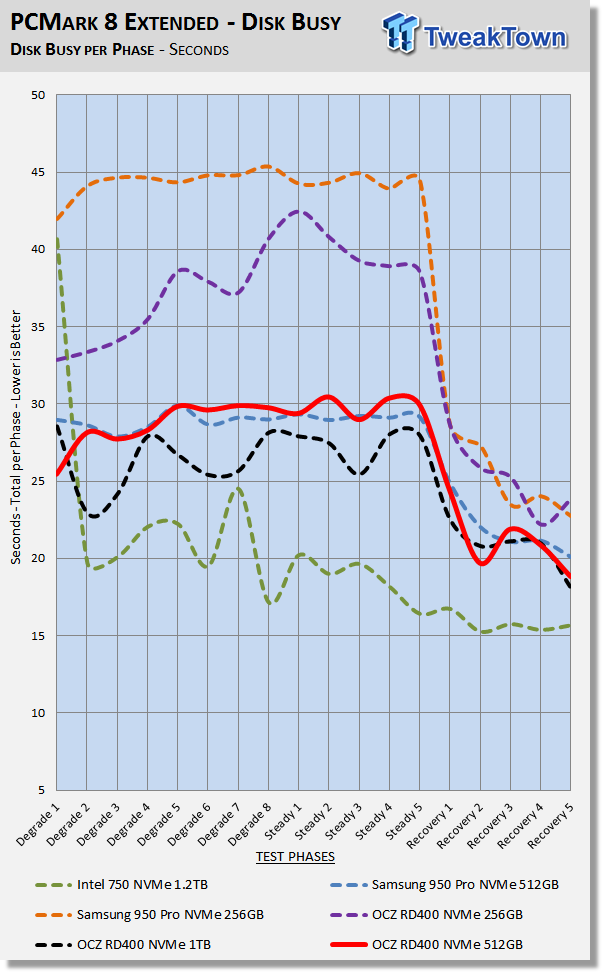
When latency is low, disk busy time is low as well.
Data Written
We measure the total amount of random data that our test drive/array is capable of writing during the degradation phases of the consistency test. Pre-conditioning data is not included in the total. The total combined time that degradation data is written to the drive/array is 470 minutes. This can be very telling. The better a drive/array can process a continuous stream of random data; the more data will be written.
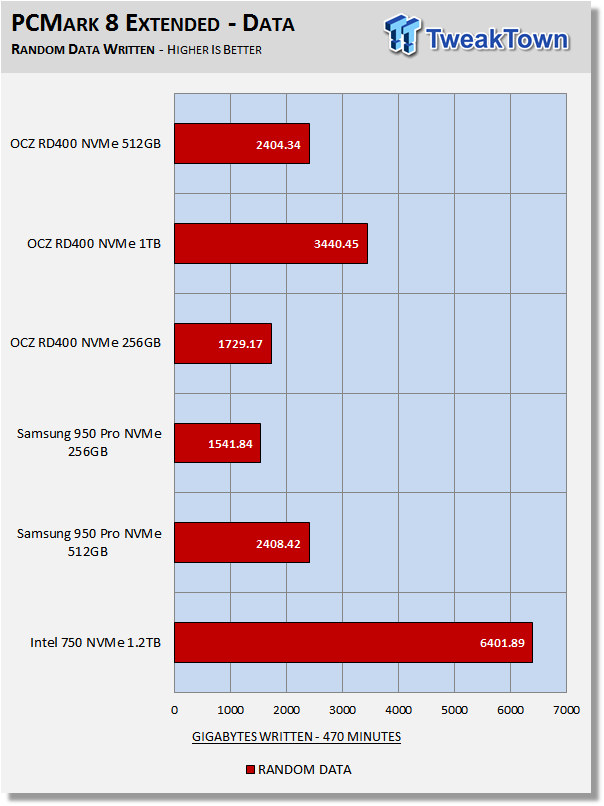
Overprovisioning and write latency are the biggest factors that determine the outcome of this portion of the test. Of the drives in our test pool, only the Intel 750 is overprovisioned, and as a result, it is able to write more data than the competition. The 256GB RD400 has better write latency than the 256GB 950 Pro and as such is able to write more data. The 512GB RD400 and 512GB 950 Pro are evenly matched. The 1TB RD400, with its capacity advantage, is able to write more data than the rest of the non-overprovisioned drives in our test pool.
Benchmarks (Secondary Volume) – 70/30 Mixed Workload
70/30 Mixed Workload Test (Sledgehammer)
Version and / or Patch Used: Iometer 2014
Heavy Workload Model
This test hammers a drive so hard we've dubbed it "Sledgehammer". Our 70/30 Mixed Workload test is designed to simulate a heavy-duty enthusiast/workstation steady-state environment. We feel that a mix of 70% read/30% write, full random 4K transfers best represents this type of user environment. Our test allows us to see the drive enter into and reach a steady state as the test progresses.
Phase one of the test preconditions the drive for 1 hour with 128K sequential writes. Phase two of the test runs a 70% read/30% write, full random 4K transfer workload on the drive for 1 hour. We log and chart (phase two) IOPS data at 5-second intervals for 1 hour (720 data points). 60 data points = 5 minutes.

What we like about this test is that it reflects reality. Everything lines up, as it should. Consumer drives don't outperform Enterprise-Class SSDs that were designed for enterprise workloads. Consumer drives based on old technology are not outperforming modern Performance-Class SSDs, etc.
Intel's 750 dominates this brutal test which comes as no surprise considering the 750's enterprise DNA. The 1TB RD400 delivers the second best performance of the bunch. The 512GB RD400 and the 512GB 950 Pro are evenly matched. The 256GB 950 Pro is handily outperformed by the RD400 256GB.
Maxed-Out Performance (MOP)
This testing is just to see what the drive is capable of in an FOB (Fresh Out of Box) state under optimal conditions. We are utilizing Windows Server 2012 R2 64-bit OS for this testing. Same Hardware, just an OS change.
RD400 256GB


RD400 512GB


RD400 1TB


Final Thoughts

As SATA SSD's fade into the sunset with nothing more to offer in terms of performance, NVMe PCIe SSDs are just beginning to flex some muscle. From an enthusiast's perspective, anything less than NVMe just doesn't cut it any more. We are delighted to finally have a legitimate alternative to Samsung's 950 Pro simply because it's never a good thing for one product to totally dominate the competition. OCZ's RD400 just about levels the playing field, which is great for consumers, because it helps drive innovation forward expanding the performance envelope.
We aren't totally surprised by how well OCZ's RD400 performs, after all we had the privilege of testing Toshiba's OEM version, so we knew the RD400 was going to make some noise. We speculated that the RD400 would give Samsung's 950 Pro a run for the money, and it does not disappoint. We feel that moderate workload performance is the best measurement of an SSDs performance in an enthusiast environment; in that respect, the 950 Pro has a bit of an edge over the RD400. However, if we factor in price point, transfer rates, sequential performance, and included M.2 to AIC adapter, that edge just about disappears. If we take things a step further and factor in available capacity points, then the edge goes to OCZ's RD400, simply because we feel that 512GB doesn't fully satisfy our need for capacity anymore.
Our user experience while running the RD400 as our OS disk is really as good as it gets. Even though the RD400 is OCZ's first stab at a consumer-based NVMe SSD, the RD400 is a polished piece of hardware. All three drives we reviewed performed flawlessly in every aspect and we didn't just test with empty secondary volumes, we installed Windows, drivers, and programs from scratch on each of the three drives we tested.
OCZ has covered every conceivable facet of SSD ownership with the RD400. You get the industry's best warranty, the industry's most comprehensive SSD maintenance software complete with a bootable option, M.2 to AIC adapter, and OCZ's performance enhancing proprietary NVMe driver that that can be F6 loaded with Windows 7. OCZ's RevoDrive 400 is more than just another SSD, it's the complete package.
OCZ's RevoDrive 400 M.2 NVMe PCIe SSD is TweakTown recommended.
Pros:
- Performance
- Capacity
- Build Quality
- Most Appealing Form Factor
Cons:
- None
 UGREEN NASync DXP4800 GT Review: powerful 4-bay NAS with AMD Ryzen and dual 10GbE ports
 Phison E37T SSD Controller Exclusive Preview - The Fastest DRAMless SSD Platform Yet
 Seagate FireCuda X1070 4TB SSD Review - A New Mainstream Contender
 ASUSTOR Lockerstor 2 Gen2+ AS6702T v2 NAS Review - Fast Performance
 TERRAMASTER D1 SSD Pro Thunderbolt/USB Portable Enclosure Review - Incredible Potential
 First 30 minutes of Assassin's Creed Black Flag Resynced just got leaked
 PlayStation and Xbox record their worst May in decades after recent price increases
 'Get used to it,' says Lenovo as it expects high memory prices to remain the norm until at least 2030
 GTA 6 disc version not coming after all, sources say Rockstar Support email was misinterpreted
 Intel's dual-tile Nova Lake-S CPUs reportedly carry a 474W PL2 target, according to leaked Z990 power guidance
 Micron has signed agreements locking in record-high memory prices with major customers through 2030
 Analyst believes Call of Duty, EA FC, and NBA 2K will move to $80 pricing
 Valve engineers claim release cadence for future Steam Machine versions will be shorter than the Steam Deck
 AMD engineer builds a Steam Machine competitor with a 3D printer, has an RTX 5060 inside
 Lian Li B4-mATX Review: a compact mATX SFF case with excellent airflow and premium features
 MSI MPG 322UR QD-OLED X24 Review: A Brighter, Tougher 4K 240Hz QD-OLED for $1099
 Dell XPS 14 (2026) Laptop Review - Premium Quality, Impressive Performance
 Ocypus Sigma F36 BK ARGB Cooling Fan Review: high airflow and unified design in one frame
 PCCooler CPS RZ820 Display Review: a flagship-level CPU air cooler with an LCD screen
 Speed Racer (2008) 4K Ultra HD Blu-ray Review: a stunning remaster of the cult classic
 MOAIPLAY ORA PRO G1 850W ATX 3.1 PSU Review: high efficiency and 10-year warranty for $119.99
 Navman MiVue Smart True 4K Surround Dashcam Review - Seeing In All Directions At Once
 How to fix Wi-Fi Adapter Not Working on Windows laptops: troubleshooting tips
 Hisense U7SG 4K TV: Modern Entertainment for the New Age
 6 underrated Microsoft Word features worth using to boost your productivity
 Level Up Your PC Gaming with these Fantastic ASUS Prime Day Deals on GPUs, Motherboards, and More
 GIGABYTE Wants to Kickstart Your New Gaming PC or Upgrade with These Limited-Time Deals
 7 Windows settings to change right after installation for better privacy, security, and performance
 I stopped Windows 11 notifications from interrupting me with Do Not Disturb, Focus, and a priority list
 I read the Windows Backup app screen carefully, and it does not back up what most people think
 Low Sound Volume on Windows 11? How to fix audio issues and restore normal volume