


Our Verdict
Pros
- In socket upgrade
- Reduced power consumption
- Slightly improved gaming performance over 13th gen
- $100 price drop over Core i9-13900K
Cons
- Needs decent cooling
Should you buy it?
Introduction and Pricing
It's been nearly a year since Intel dropped its 13th Generation "Raptor Lake" offerings to the market, which was quite successful overall, with Intel still holding a solid 68% market share in the desktop CPU market. That being said, the PC market has slowed significantly within the last year, allowing Intel one last trip around the bases with its Intel 7 architecture, today introducing its 14th Generation Raptor Lake Refresh line of CPUs. We look first at the Core i9 14900K, which at a glance doesn't offer much over last year's 13900KS, but digging deeper minor changes has allowed overall better efficiency.
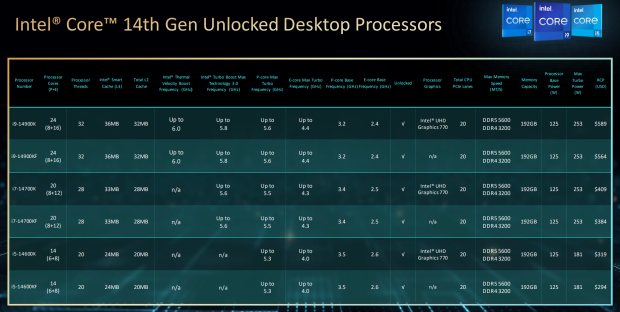
Above, we have the product stack being released today, the 14900K being the offering we are focusing on in this review. This gives us eight performance cores and sixteen efficiency cores for a total of 24 cores, add in hyper-threading on the P-cores, and we have a total of 32 threads, while cache has stayed the same as last gen with 32MB of L2 and 36MB of L3. Clock speeds have been boosted; the 14900K now offers a 6GHz single-core TVB and a peak boost clock of 5.6GHz on the P-cores and 4.4GHz for the E-cores. Processor graphics remain unchanged with the UHD 770 alongside 20 CPU PCIe lanes.
Memory support officially includes DDR5 5600 and DDR4 3200, with the maximum capacity at 192GB. Power numbers for the 14900K give us a 125W power number alongside a max turbo power of 253W. The MSRP of the Intel Core i9 14900K comes in at $589, the same price as last year's 13900K.
Test System and the 14900K
Test System
- Motherboard: GIGABYTE AORUS Z790 Master X - Buy from Amazon
- GPU: AMD Radeon 7900 XTX - Buy from Amazon
- RAM: Patriot Viper Xtreme 5 7600MHz CL36 - Buy from Amazon
- Cooler: EKWB Nucleus 240 - Buy from Amazon
- OS Storage: Crucial T700 2TB - Buy from Amazon
- Power Supply: Corsair HX1500i - Buy from Amazon
- OS: Microsoft Windows 11 Pro - Buy from Amazon
Core i9 14900K

Best Deals: Intel Core i9-14900K "Raptor Lake Refresh" CPU
Price Trend:
Prices last scanned 11 hours and 49 minutes ago
7 days ago: $469 USD
7 days ago: $499.99 USD30 days ago: $469 USD
7 days ago: $749.99 CAD30 days ago: $679.99 CAD
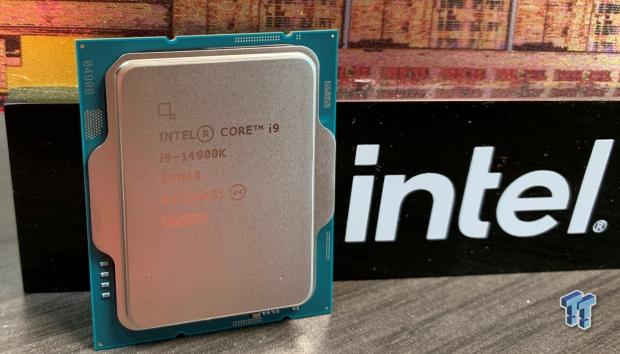
Unboxing, we have the 14900K in its own retainer.
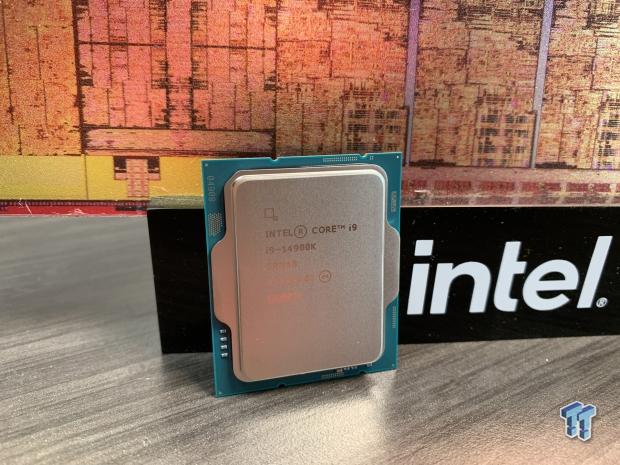
Removing the CPU, we have a nearly identical layout to the 13th Gen as far as resistors and caps are concerned; the CPU uses the same LGA1700 socket.
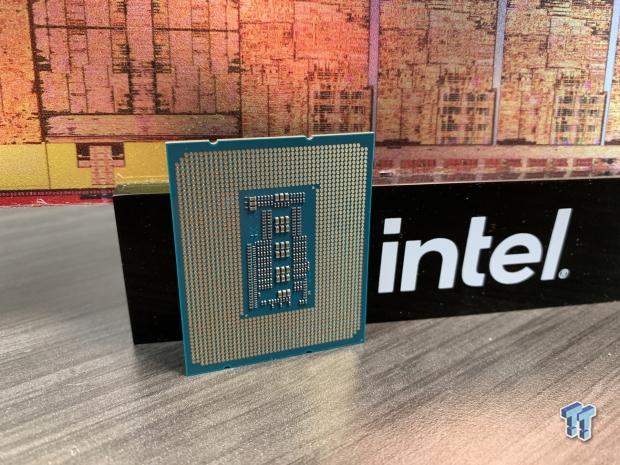
The backside offers 1700 pins, again the same layout as 13th Gen.
Cinebench, Crossmark and AIDA64
Cinebench R23
Cinebench is a long-standing render benchmark that has been heavily relied upon by both Intel and AMD to showcase their newest platforms during unveils. The benchmark has two tests: a single-core workload utilizing one thread or 1T. There is also a multi-threaded test which uses all threads or nT of a tested CPU.
Our Latest Intel CPUs Review Coverage
- Intel Arc G3 Extreme first impressions with MSI's Claw 8 EX AI+ - Incredible power for an extreme price
- Intel Core Ultra 5 250K Plus CPU Review - Shaking up the entry-level
- Intel Core Ultra 7 270K Plus CPU Review - The 285K is now obsolete
- Intel Core Ultra 9 285HX vs. 285K CPUs Head-to-Head - Desktop Power in a Laptop Form Factor
- Intel Core Ultra 5 245K Processor Review - Team Blue Has Seen Better Days
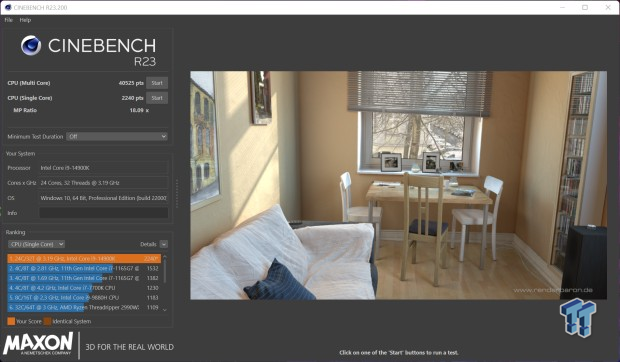
Kicking off our testing of the 14900K, our CPU gets its first passes with R23. As seen above, we picked up 2240 in the single thread and 40525 in the multi-thread tests.
Cinebench 2024
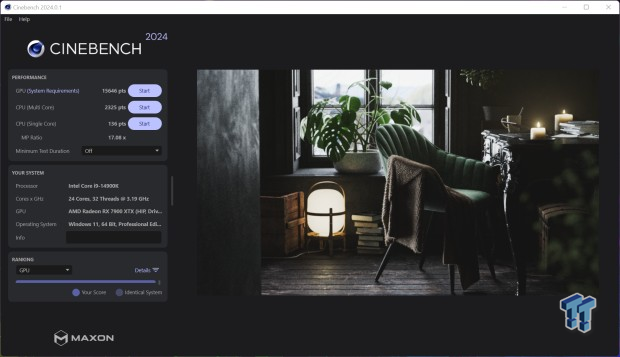
Cinebench 2024 is the newest installment in the series. Our 14900K picked up a score of 136 for single thread and 2325 in multi-thread.
Crossmark
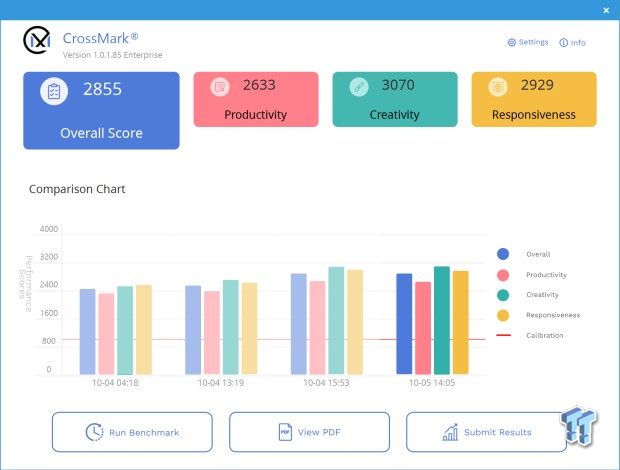
CrossMark gave us an overall score of 2855, a near 100-point jump over KS.
AIDA64
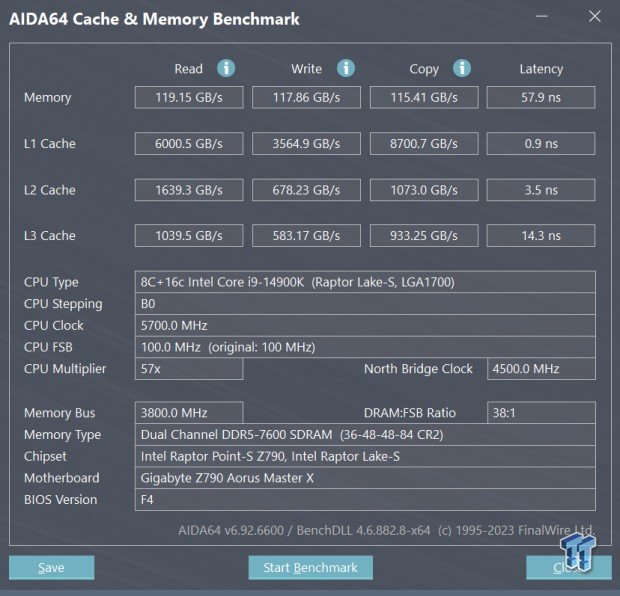
AIDA64 showed some solid gains in memory performance at 7600MHz. 119 GB/s read, 117 GB/s write and 115 GB/s copy. The latency was quite good on the Master X at 57.9ns.
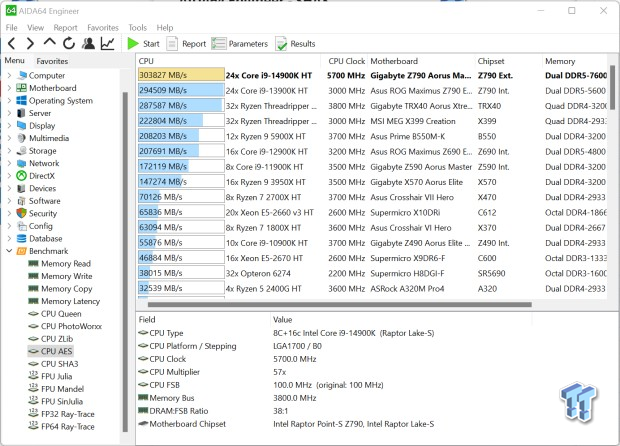
AES came in at 303827.
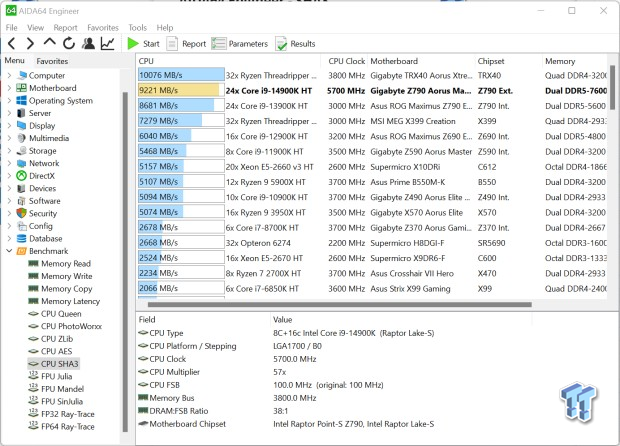
9221 was our SHA3 score.
WEBXPRT4 and UL Benchmarks
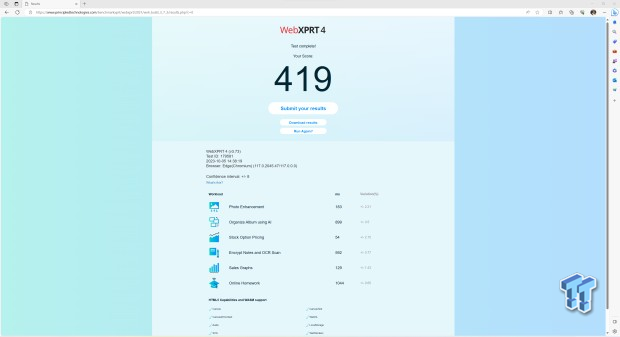
Getting into more real-world workloads, we ran the 14900K through WebXPRT4, ending with a score of 419, about 50 points higher than 13900KS.
UL Procyon
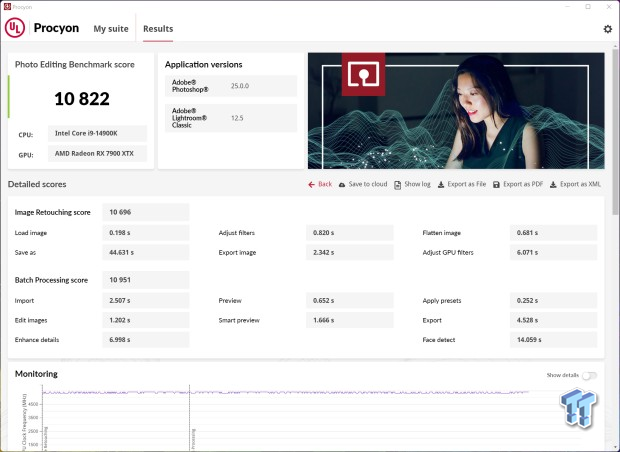
Photo Editing was our first Procyon workload, with the 14900K coming away with a score of 10822.
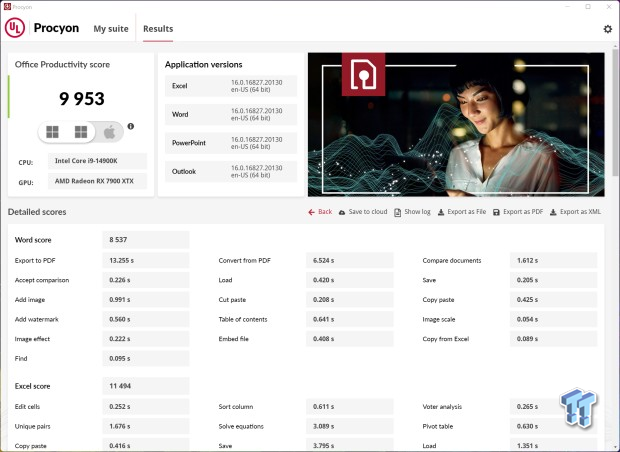
Office Productivity landed at 9953.
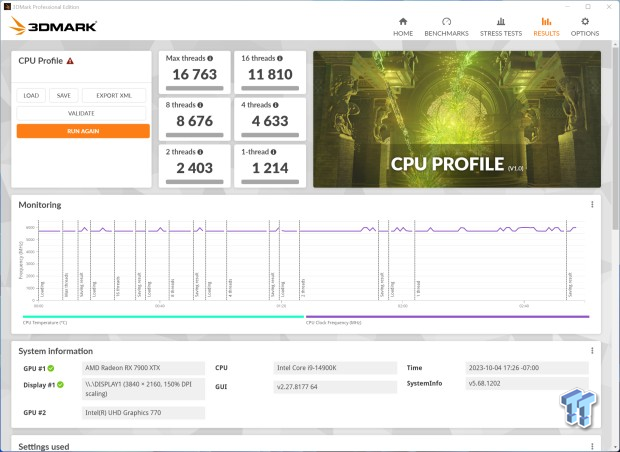
Switching to 3DMark, we kick things off with CPU Profile, the 14900K landing at 1214 single thread and 16763 max threads.
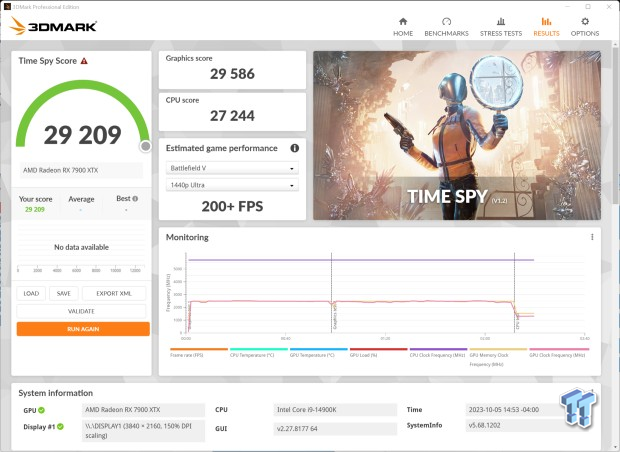
In gaming workloads, the 14900K landed at 29209 overall in Time Spy - 27244 for the CPU.
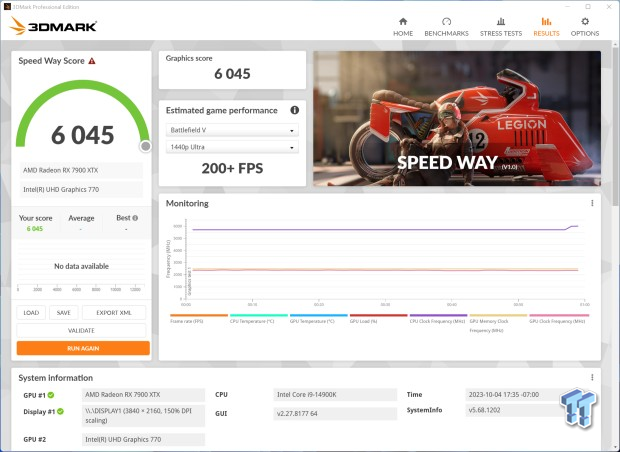
Speed Way scored 6045.
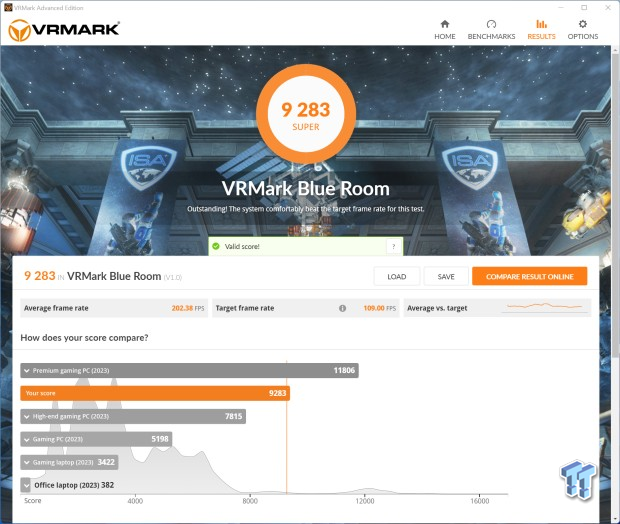
Adding in VRMark this year, we used the Blue Room test - the 14900K landing at 9283.
Comparisons
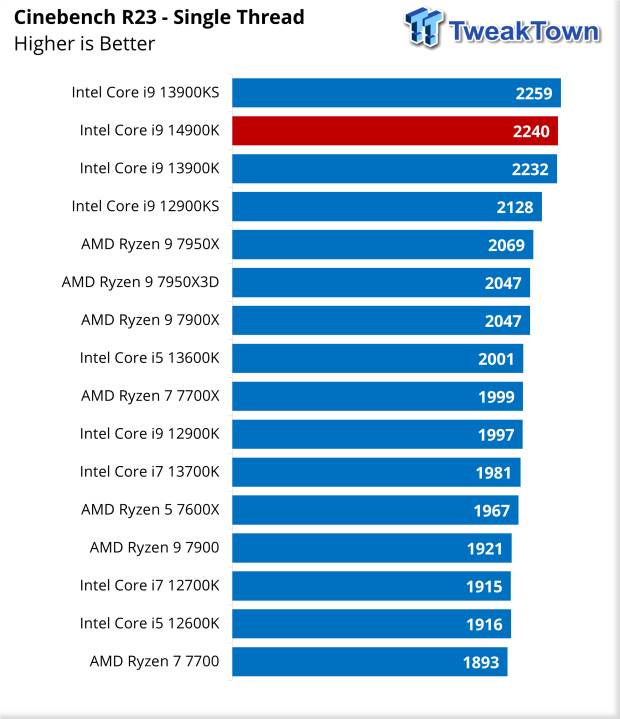
Diving straight into our comparisons, the 14900K is a touch better than the 13900K from last year but did lag behind our testing of the 13900KS, as seen above.
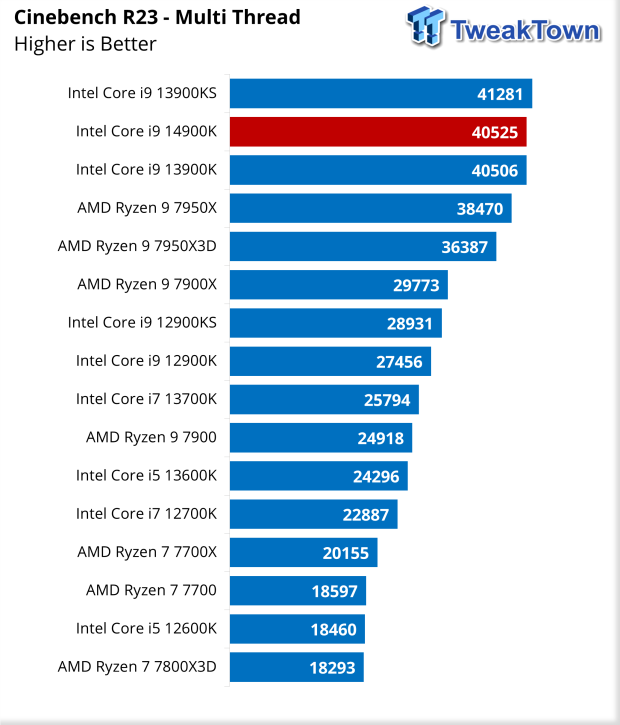
Moving our workload to nT, the 14900K picked up 40525, which was still second to the 13900KS.
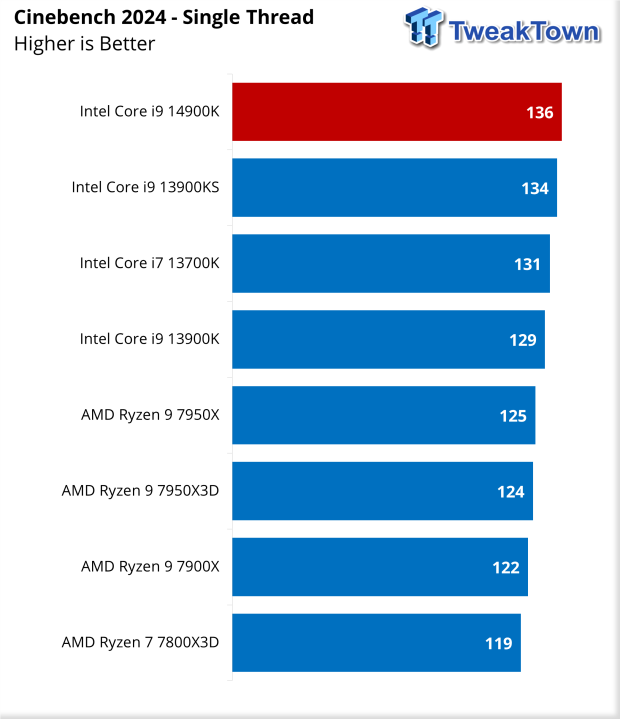
CB 2024 did land the 14900K on top in single thread, scoring 136.
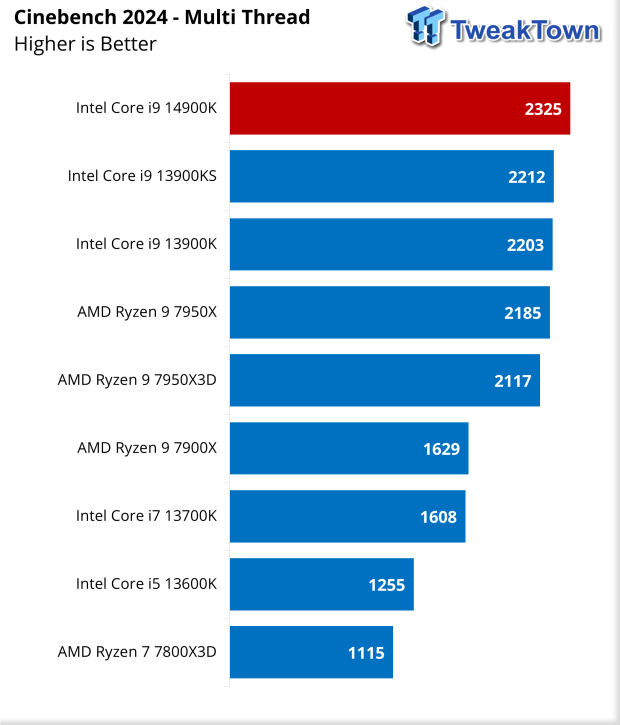
We did get more of a performance gap in multi-thread, the 14900K offering 2325, about 110 points over the 13900KS.
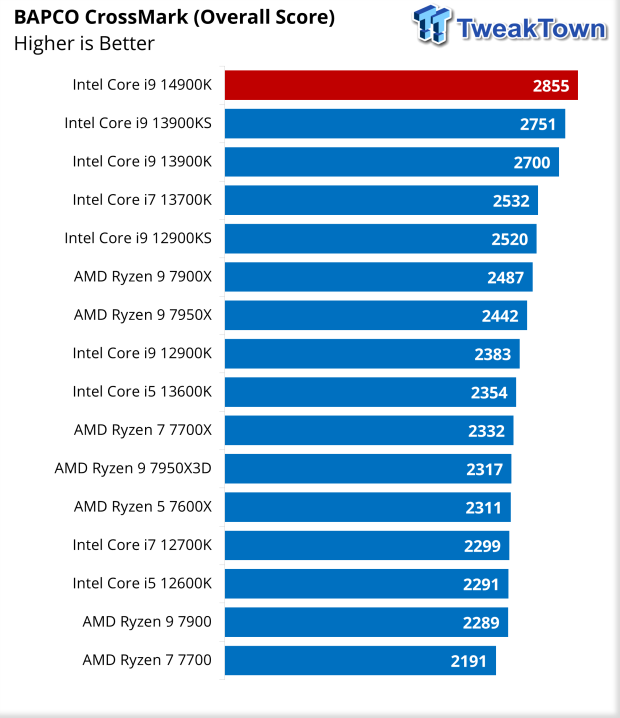
CrossMark comparisons show the 14900K on top by about 100 points.
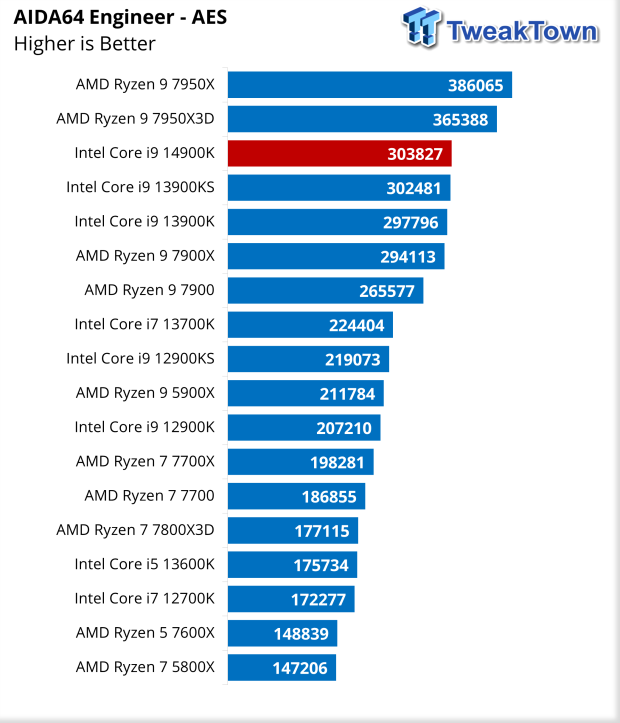
Getting to AIDA, the 7950X remains the top dog in AES, while the 14900K does take a small advantage over the 13900KS.
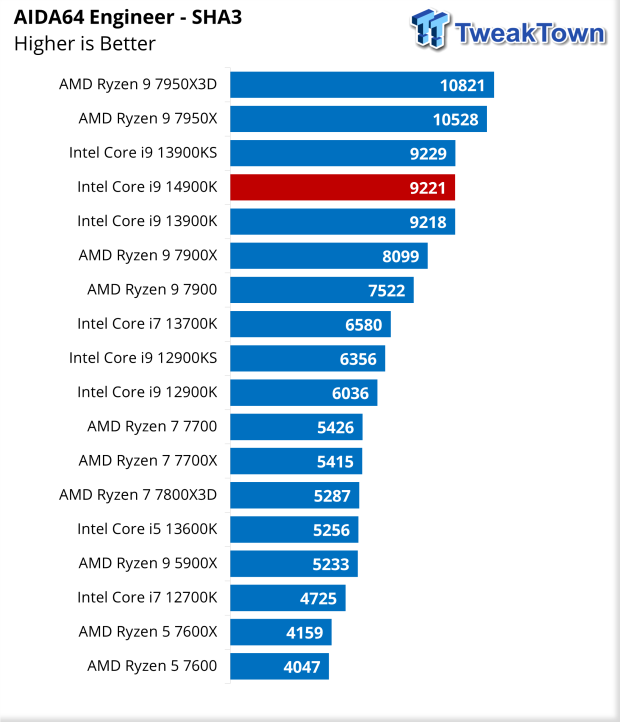
SHA3 shows the 13900KS still with a small advantage over the 14900K, about a 120-point separation.
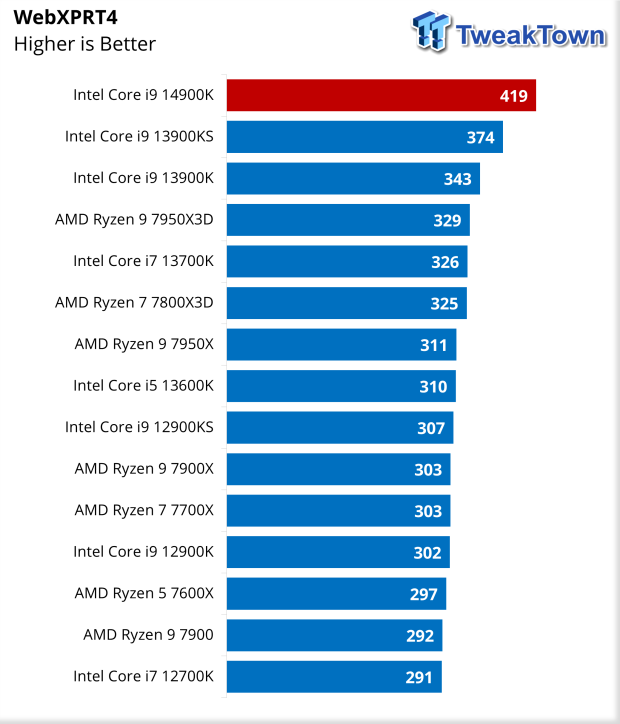
WebXPRT gives the gold to the 14900K with a score of 419, a substantial increase over the 343 offered by the 13900K or 374 of the KS.
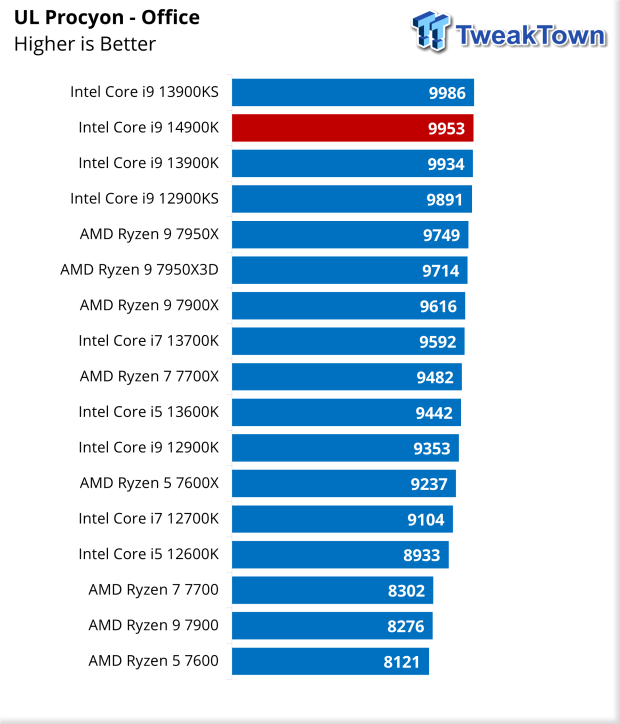
Switching to real-world workloads, our comparisons for Procyon Office put the 14900K with the 13900KS, with 30 points separating them.
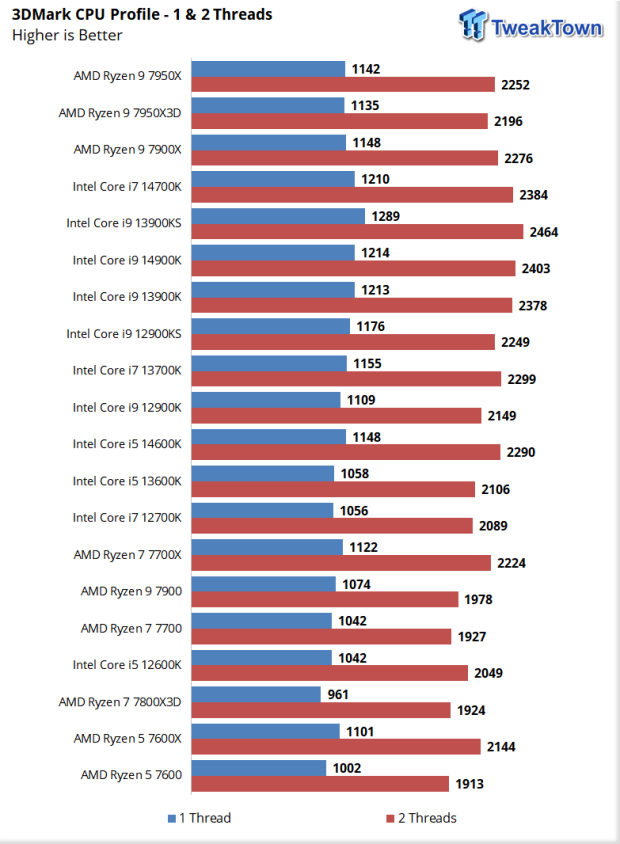
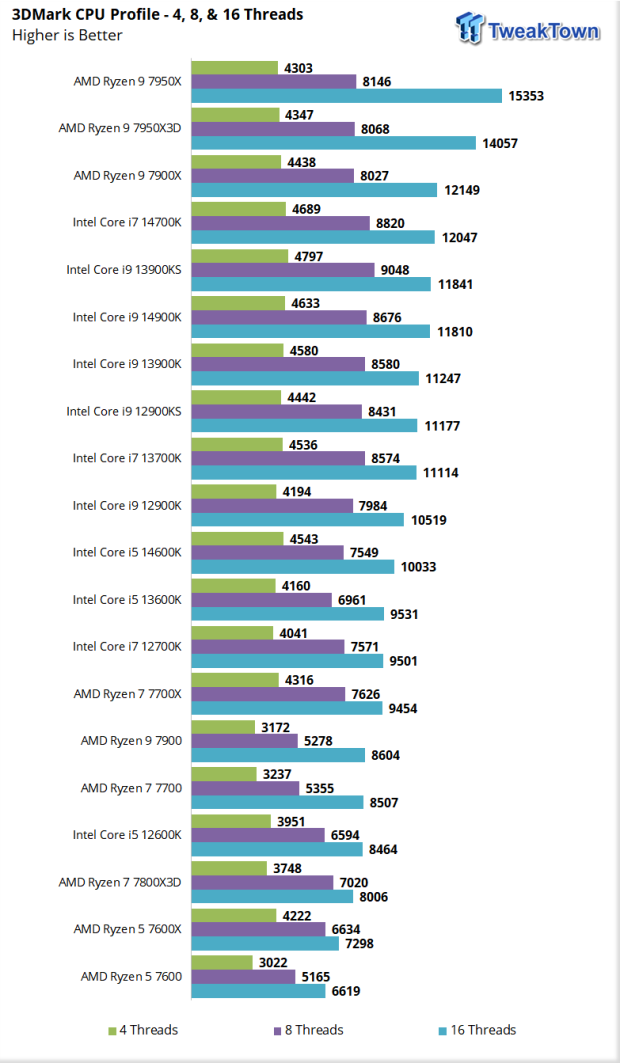
3DMark CPU Profile lands our 14900K in the 5th spot, right behind the 13900KS.
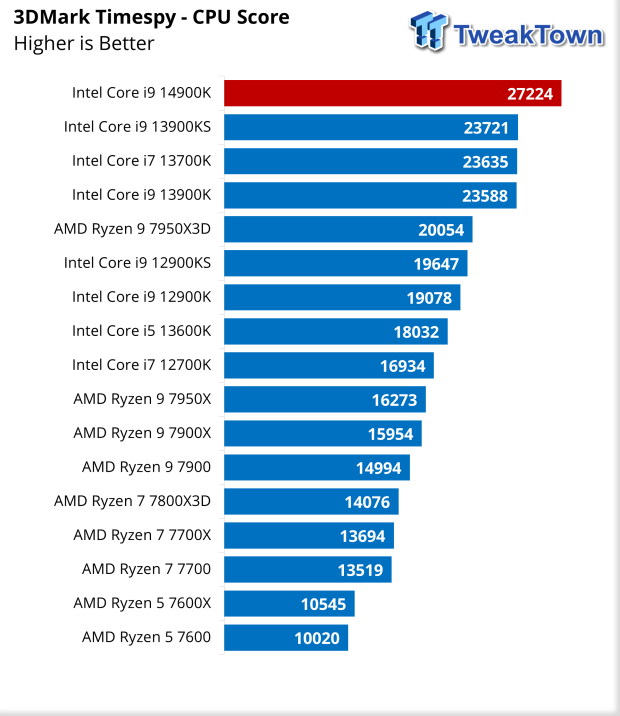
Time Spy did get a very nice bump with the 14900K, with the CPU score at 27224.
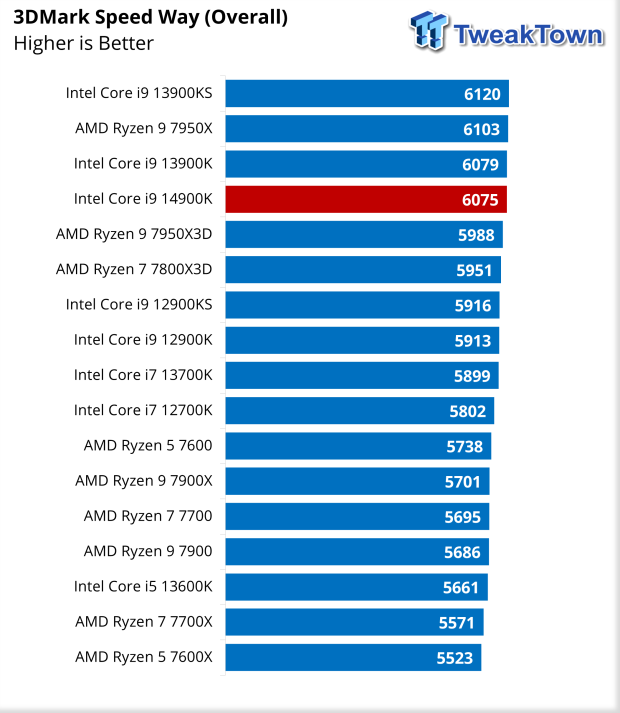
Speed Way, however, landed the 14900K in the fourth spot, behind the 13900K and KS.
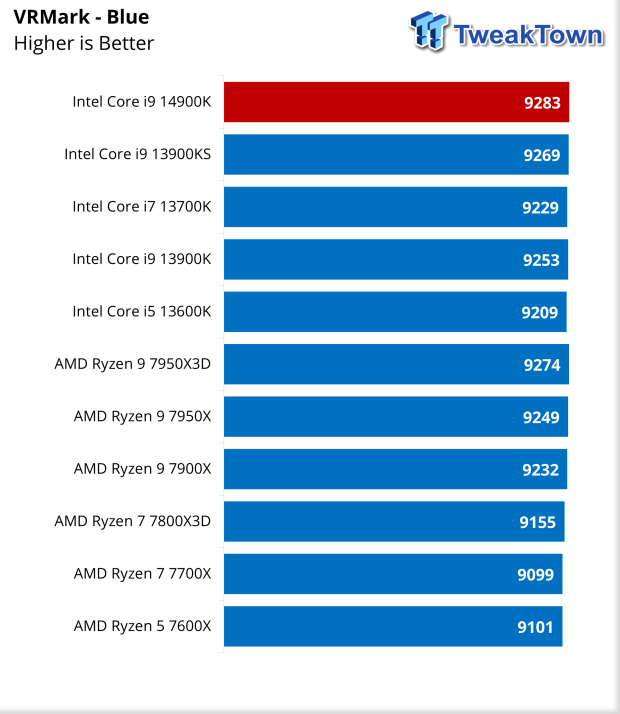
VRMark Blue put 14900K at the top of our charts with a score of 9283, the KS not far behind at 9269.
Gaming Performance
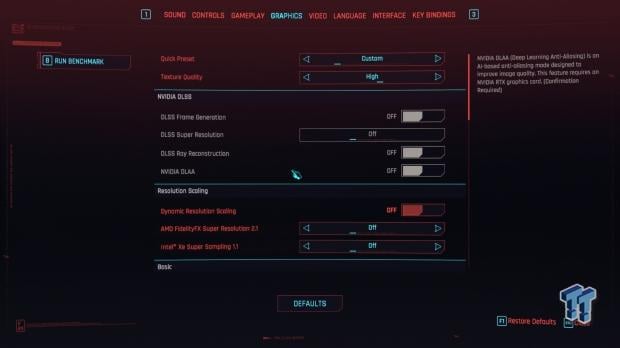
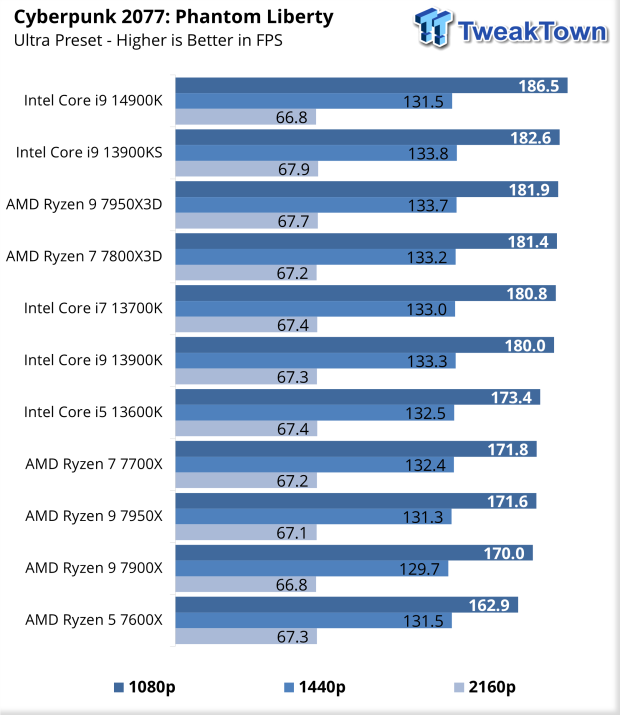
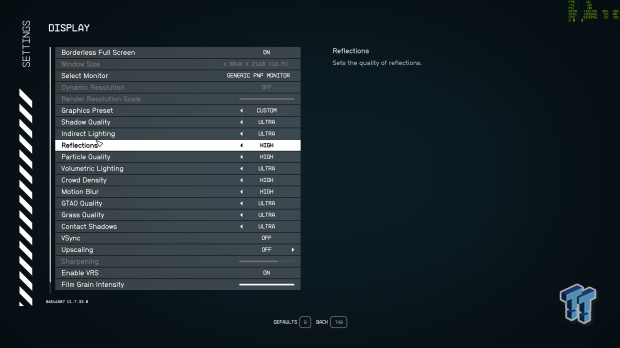
Above are our settings and results in Phantom Liberty. The 14900K did quite well, offering 186 FPS peak at 1080p and 131 FPS at 1440p. 4K seems to be the big equalizer among CPUs; nearly every CPU we retested landed at 67 FPS.
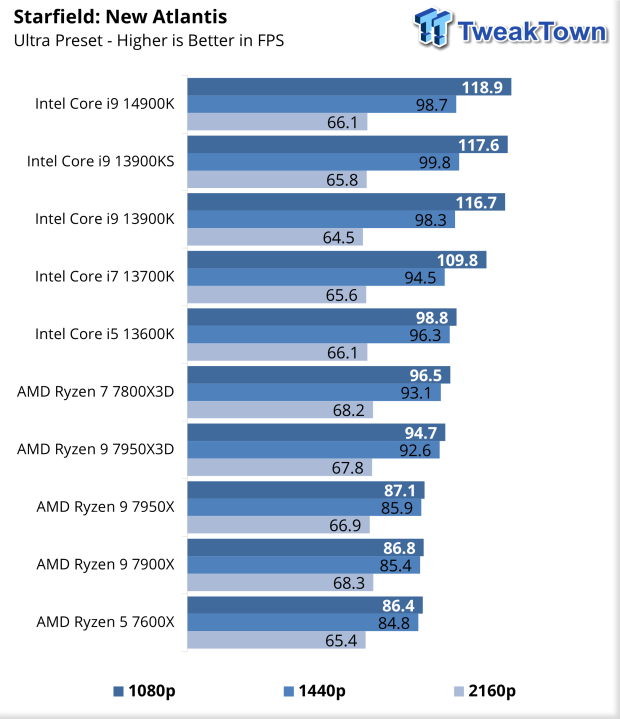
In Starfield, Intel seemingly pulling away here with the 14900K offering 118 FPS at 1080p. 98 FPS at 1440p and 4K again being the equalizer with 65-66 FPS across the board.
Power Consumption, Value, and Final Thoughts
Power
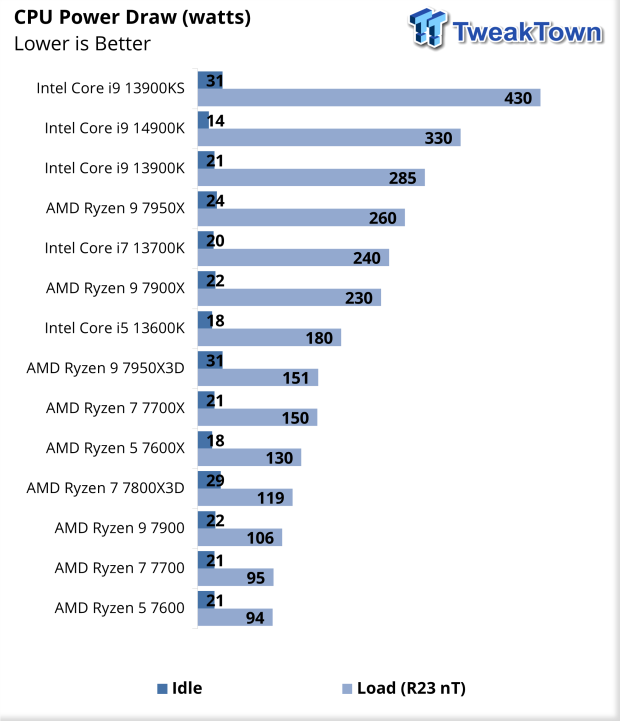
Testing the 14900K, we noted a significant drop in peak power. 330 watts for the 14900K, measured CPU only from the dual 8-pin power connector on our motherboard. This is 100 watts lower than the 13900KS but 45 watts higher than the 13900K.
Value
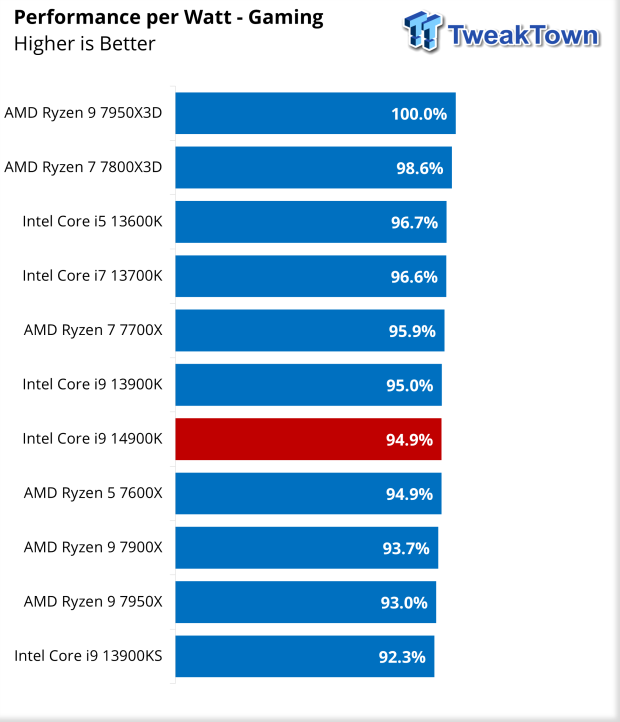
Looking at Performance per Watt in gaming, the 14900K is middle of the pack at 94.9%, dead on with the 13900K.
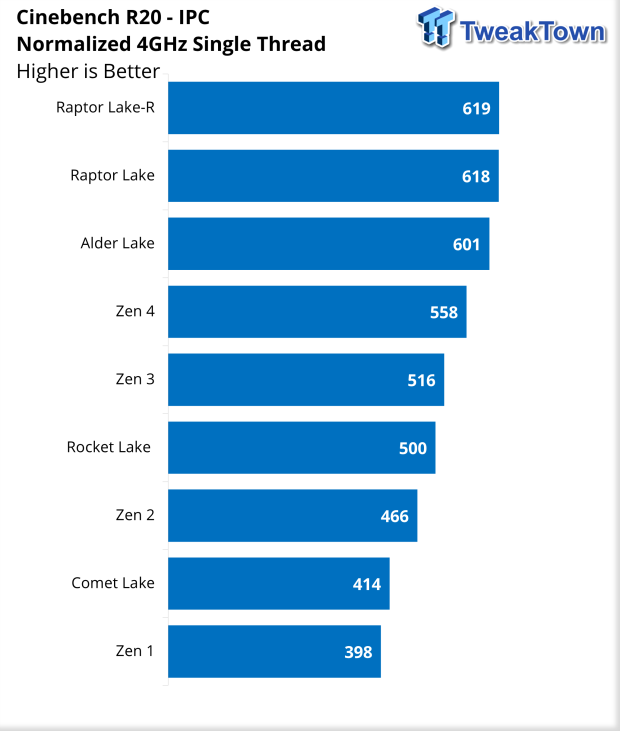
IPC for the Raptor Lake-R was a single point higher than last year's 13th Gen 13900K.
Final Thoughts
Intel's new Core i9 14900K processor is interesting. It's almost identical to the 13900KS apart from minor boost clock changes, 200MHz going to the P-core boost clock and 100MHz to the E-core boost clock. Interestingly, Intel has dropped this processor's power consumption by 100 watts while increasing these clocks. Again, we are comparing this to 13900KS, not the 13900K.
Running through testing, the 14900K battles back and forth with the 13900K and KS. Benchmarks like R23 showed the 14900K second in our charts to the 13900KS, while the more recently released Cinebench 2024 landed it at the top of our charts. CrossMark was also similar, with the 14900K taking top honors, a touch over 100 points higher than the 13900KS. Real-world workloads like UL Procyon showed solid performance for the 14900K as well, 50 points spanning the 13900K, KS, and 14900K in Office workloads, not something many of us would feel in actual day-to-day usage.
Gaming is a place where the 14900K does shine. We picked up a solid 27K CPU score in Time Spy, making it quite a bit better than the KS and the best offering in our charts. Speed Way was different; the KS does a bit better here, though once again, 35 points span the top four CPUs in our charts. Cyberpunk's new Phantom Liberty DLC did enjoy the increased performance from the 14900K. We picked up 186 FPS at 1080p, 4 FPS quicker than the KS, and in this same vein, Starfield was just as good to the 14900K, giving us 118 FPS at 1080p, though just 1 FPS better than the 13900KS.
All that said, the biggest takeaway from all of my testing is the decrease in power usage while maintaining this level of performance. Bravo to Intel for taking power seriously for what seems like the first time. One hundred watts is quite a bit in the grand scheme of things, and even better, the $100 price drop puts this level of performance within reach for more consumers.
 Intel Arc G3 Extreme first impressions with MSI's Claw 8 EX AI+ - Incredible power for an extreme price
 Intel Core Ultra 5 250K Plus CPU Review - Shaking up the entry-level
 Intel Core Ultra 7 270K Plus CPU Review - The 285K is now obsolete
 AMD Ryzen 7 9850X3D Review - The best gaming chip just got better
 Intel Core Ultra 9 285HX vs. 285K CPUs Head-to-Head - Desktop Power in a Laptop Form Factor
 Assassin's Creed Hexe to be revealed 'relatively soon' according to insider
 LG claims that you can improve your aim by up to 38% by playing on a 480Hz OLED monitor
 Sony's $500 million lawsuit heats up after choice to end PlayStation disc production
 Spacecraft confirmed to be approaching one of Earth's seven mysterious 'quasi-moons'
 AI models could soon get cheaper as OpenAI, Meta, and xAI enter a new price war
 SAP escapes EU penalty by easing customer lock-in concerns
 Cursor builds AI agent 'Sand' to rival Anthropic's Claude Cowork
 PocketMage is a distraction-free pocket computer with a wizard-themed operating system
 Samsung is holding your health data hostage to train its AI
 MOZA FMP18 Panel Bundle Review: authentic F/A-18 Hornet cockpit controls for flight sims
 Micron 6600 ION 245.76TB Enterprise SSD Review - Best in Class Programming Speeds
 MOZA MA3F EFCM Flight Control Module Review: authentic Airbus A320 autopilot panel for simulators
 Turtle Beach Stealth Pro II Wireless Gaming Headset Review - Premium Sound, Fantastic Features
 MOZA MGX1000 Instrument Panel Review: a realistic Garmin G1000 replica for immersive flight sims
 Simagic Zeus Formula Steering Wheel Review: premium build and advanced inputs for F1 racing
 GIGABYTE X870E Aero X3D Dark Wood Review - A woody goody
 The Super Mario Galaxy Movie (2026) 4K Ultra HD Blu-ray Review
 KTC H49S66 5K2K (5120x1440) 49-inch 180Hz Gaming Monitor Review
 HighPoint Rocket 1604L Gen5 x16 NVMe Software RAID AIC Review: half the price with full 59 GB/s speed
 I stopped digging through Windows menus after I set up this one folder
 Don't sell your Windows laptop until you do these things
 6 PC cleaning mistakes to avoid for safer hardware maintenance
 Phison and Intel Take Aim at Local AI's Memory Wall with aiDAPTIV
 How to Remap Keyboard Keys in Windows using Microsoft PowerToys
 7 tips to organize your Windows files for faster, easier access
 How to fix Wi-Fi Adapter Not Working on Windows laptops: troubleshooting tips
 Hisense U7SG 4K TV: Modern Entertainment for the New Age
 6 underrated Microsoft Word features worth using to boost your productivity