


Our Verdict
Pros
- Pricing
- User experience
- Consumer workloads
Cons
- Low TBW
Should you buy it?
AvoidConsiderShortlistBuyIntroduction & Drive Details
As of late, SSD prices are falling dramatically, which is excellent news for anyone who owns a PC and has been looking to increase capacity, storage performance, or both. The first sign we saw of this affordability trend was when we tested SSTC's 2TB HammerHead E18 being at the time the best value going at 7.5 cents per gigabyte.
About a month previous to SSTC's HammerHead E18 making its way to the TweakTown lab, we reviewed Corsair's rather disappointing Micron 176 Layer 3-bit (TLC) arrayed MP600 GS 2TB and found it to be overpriced and severely underperforming.
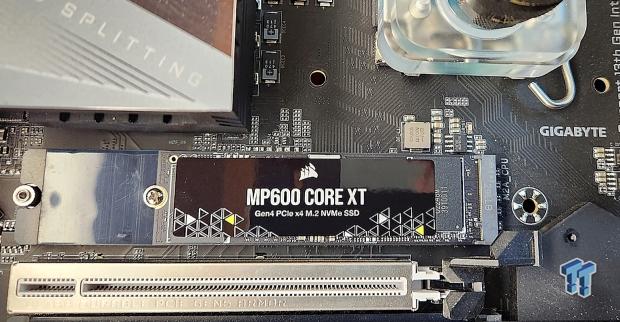
Today, we have another 2TB Corsair offering that is quite similar to the MP600 GS, being that it is also Phison E21T controlled and is arrayed with Micron 176 Layer flash. The difference between these two Corsair offerings being the 2TB MP600 Core XT, which we have in the lab for an evaluation today, is arrayed with 4-bit (QLC) Micron 176 Layer flash and a much more palatable MSRP.
Technically, the MP600 GS being arrayed with TLC flash should perform better than the QLC-arrayed MP600 CORE XT, but that's not the case. In fact, today's test subject outperforms its predecessor by roughly 10% as demonstrated by our all-important TT User Experience Ranking.
So, how does 176L Micron QLC overall outperform 176L Micron TLC when both are Phison E21T controlled? As we understand it, it's a difference between 2-word line flash vs. 4-word line flash. For whatever reason, Micron 176L TLC is 2-word line, and the QLC version is 4-word line. Whatever the exact architectural reasons may be, when configured as part of a DRAMless 4-channel SSD, N48R QLC can, and indeed in this case does outperform B47R TLC as we will demonstrate.
In fact, we will demonstrate that not only does the QLC arrayed MP600 Core XT at 5.75 cents per gigabyte outperform the TLC arrayed MP600 GS at 9.4 cents per gigabyte, but we will also show you that it outperforms its IG5220/B47R competition as well.
Our Latest SSD Review Coverage
- Phison E37T SSD Controller Exclusive Preview - The Fastest DRAMless SSD Platform Yet
- Seagate FireCuda X1070 4TB SSD Review - A New Mainstream Contender
- Micron 3610 2TB SSD Review - DRAMless QLC at 11,000 MB/s
- SK hynix Platinum P51 2TB SSD Review - A Powerful Gen5 Alternative
- Biwin Black Opal X570 Pro 8TB SSD Review - Massive Capacity with Elite Performance
Best Deals: Corsair MP600 CORE XT 2TB PCIe Gen4 x4 NVMe M.2 SSD
Drive Details

In addition to what is spec'd above and worthy of mention here is the fact that E21T controlled SSDs come with Phison's exclusive I/O+ DirectStorage optimized technology baked right in. Gamers take note because this matters if you are into future proofing.


Jon's Test System Specifications
Intel Test System
- Motherboard: GIGABYTE Z790 AORUS Tachyon
- CPU: Intel Core i9-13900KS - Buy from Amazon
- Cooler: Alphacool Eissturm Hurricane Copper 45 - Buy from Amazon
- RAM: Sabrent Rocket DDR5 32GB - Buy from Amazon
- Graphics Card: MSI SUPRIM X RTX 3080 12GB - Buy from Amazon
- Case: PrimoChill's Praxis Wetbench - Buy from Amazon
- Power Supply: be quiet! Dark Power Pro 12 1200W - Buy from Amazon
- OS: Microsoft Windows 11 Pro - Buy from Amazon
AMD Test System
- Motherboard: GIGABYTE B650E AORUS Tachyon
- CPU: AMD Ryzen 9 7950X - Buy from Amazon
- Cooler: Alphacool Eissturm Hurricane Copper 45 - Buy from Amazon
- RAM: Sabrent Rocket DDR5 32GB - Buy from Amazon
- Graphics Card: MSI SUPRIM X RTX 3080 12GB - Buy from Amazon
- Case: PrimoChill's Praxis Wetbench - Buy from Amazon
- Power Supply: be quiet! Dark Power Pro 12 1200W - Buy from Amazon
- OS: Microsoft Windows 11 Pro - Buy from Amazon
Because we at TweakTown like to be first at everything whenever we can, we will present our storage performance results for the test subject on both 13th Gen Intel and 7000 Series AMD platforms going forward for the foreseeable future. Because Intel still delivers the best real-world storage performance, (Look Here), our running chart will continue to be Intel-based until AMD can deliver better real-world storage performance than its rival.
Synthetic Benchmarks: CDM, Anvil, ATTO
CrystalDiskMark
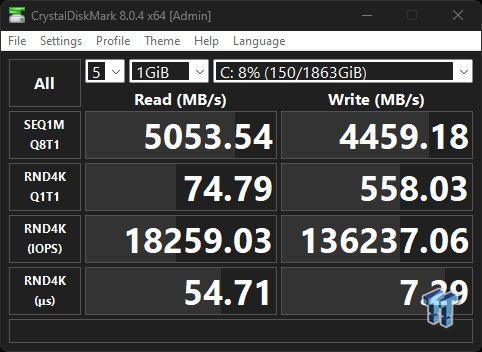
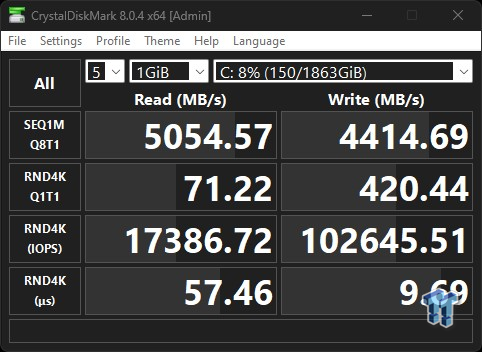
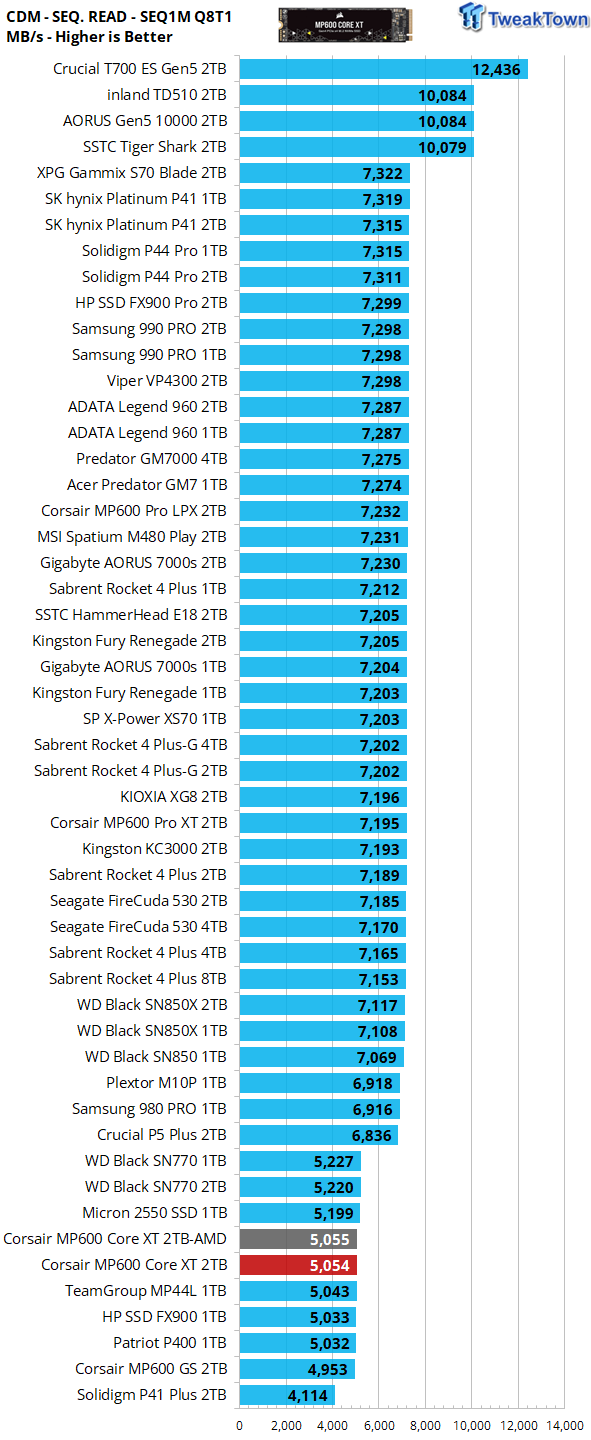
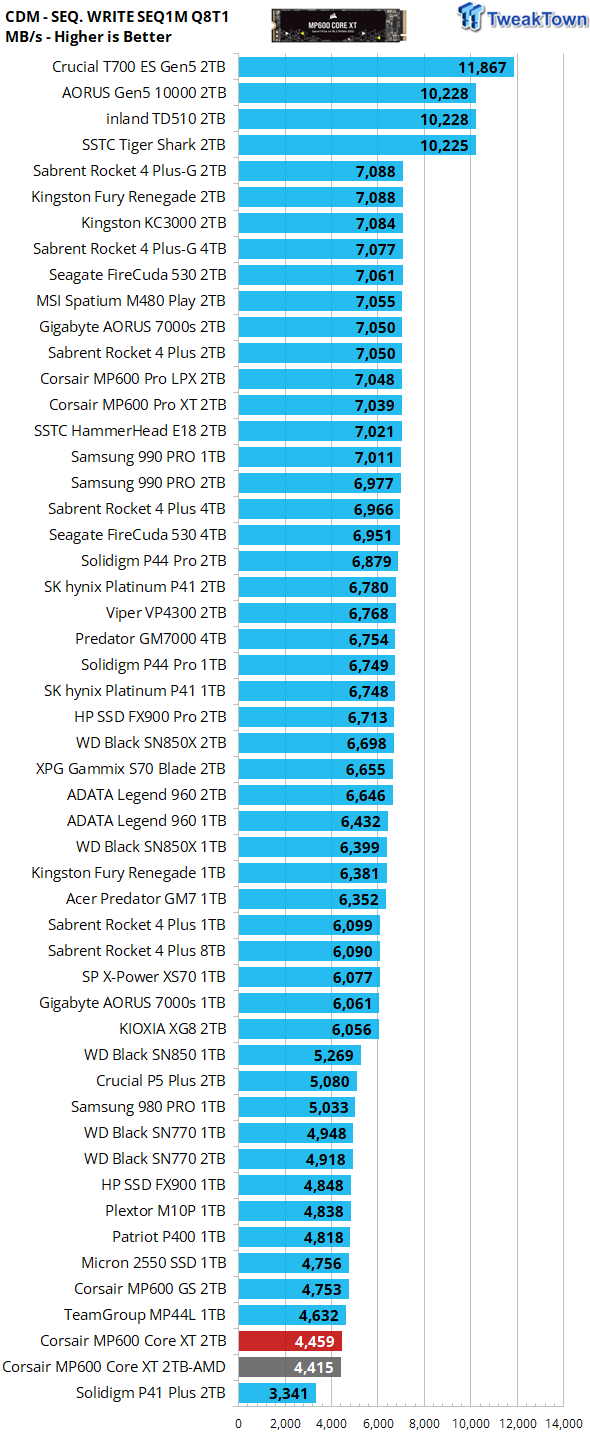
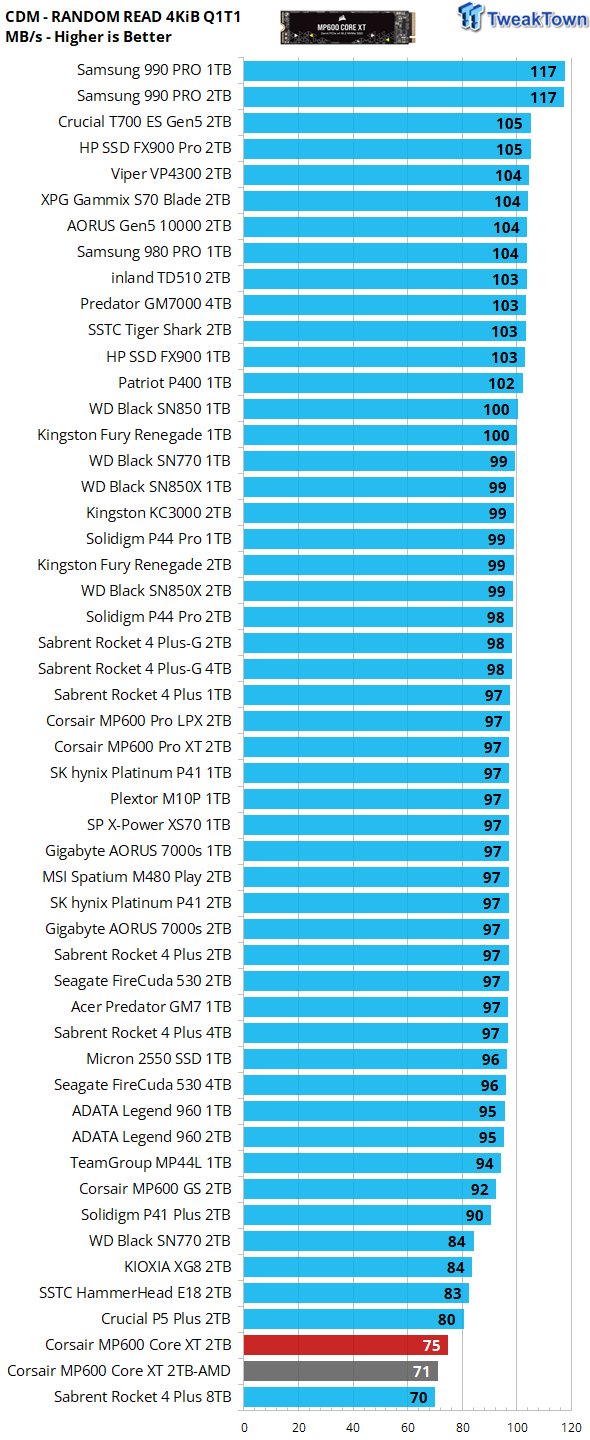
We employ CDM as our standard measurement for both sequential throughput and Q1T1 random read. Sequential performance comes in exactly as expected, but QD1 random read is somewhat lower than expected. In most cases, QD1 random read is a very good synthetic indicator of real-world performance, but not always, as is the case here. In this instance, we find our test subject delivering 75 MBs while the lesser performing MP600 GS delivers much more at 92 MBs.
Anvil's Storage Utilities
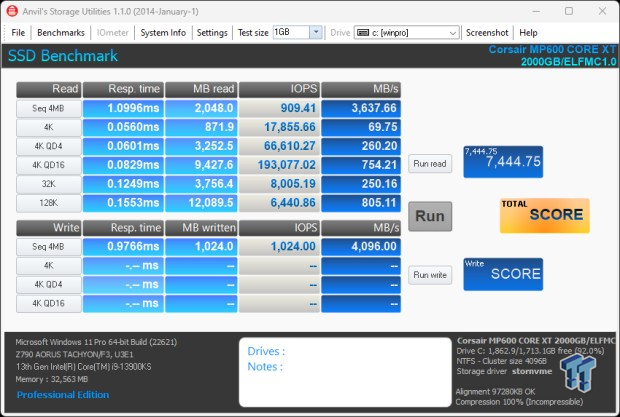

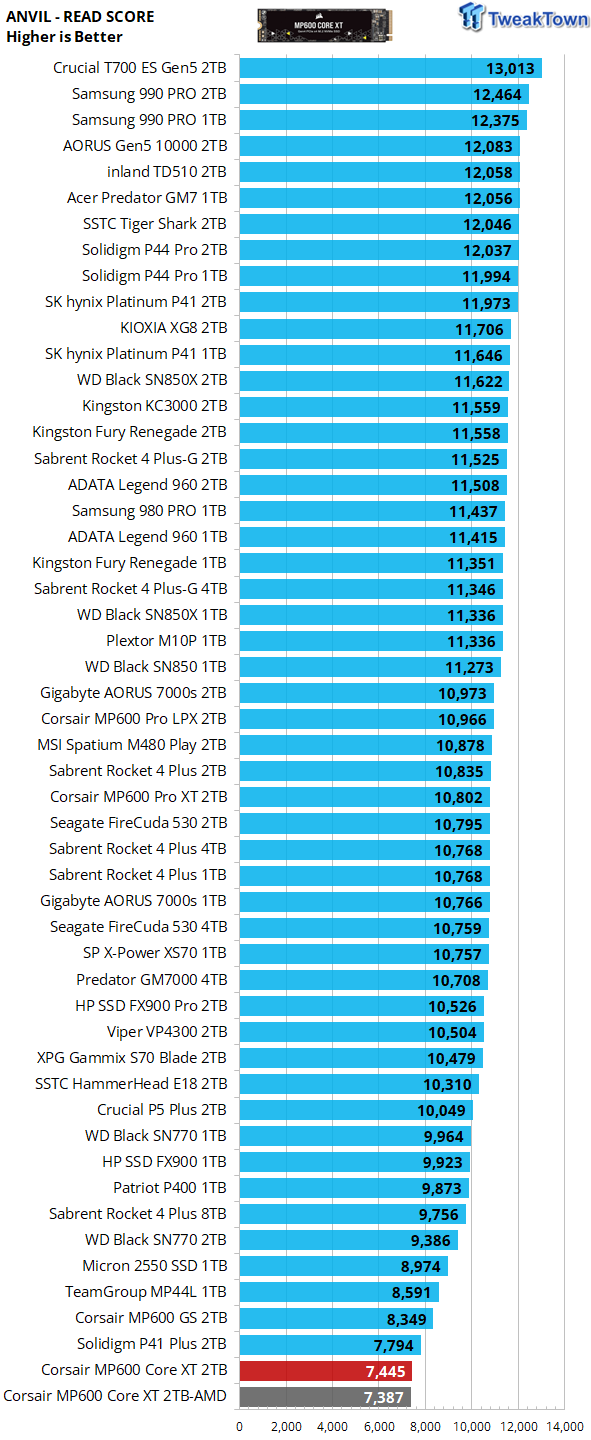
Pretty much the same scenario here as we observed from our previous benchmark, in that the MP600 GS outperforms our test subject in terms of a synthetic read score. Typically, this would indicate the GS as likely the better-performing SSD of the two, but again this is not always the case and again is in fact not the case in this instance.
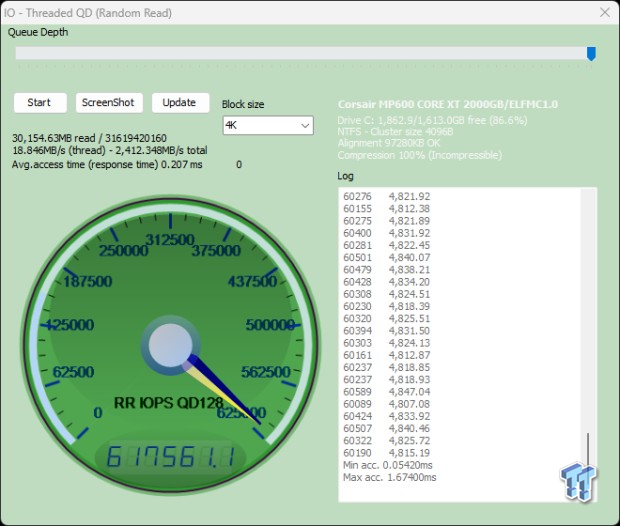

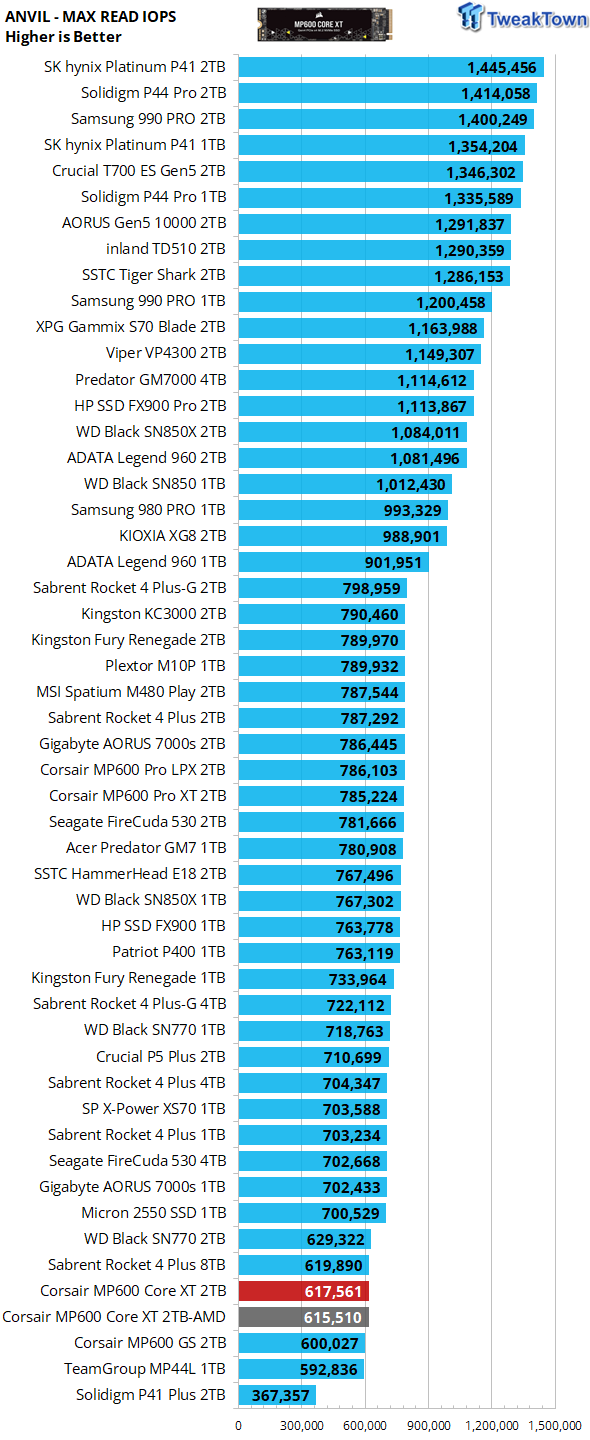
We employ Anvil's random read test as our standard for measuring max random read IOPS. This test is very accurate as it at its core is Iometer skinned over. We test at QD128. 617K IOPS here, even if it falls a little short of factory up to specs, is more than satisfactory considering our more demanding user state of system disk with 150GB of data onboard.
ATTO
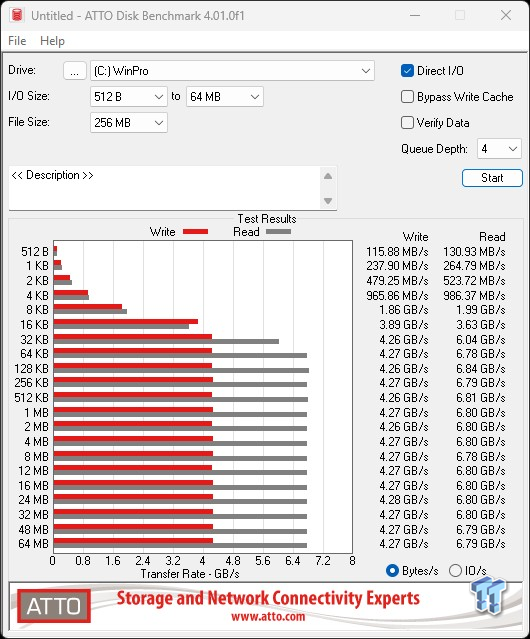
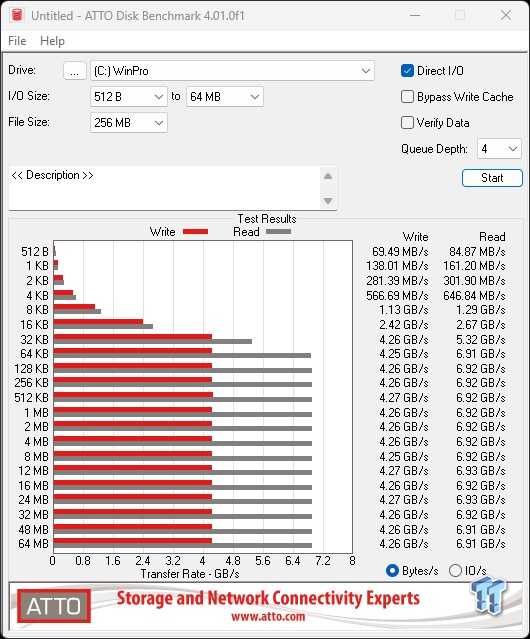
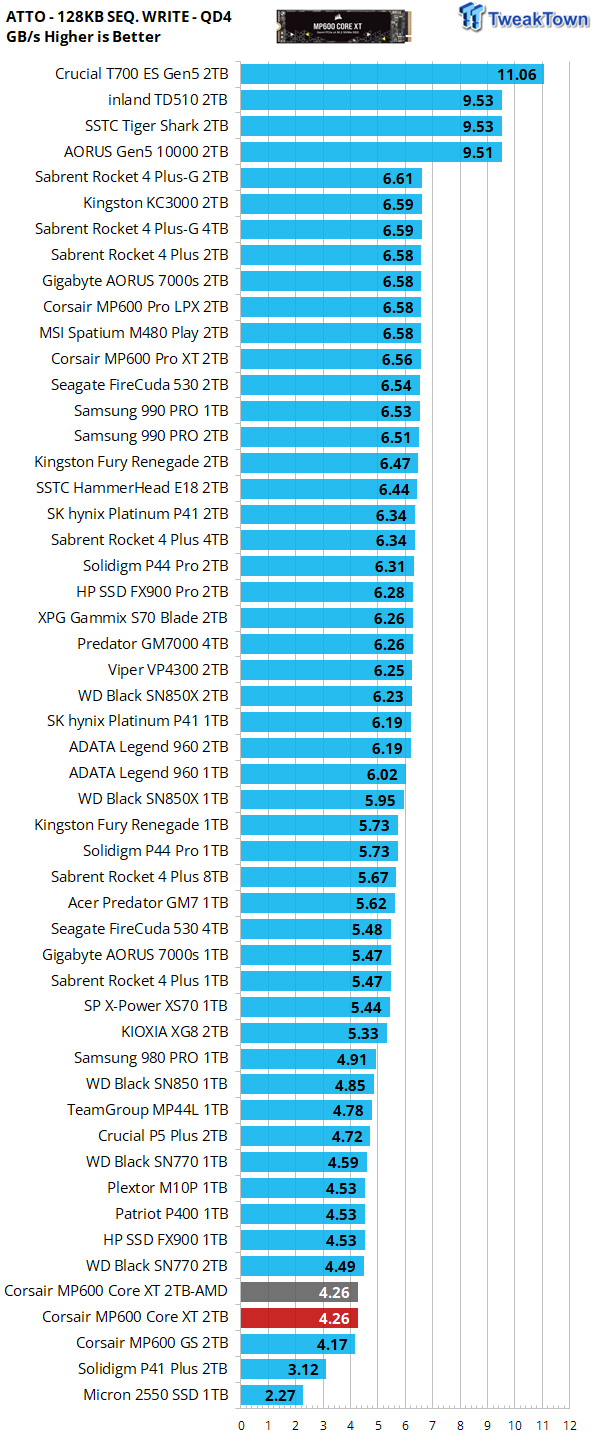
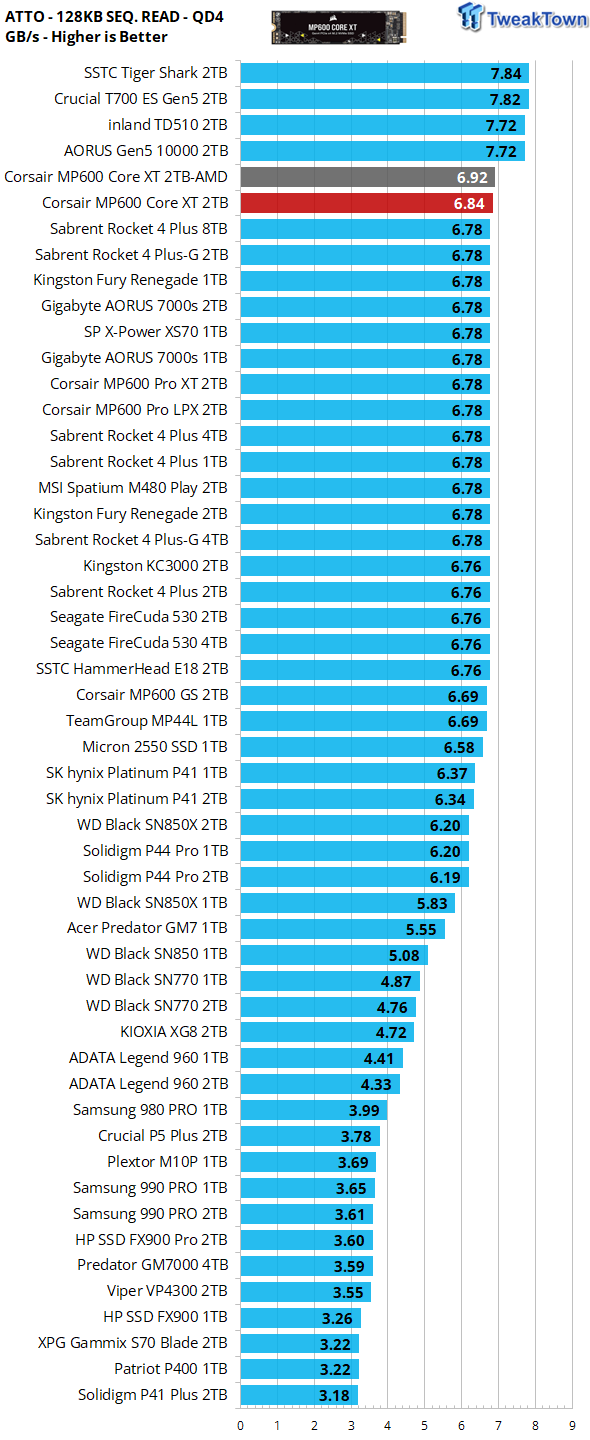
ATTO gives us a clear picture of what transfer sizes a particular SSD favors in terms of sequential throughput. We chart 128K transfers. Our test subject favors sequential transfers of 64K or larger when serving data to the host (reading) and 32K or larger when programming (writing) data. This is what we are looking for full performance at a small file size. Excellent. Due to the nature of how the E21T handles compressible sequential data when serving it to the host or reading, results here can be overly inflated, as is the case here.
Real-World Testing: Transfers, 3DMark SSD Gaming Test, PCM10 Storage
Transfer Rates

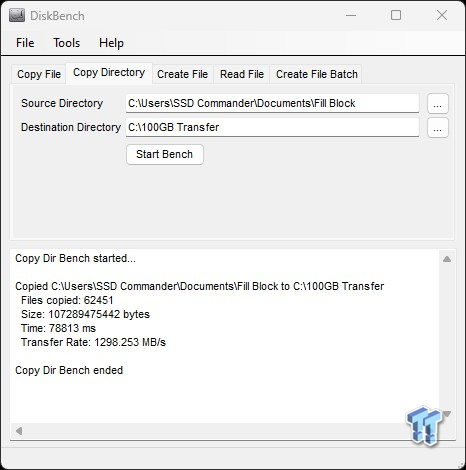
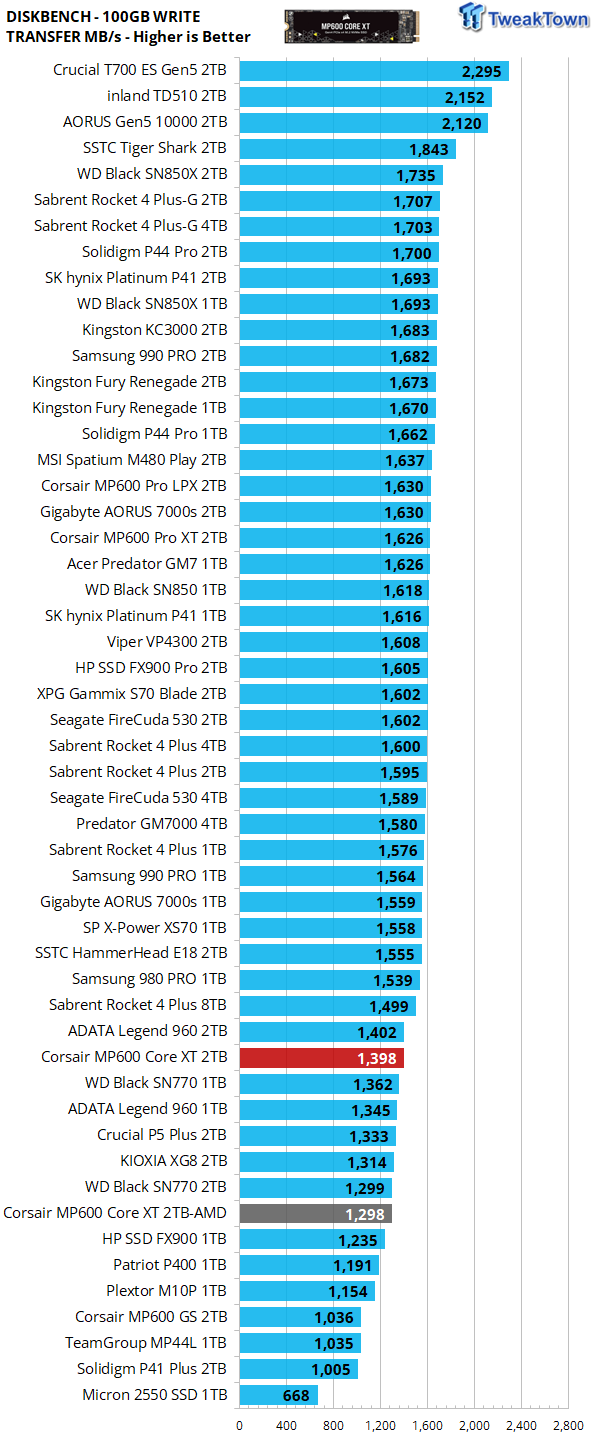
Our 100GB data transfer test is not your ordinary 100GB of data, ours is a crushing mix composed of more than 62K files. Write performance random or sequential, is an infrequent operation, and as such, we do not consider it to be an important performance metric in the consumer space. An example being how many times is a game installed vs. how many times it's played.
Nevertheless, surprisingly stout for a 4-channel controlled SSD arrayed with QLC flash. Very impressive as not only does our test subject outperform its TLC arrayed cousin, but it also manages to deliver the second best all-time for a DRAMless 4-channel SSD as well as besting a host of 7,000 MBs capable SSDs.

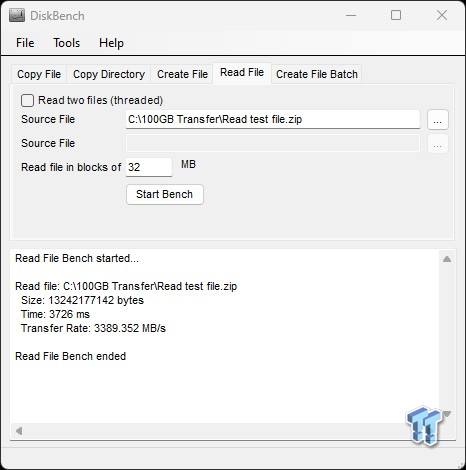
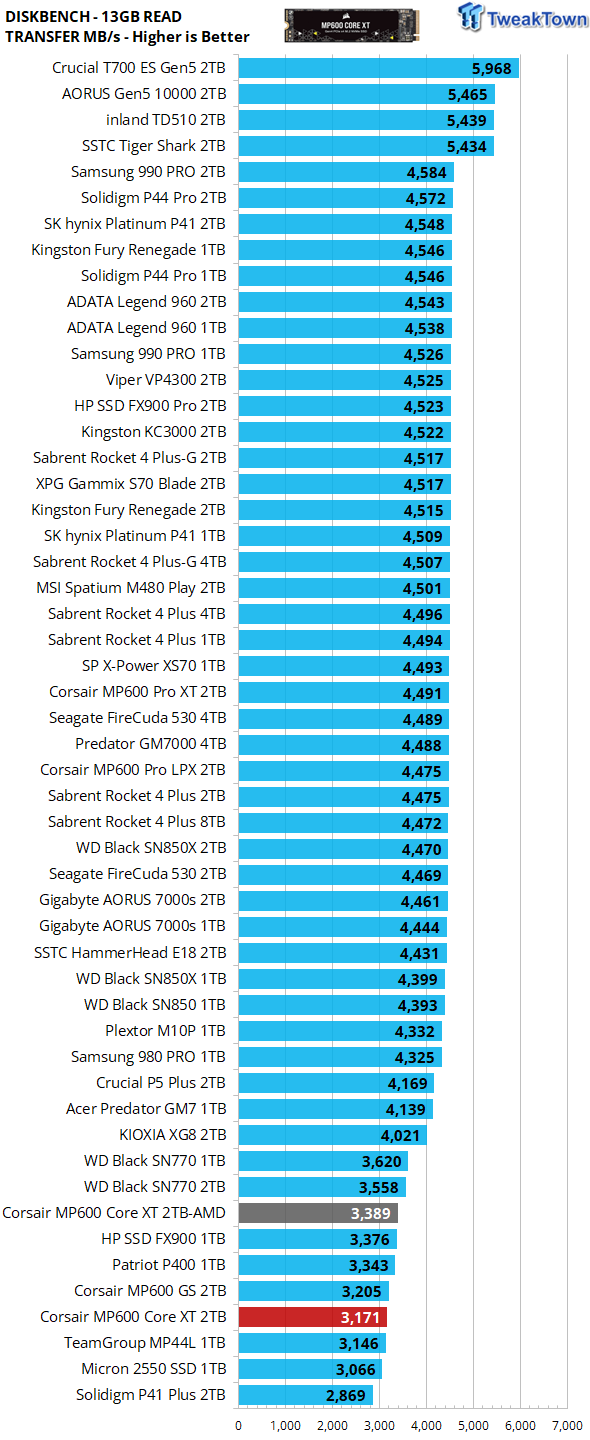
Unlike programming (writing) data, serving data to the host (reading) data is always an important performance metric related to the consumer space. The performance here is somewhat better than expected for what it is.
3DMark SSD Gaming Test
UL's newest 3DMark SSD Gaming Test is the most comprehensive SSD gaming test ever devised. We consider it superior to testing against games themselves because, as a trace, it is much more consistent than variations that will occur between runs on the actual game itself. This test is in fact the same as running the actual game, just without the inconsistencies inherent to application testing.
In short, we believe that this is the world's best way to test an SSDs gaming prowess and accurately compare it against competing SSDs. The 3DMark SSD Gaming Test measures and scores the following:
- Loading Battlefield V from launch to the main menu.
- Loading Call of Duty Black Ops 4 from launch to the main menu.
- Loading Overwatch from launch to the main menu.
- Recording a 1080p gameplay video at 60 FPS with OBS (Open Broadcaster Software) while playing Overwatch.
- Installing The Outer Worlds from the Epic Games Launcher.
- Saving game progress in The Outer Worlds.
- Copying the Steam folder for Counter-Strike Global Offensive from an external SSD to the system drive.
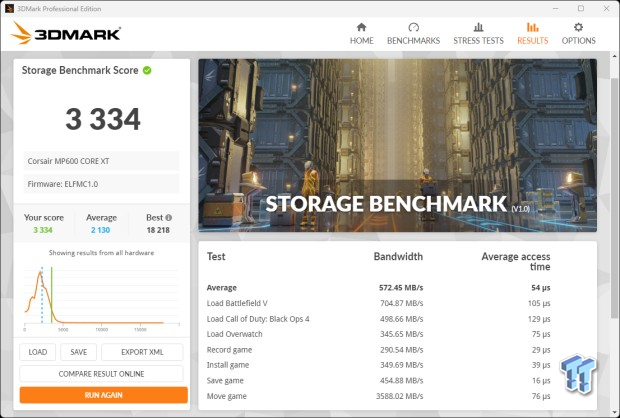

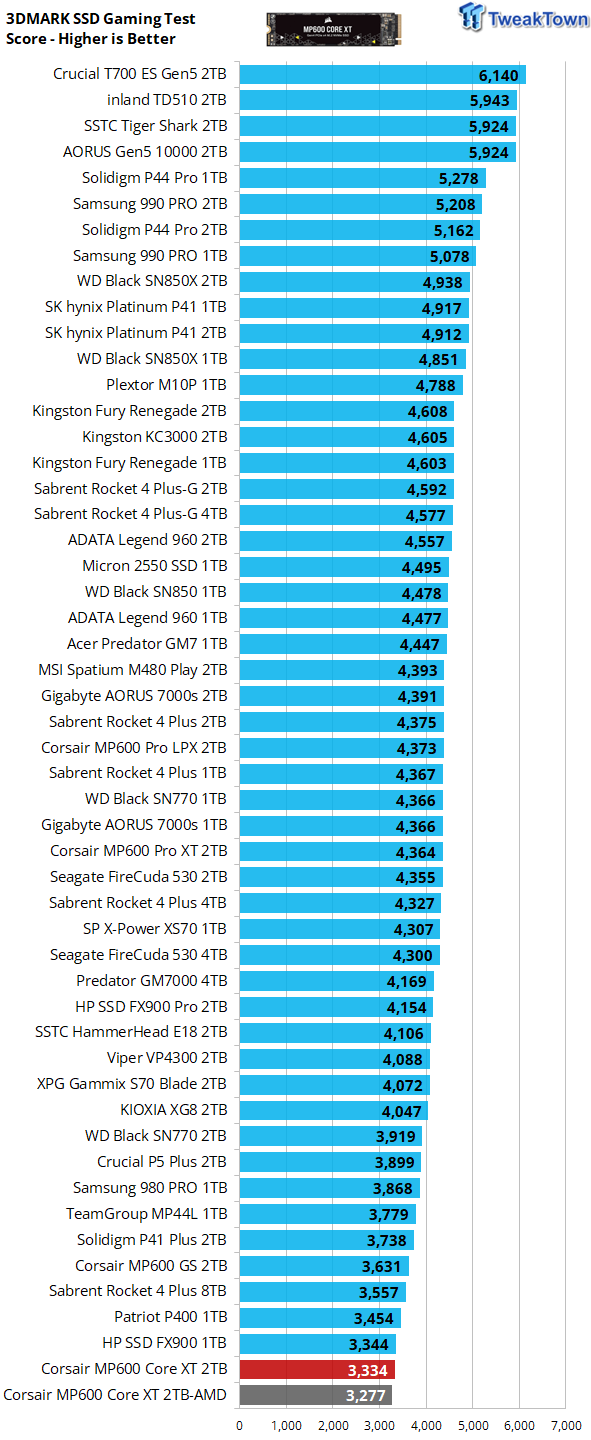
Gaming is a performance metric that matters to the majority of DIY consumers, especially to the enthusiast crowd that TweakTown caters to. This time the GS manages to beat our test subject at something that matters.
PCM10 Storage Tests
PCMark 10 Storage Test is the most advanced and most accurate real-world consumer storage test ever made. There are four different tests you can choose from; we run two of them.
The Full System Drive Benchmark and the Quick System Drive Benchmark. The Full System Drive Benchmark writes 204 GB of data over the duration of the test. The Quick System Drive Benchmark writes 23 GB of data over the duration of the test. These tests directly correlate with mainstream user experience.
PCMark 10 Full System Drive Benchmark
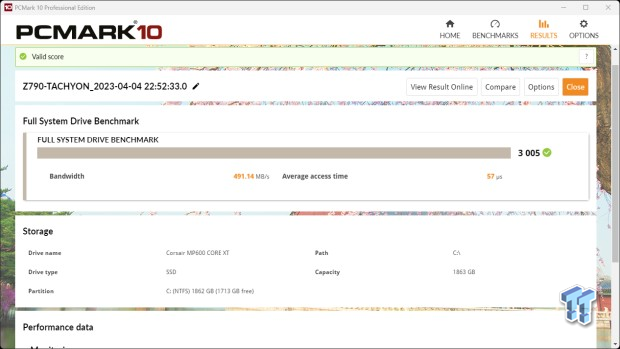
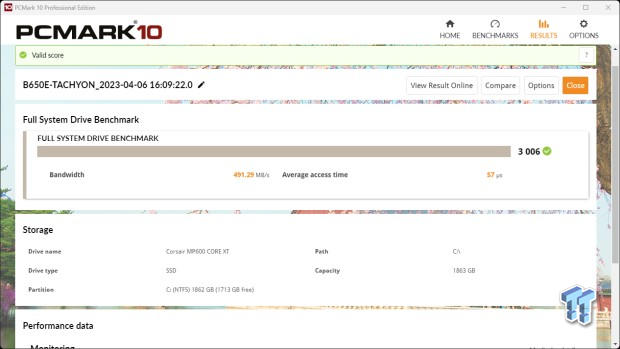
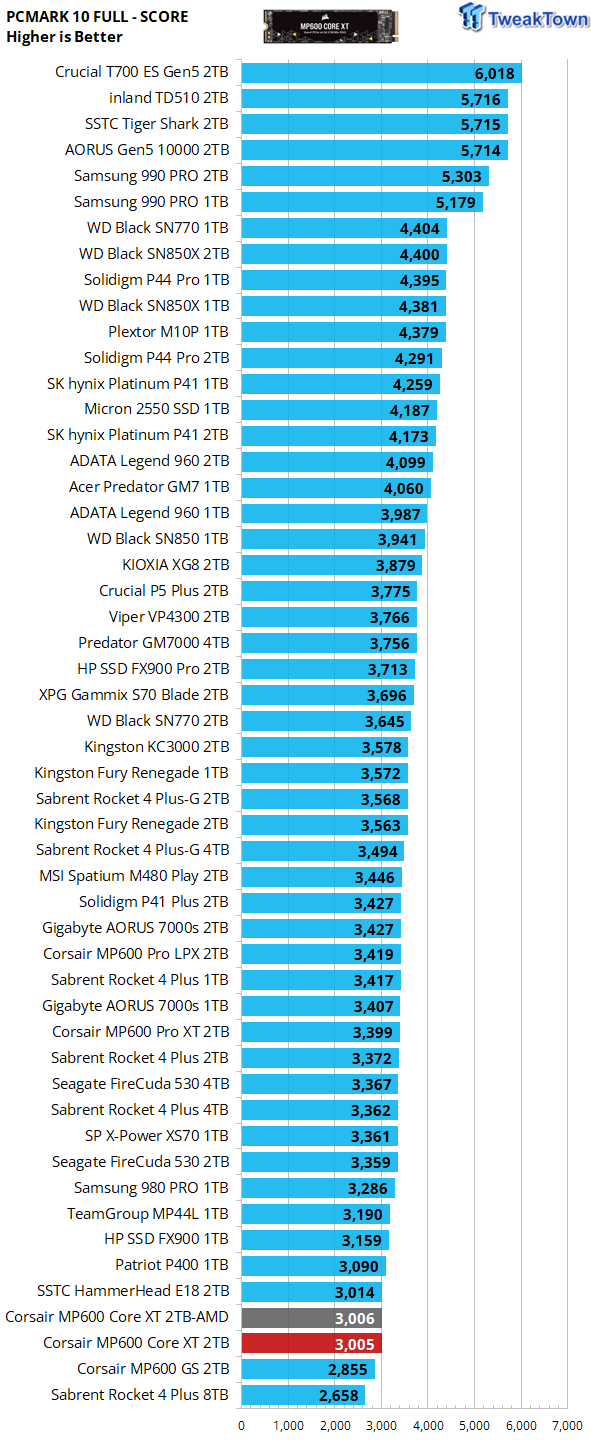
This particular test writes 204GB data and covers a broad range of common consumer tasks, including booting Windows 10, file transfers, Adobe and Office applications, and startup times for games, including Battlefield V, COD Black Ops 4, and Overwatch. Unlike synthetic numbers, this is comprehensive real-world data which is why we use it to rank SSDs in terms of user experience.
Although our test subject lands almost at the bottom of our chart, it's still significantly better than the TLC-arrayed MP600 GS. Additionally, it's about on par with many E18-controlled SSDs and only 10% lower than Samsung's 980 Pro. Not bad at all, especially considering it's a QLC SSD, and these are heavy consumer workloads.
PCMark 10 Quick System Drive Benchmark
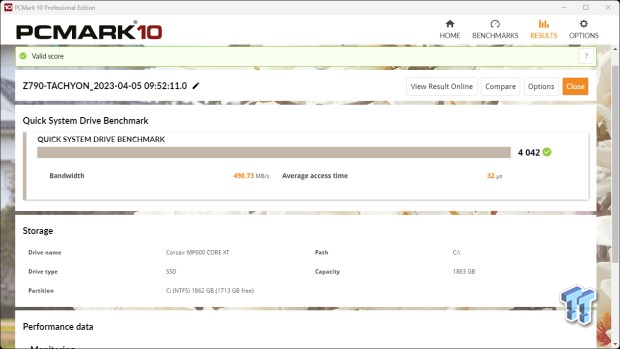
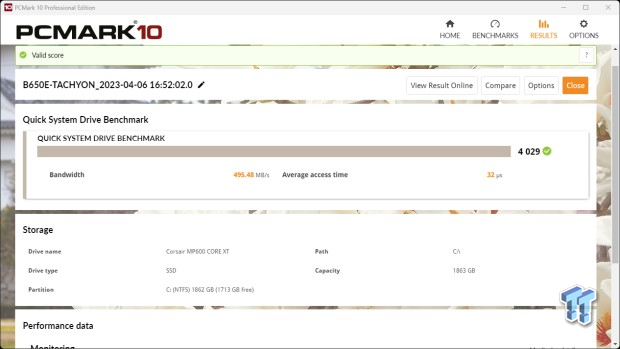
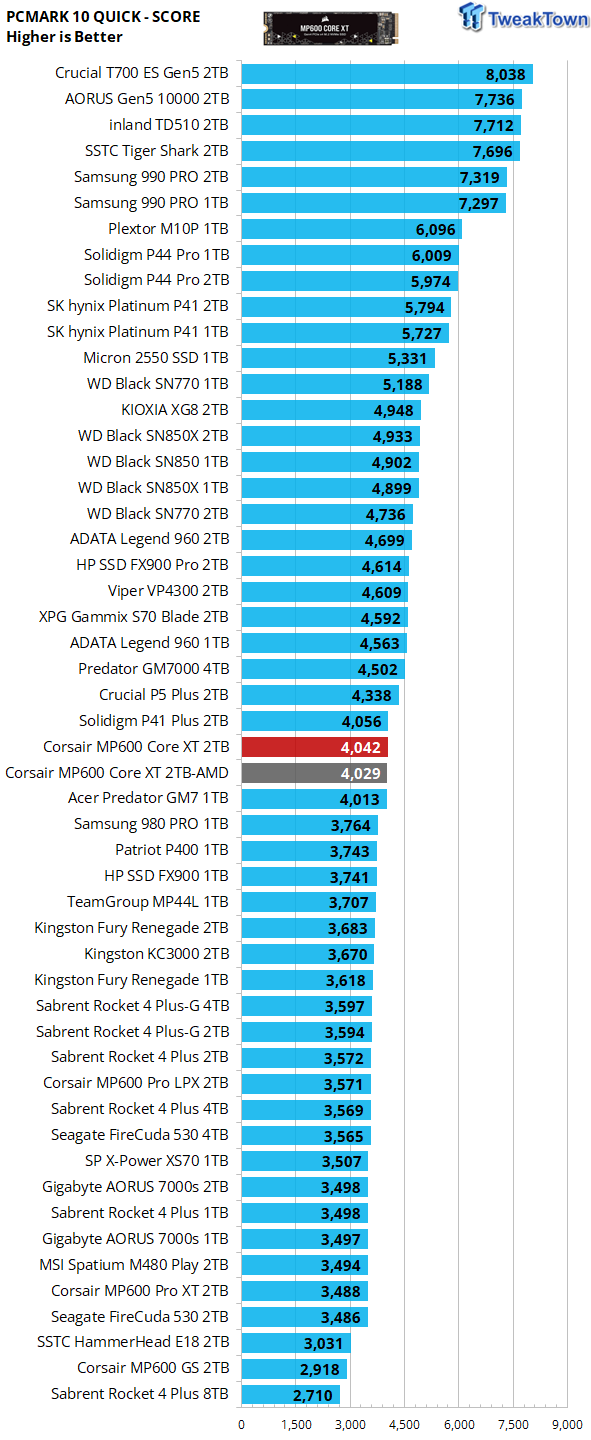
We consider this test to be the most user experience-determinate of all the tests we run, as we believe it most closely simulates typical consumer workloads of any test in existence. This is performance where performance matters most, and this is exactly where Corsair's MP600 Core XT delivers incredibly well. Here is where it delivers better than ANY Phison E18 controlled SSD and even better than Samsung's 980 Pro. Impressive.
Final Thoughts
As we see it, Corsair's newest is checking all the boxes we want to see from an extreme value perspective. As it relates to performance per dollar combined with price per gigabyte, Corsair's MP600 Core XT 2TB is very hard to beat. For some perspective, it is the fourth best-performing retail DRAMless SSD we've ever tested, and it beats all of its InnoGrit IG5220 controlled competition, even though all of them are TLC arrayed.
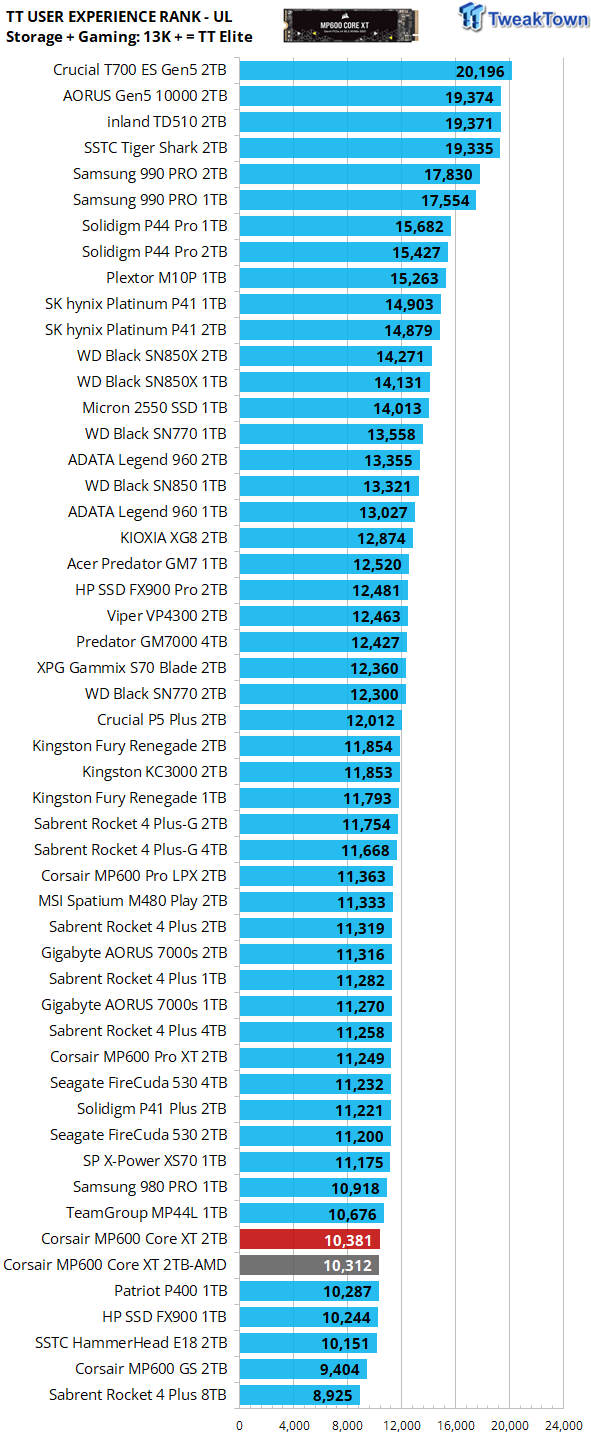
We rank SSDs in terms of overall user experience (performance where it matters most) as expressed by PCMark 10 storage and 3DMark gaming storage tests. We consider a user experience score of 13K or more to verify an SSD as a TweakTown Elite performer. There you have it. Overall, the QLC-arrayed MP600 Core XT outperforms its close cousin, the TLC-arrayed MP600 GS, by an impressive 10%. Additionally, it even outperforms overall some 7,400 MBs-capable E18-controlled SSDs.
For what it is vs. the real-world performance it delivers vs. its extreme value pricing, we are of the considered opinion that Corsair's 2TB MP600 Core XT presents a value proposition that deserves a close look.
 Phison E37T SSD Controller Exclusive Preview - The Fastest DRAMless SSD Platform Yet
 Seagate FireCuda X1070 4TB SSD Review - A New Mainstream Contender
 ASUSTOR Lockerstor 2 Gen2+ AS6702T v2 NAS Review - Fast Performance
 TERRAMASTER D1 SSD Pro Thunderbolt/USB Portable Enclosure Review - Incredible Potential
 Orico K20 Mini 2TB Magnetic Portable SSD Review - Ultra-Thin MagSafe Drive
 Assassin's Creed Hexe is reportedly going to launch earlier than expected
 NVIDIA's open-source NVK Vulkan driver gets experimental DLSS support in Mesa 26.2 for Linux gamers
 ASUS ROG Astral RTX 5090 reportedly causes discoloration on ASUS motherboard after six months
 Nothing has cancelled the CMF Phone 2 Pro's successor, blaming memory prices for making it unaffordable
 Intel Core 3 304 'Wildcat Lake' CPU appears on PassMark, matches the MacBook Neo
 Sony focuses heavily on AI in its recent summary, drops any mention of PC gaming
 Halo remake on PS5 requires two PS Plus subs for split-screen couch co-op
 Enthusiast attempts to install second 12V-2x6 connector on RTX 5090, is rewarded with a hole punched through the PCB
 Activision to release Black Ops 1 & 2 on PS4, PS5 to get past Sony's lack of PS3 backward compatibility
 AMD plans to increase the price of its graphics cards by 10-15% in the second half of 2026
 Speed Racer (2008) 4K Ultra HD Blu-ray Review: a stunning remaster of the cult classic
 MOAIPLAY ORA PRO G1 850W ATX 3.1 PSU Review: high efficiency and 10-year warranty for $119.99
 Navman MiVue Smart True 4K Surround Dashcam Review - Seeing In All Directions At Once
 IQUNIX Magi96 Pro Aluminum Low Profile Mechanical Keyboard Review - Premium Build, Satisfying Sound
 Asetek Forte S-Series Racing Simulator Bundle Review
 Razer Pro Type Ergo Wireless Split Ergonomic Keyboard Review - Built for Comfort and Support
 ASUS ROG Strix Morph 96 Wireless Gaming Keyboard Review - Great Performance, More Affordable
 SAPPHIRE Radeon RX 9070 GRE PULSE OC Review - A New 1440p Challenger Has Arrived
 NZXT H6 RGB+ Compact Dual-Chamber Chassis Review
 I stopped Windows 11 notifications from interrupting me with Do Not Disturb, Focus, and a priority list
 I read the Windows Backup app screen carefully, and it does not back up what most people think
 Low Sound Volume on Windows 11? How to fix audio issues and restore normal volume
 8 Critical Warning Signs You Should Never Ignore in Windows 11
 This Windows security feature protects Documents from ransomware, but it is off by default
 Windows 11 already has a voice typing tool, and it is the one most people are not using
 Quick Assist is the only remote-support tool I open when a relative calls about their PC
 The PowerToys utilities I keep enabled on every Windows 11 PC, and the ones I turned off within a week
 TweakTown's Best of Computex 2026 Awards - The Best Hardware, Gaming Gear, and AI