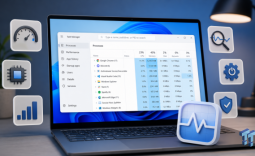












Task Manager is fine for checking which app is eating your CPU or how much RAM Chrome has claimed for itself. But it stops at surface-level numbers, shows percentages, process names, and not much else. Resource Monitor, the diagnostic tool Windows ships alongside Task Manager, goes deeper. It shows which process has locked a file, what's slowing your SSD, and which apps are making network connections you didn't ask for.
Resource Monitor breaks your PC activity down to the process level
Task Manager tells you that something is using 80% of your CPU. Resource Monitor tells you why. It's built around five tabs, namely Overview, CPU, Memory, Disk, and Network. Each one breaks activity down to the process level with actual figures such as bytes read and written, active connections, handles held open, and memory committed. The Overview tab pulls highlights from the other four, but the individual tabs go much further.
To open it, press resmon, and hit Enter. You can also get there from the Task Manager. Open the Performance tab, click the three-dot menu in the top-right corner, and select Resource Monitor.

The feature I'd point out first is filtering. Each dedicated tab lets you filter everything by a specific process. Check a box next to any app, and every panel on that tab narrows down to show only that app's activity. It's the quickest way to trace what one app is doing across your entire system.


Best Deals: Samsung 9100 PRO 1TB SSD
Price Trend:
Prices last scanned 9 hours and 4 minutes ago

7 days ago: $249.99 USD30 days ago: $249 USD

7 days ago: $249.99 USD30 days ago: $248 USD
7 days ago: $464.97 CAD30 days ago: $464.97 CAD
7 days ago: $464.99 CAD30 days ago: $419.97 CAD

7 days ago: $49930 days ago: $499
7 days ago: $397.69 AUD30 days ago: $397.69 AUD
That per-process filtering makes this tool worth opening. You pick an app you suspect is misbehaving, and Resource Monitor shows you exactly what it's doing to your CPU, disk, memory, or network in real time.
The CPU tab tells you exactly which process is locking your files
You've probably hit this before when you try to delete or rename a file, and Windows throws back a vague "this file is in use" error. Sometimes it names the program, and sometimes it doesn't, and you're left guessing which invisible process it is.
Task Manager won't help here. It shows running processes, but it has no way to tell you which one is holding a specific file hostage.
Our Latest TweakTown Guides
- The Complete Windows 11 Tweaking Guide for 2026: What to Change and What to Avoid
- Using Multiple Monitors? Change these Windows settings for a Better Experience
- Windows Sandbox is The Windows Security Feature Most People Never Use
- I ditched the Windows 11 context menu for this open-source tool, and here's why
- Windows 11 may be encrypting your drive already, and I checked where my recovery key went
Resource Monitor's CPU tab solves this. Scroll to the bottom and expand the "Associated Handles" section, then type the file name into the search bar. It immediately shows which process has a handle on that file.

Right-click the offending process and select "End Process" to release the lock. Just be careful with system processes - ending something like "svchost.exe" or "System" can cause instability, so make sure you know what you're closing before you do it.
When your SSD feels slow, check the Disk tab first
A sluggish SSD is one of the most frustrating problems to diagnose because the symptoms are obvious in Task Manager, but the cause usually isn't. You can see the drive working, feel the lag opening folders, and still have no idea which app is responsible. Here, the Disk tab comes in handy by showing every active read and write operation on your system.
The "Disk Activity" section lists every active read and write operation with process name, file path, and throughput in bytes per second. So if a cloud sync client is silently rewriting thousands of small files in the background, you'll see it here, the exact folder it's slowing down.

Below that, the "Storage" section shows your disk queue length. Modern SSDs are designed to handle highly parallel tasks, so they can handle much higher queue depths. If you see a consistently massive queue combined with unusually low read/write speeds, but Task Manager's percentage doesn't look alarming, that's when you know your bottleneck is real.

The Network tab exposes every outbound connection on your PC
Not every app is upfront about what it sends back to its servers. Analytics, telemetry, and background check-ins happen constantly on the PC, and most of it runs without any visible indicator. The Network tab surfaces all of it through two sections worth knowing: TCP Connections and Listening Ports. TCP Connections lists every active outbound connection per process, including the remote IP address and port number.

If a recently installed app is sending data to an unfamiliar server in a country you have no business connecting to, this is where you'll spot it. You can copy the IP address and run a quick lookup on a site like whatismyipaddress.com to see who owns it.
Listening Ports shows which processes have open ports waiting for incoming connections. Most of these are harmless system services, but if something you don't recognize is listening on an unusual port, it's worth investigating.

The Network tab won't replace a proper firewall or network monitor, but it's a fast, built-in way to verify that nothing on your PC is reaching out behind your back.
Your RAM isn't actually full - the Memory tab proves it
A RAM meter sitting at 85% looks alarming until you understand how Windows actually manages memory. Modern versions of Windows deliberately keep memory occupied because empty RAM is wasted RAM. The OS uses every spare megabyte as a cache to speed things up. The Memory tab shows you that full picture instead of a single percentage.
The Memory tab in Resource Monitor breaks things down into columns like Working Set, Private, Shareable, and Commit. Working Set is the total physical memory a process is actively using. Private is memory reserved exclusively for that process, which no other program can touch. These numbers expose the real hogs. Apps like Slack or Teams that spawn multiple background processes, each quietly claiming its own slice.

At the bottom of the tab, a physical memory bar gives you a visual breakdown of "In Use," "Standby," and "Free." Standby memory isn't wasted because Windows uses it as a cache to load frequently accessed data faster, and it gets released the moment something else needs it. If "Free" is near zero but "Standby" is healthy, your system is fine. It's only a problem when both are depleted.

Resource Monitor is the Task Manager follow-up worth learning
Task Manager handles the obvious checks well, but it runs out of answers the moment you need specifics. Resource Monitor picks up from there - locked files, phantom disk writes, unknown outbound connections, and memory that doesn't add up. None of it requires a download or a registry tweak. Open it the next time your PC acts up, and you'll usually have a suspect within a minute.