Introduction & Specifications
Ready for the Primetime
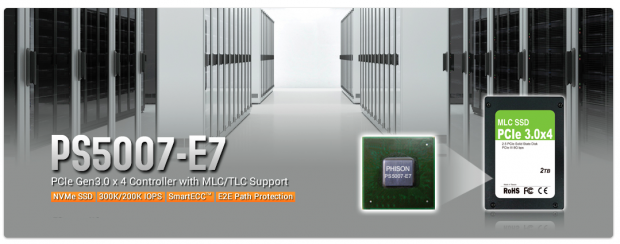
Phison's E7 controller has appeared on the scene a couple of times to date. We tested the E7-powered Zotac Sonix back in March of this year. The Sonix showed some potential but wasn't quite ready for the primetime. Workload performance wasn't where we felt it should be, and 4K QD1 read was lower than we hoped for.
It turns out that the RC (Release Candidate) firmware that shipped with the Sonix was holding back performance considerably. Phison has been hard at work perfecting firmware for the E7. One of the big features that has appeared with firmware 2.0 and now firmware 2.1 is pSLC (pseudo-Single Level Cell) caching. We typically see pSLC caching enabled on TLC SSDs, but it can also be enabled on MLC SSDs to provide an additional performance boost. Firmware 2.0 had some issues when the drive was loaded up with data, but now with firmware 2.1, E7-powered SSDs are ready for the primetime.
With our Phison E7 FW 2.1 performance preview, we are going to approach things a bit differently than we normally do with a typical review. We will be providing benchmark screen shots of the drives running on Windows 10 Anniversary Edition as empty secondary volumes. Where we do provide charts for comparison with other SSDs, the charts will be reflecting the results of the drives running as our OS Disk 75% full unless otherwise noted. Additionally, because this is a performance preview of the E7 in non-retail form, we are not going to run our complete benchmark suite. We are leaving out our long tests like steady-state Vantage, PCMark 8 Extended, and Sledgehammer.
These tests take a very long time to run and are less relevant to the average user than the synthetic and moderate workload tests that we are presenting in this preview. We will be covering three capacities of E7 SSDs in an M.2 form factor and an E7-powered 480GB AIC (Add-In-Card). The AIC card we have is enthusiast grade, with a 2MB per GB DRAM to NAND flash ratio.
Phison E7 NVMe SSD Controller Features and Specifications

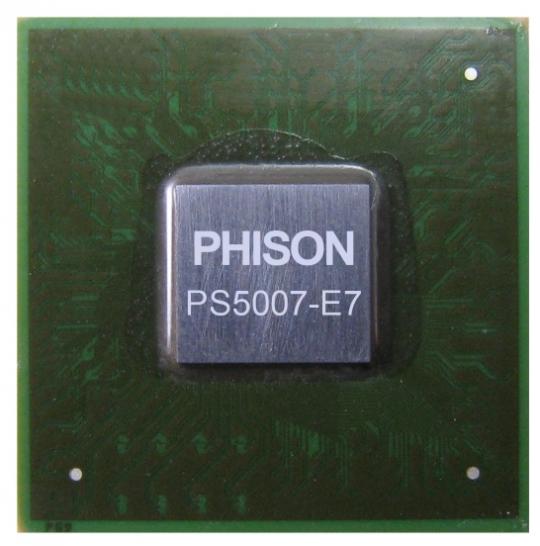
Phison sells its controllers as part of a turnkey solution to be branded and sold by vendors. This has made Phison SSDs a favorite among third-party SSD retailers. The E7 controller supports the full gambit of current and forth coming flash technologies. Phison's quad-core, 8-channel E7 NVMe SSD controller is designed with a whole host of important features and sports impressive performance specifications as follows:
- Sequential Read: up to 2,600 MB/s
- Sequential Write: up to 1,300 MB/s
- Max 4K Random Read Speed: 300,000 IOPS
- Max 4K Random Write Speed: 200,000 IOPS
- Advanced BCH error correction: up to 120bit/2KB
- Firmware: Field upgradeable
- NAND: 1z nm MLC/TLC and 3D flash
- Encryption: AES-256 TCG security feature
- Wear-Leveling: Static and Dynamic
- Data Protection: End-to-End Data Path Protection
- Power Saving: L1.2 power saving mode
- SmartECC
- SmartFlush
- GuaranteedFlush
Drive Details
Phison E7 M.2 and AIC SSDs
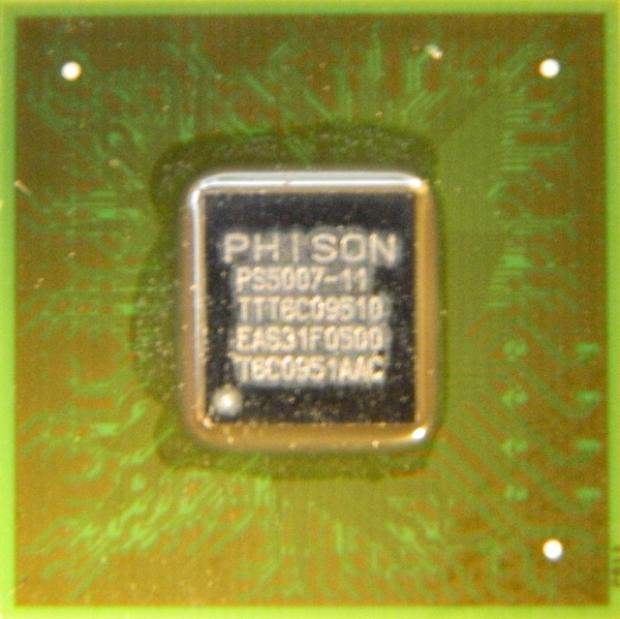
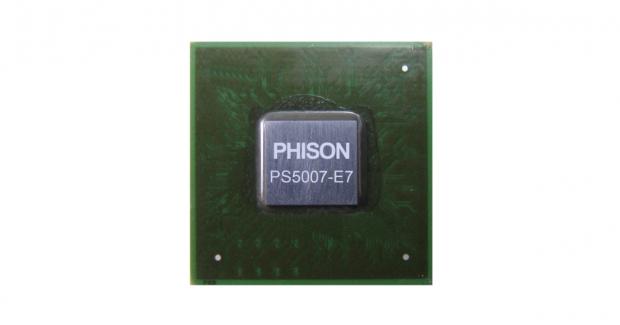
At the heart of all of the SSDs on the bench today is Phison's PS5007-11 or E7 quad-core, 8-channel NVMe controller.
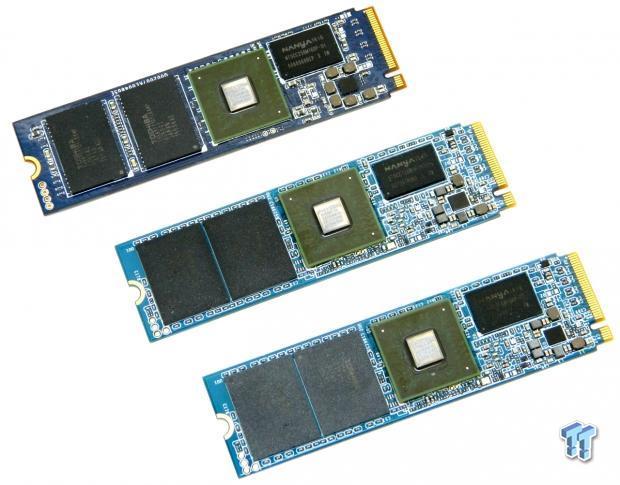
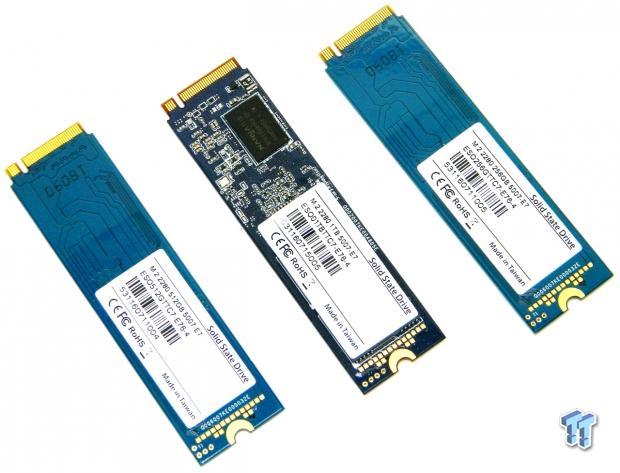
Going from top to bottom, we have 960GB, 480GB, and 240GB M.2 SSDs.
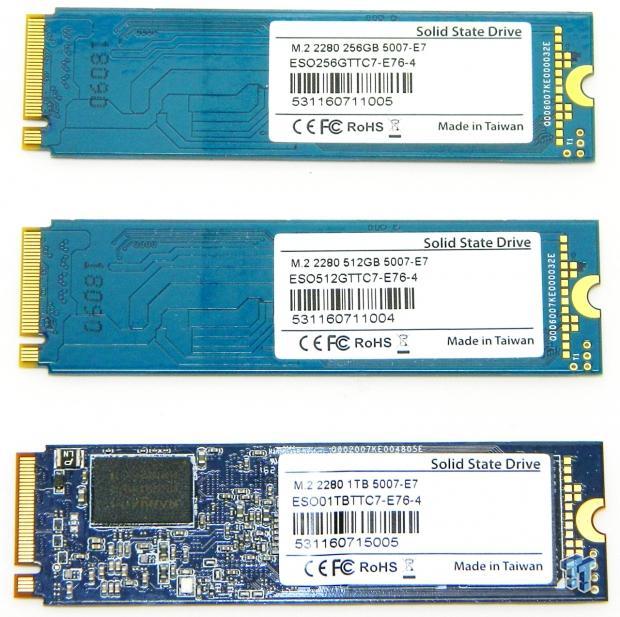
Phison labels their M.2 drives on the motherboard side of the drives. This allows for better cooling on the controller side. The drives are labeled as non-OP, but they are actually Over-Provisioned, which is typically how they will be sold on the retail market. The 240GB and 480GB drives are single sided designs, and the 960GB drive is double sided. All of the drives we are testing today feature Toshiba 15nm planar MLC (2bit) flash.
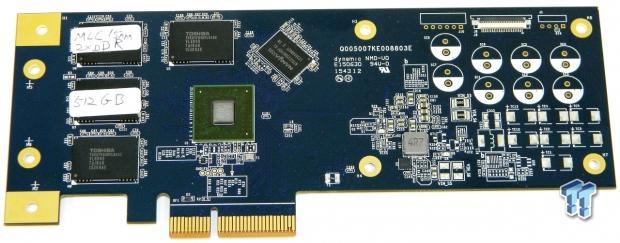
The controller side of the 480GB AIC SSD. This drive features 2MB DRAM per GB of flash. Double the DRAM cache of the M.2 versions, which is why the AIC is a bit faster. Like the M.2 drives, the AIC is labeled as 512GB, but it is actually overprovisioned, resulting in 480GB.
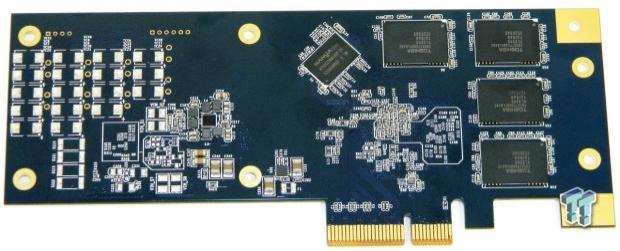
The reverse side of the 480GB AIC.
Test System, Settings, & Boot Speed Video
Jon's Consumer SSD Review Test System Specifications
- Motherboard: ASRock Extreme9 Z97 - Buy from Amazon
- CPU: Intel Core i7 4790K @ 4.8GHz - Buy from Amazon / Read our review
- Cooler: Swiftech H2O-320 Edge - Buy from Amazon / Read our review
- Memory: Corsair Dominator DDR3 32GB 2400MHz - Buy from Amazon
- Video Card: Onboard Video
- Case: IN WIN X-Frame - Buy from Amazon / Read our review
- Power Supply: Seasonic Platinum 1000 Watt Modular - Buy from Amazon / Read our review
- OS: Microsoft Windows 10 Professional 64-bit - Buy from Amazon
- Drivers: Intel RAID option ROM version 13.0.0.2075 and Intel RST driver version 13.6.0.1002
We would like to thank ASRock, Crucial, Intel, Corsair, RamCity, IN WIN, and Seasonic for making our test system possible.
The majority of our testing is performed with our test drive as our boot volume. Our boot volume is 75% full for all OS Disk "C" drive testing to replicate a typical consumer OS volume implementation. We feel that most of you will be utilizing your SSDs for your boot volume and that presenting you with results from an OS volume is more relevant than presenting you with empty secondary volume results.
System settings: Cstates and Speed stepping are both disabled in our systems BIOS. Windows High-Performance power plan is enabled. Windows write caching is enabled, and Windows buffer flushing is disabled. We are utilizing Windows 10 Pro 64-bit OS for all of our testing except for our MOP (Maxed-Out Performance) benchmarks where we switch to Windows Server 2012 R2 64-bit.
Boot Speed
The E7 delivers as good of an SSD experience as there is. In terms of snappiness, boot speed, and all-around user experience, you cannot tell the difference between an E7 on FW 2.1, a 950 Pro, or an RD400. It is that good.
Synthetic Benchmarks – CDM & Anvil Storage Utilities
NOTE: All benchmark screenshots are empty secondary volumes. Charts are OS Disk 75% full unless otherwise noted.
CrystalDiskMark
Version and / or Patch Used: 5.1.2
CrystalDiskMark is disk benchmark software that allows us to benchmark sequential and 4K random performance with accuracy.
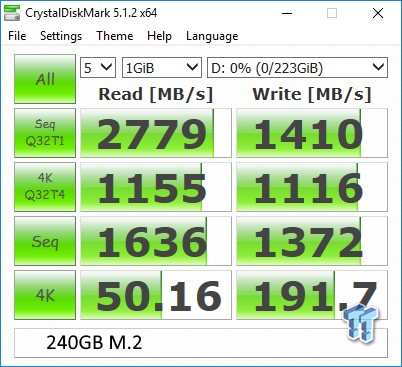
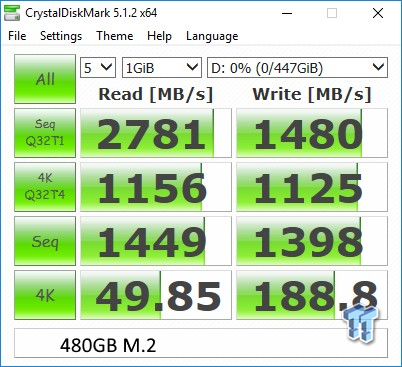
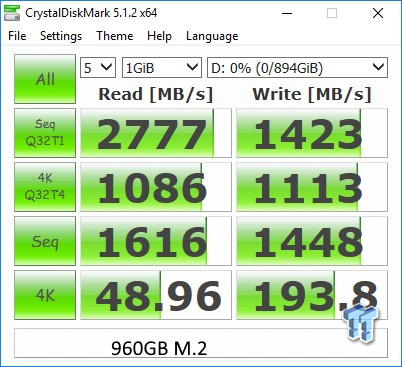
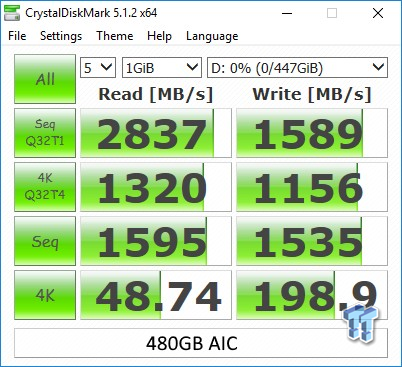
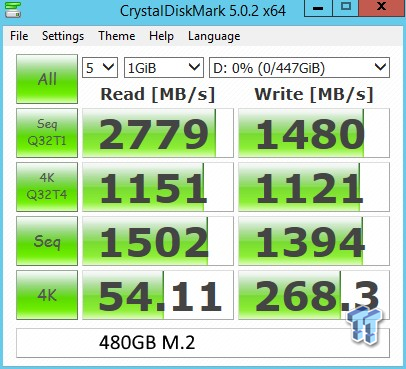
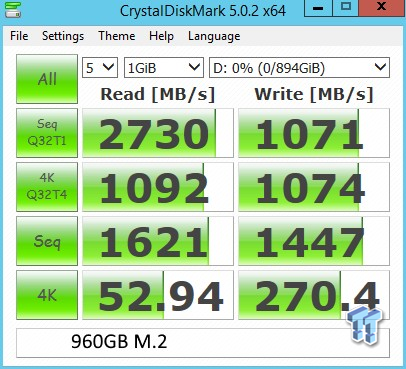
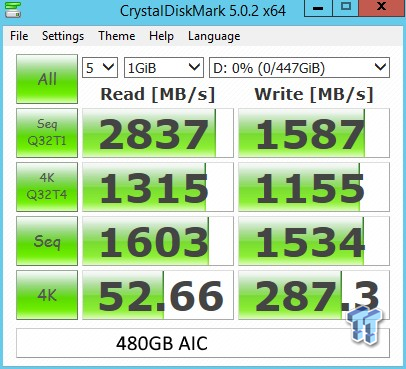
With firmware 2.1, the E7 unleashes incredible sequential read performance. Other than the incredibly hard to obtain Samsung SM961, this is the best sequential read performance we've seen to date. Samsung's 950 Pro can hit 2600 MB/s sequential read, Toshiba's RD400 a little more, but the E7 can achieve over 2800 MB/s sequential read at QD32 in an AIC form factor, the M.2 version, close to 2800 MB/s. 4K random performance is also way up in comparison to FW 1.1.
Anvil Storage Utilities
Version and / or Patch Used: 1.1.0
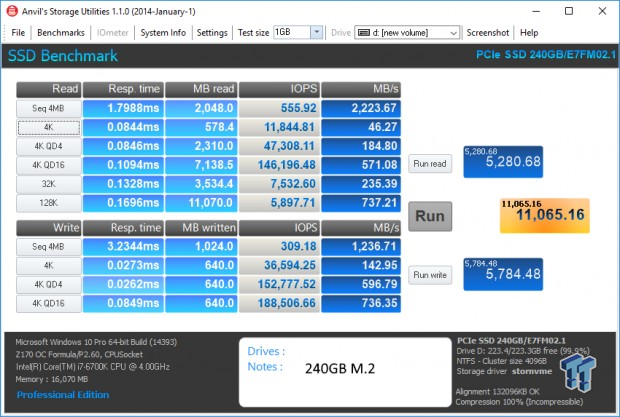
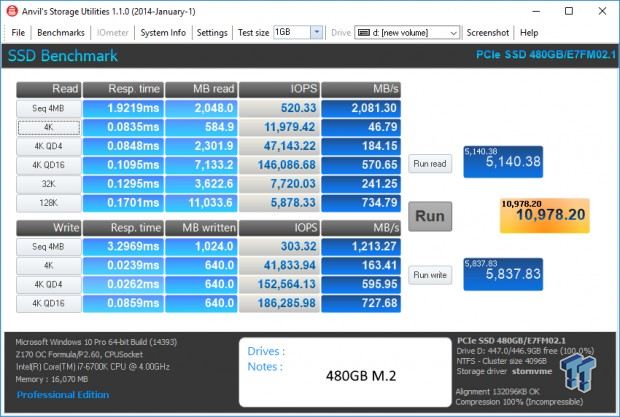
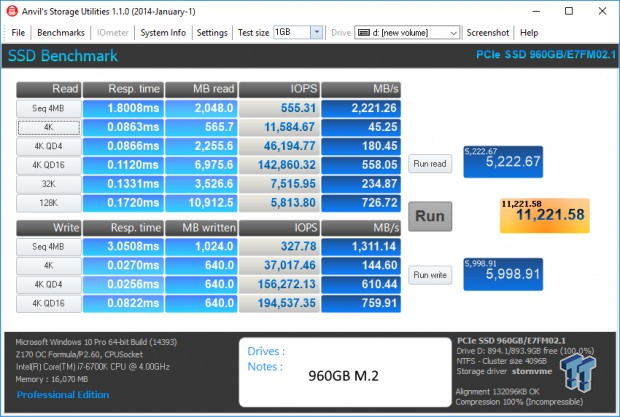
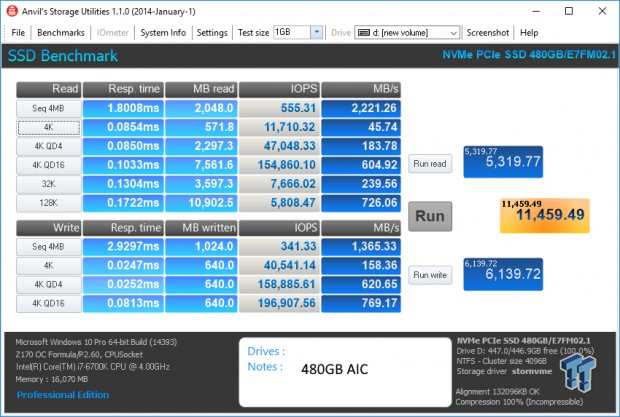
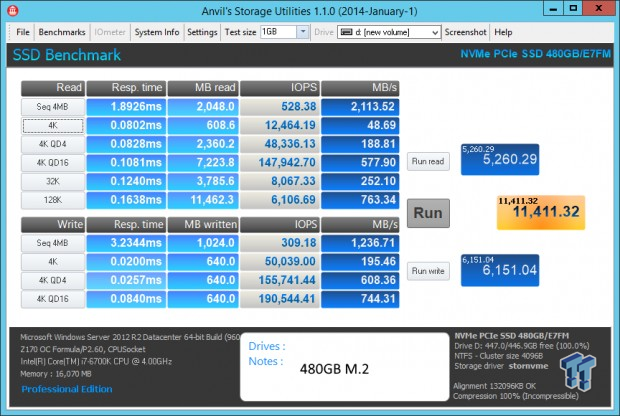
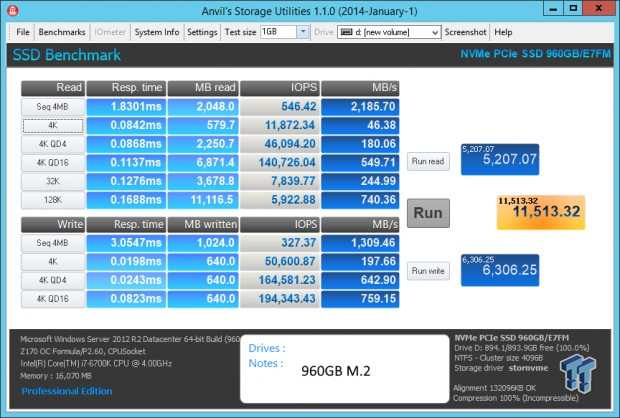
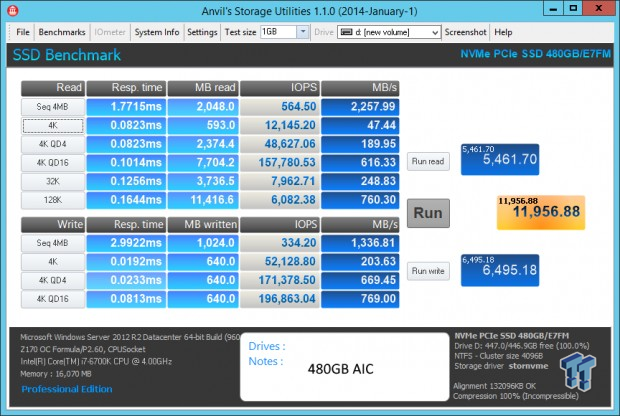
Anvil's Storage Utilities is a storage benchmark designed to measure the storage performance of SSDs. The Standard Storage Benchmark performs a series of tests; you can run a full test or just the read or write test, or you can run a single test, i.e. 4k QD16.
Scoring OS Disk 75% Full
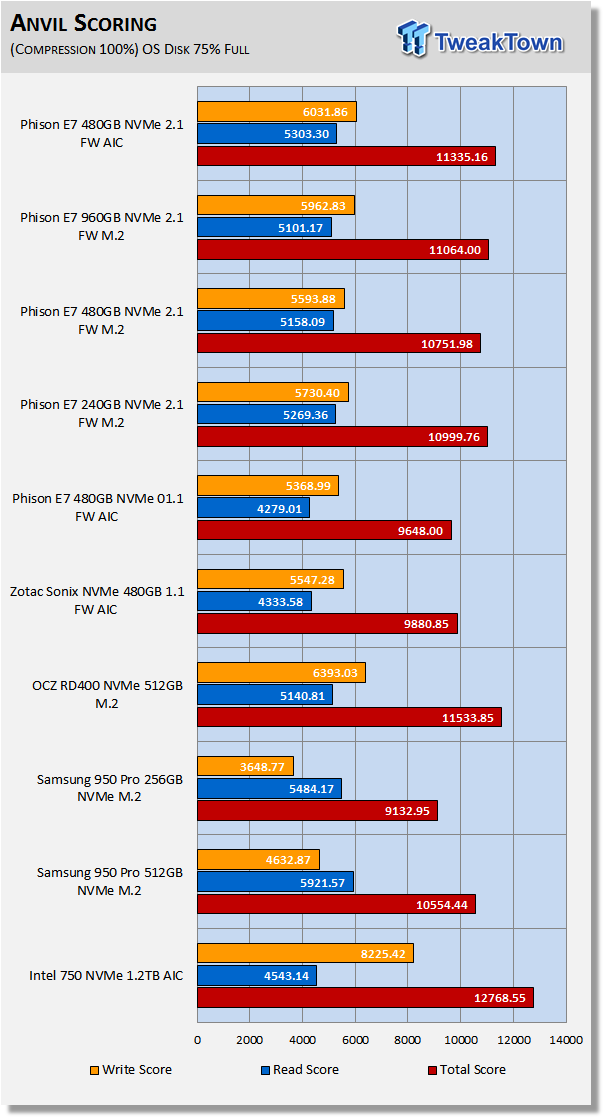
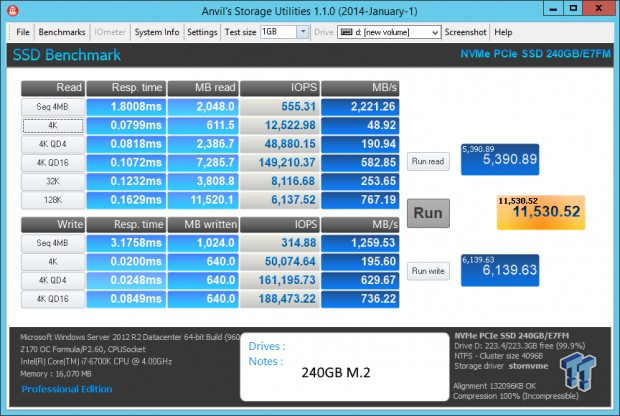
Anvil's scoring gives a good indication of a drive's overall performance. Typically, we want to see a score of well over 10K with 100% incompressible data for NVMe SSDs. All of the E7's with 2.1 firmware can exceed our performance marker easily. In terms of scoring, the E7's with 2.1 firmware easily outperform Samsung's 950 Pro. The E7 AIC with 2.1 firmware nearly catches Toshiba's RD400 512GB.
We note the huge performance increase over the Zotac Sonix due to pSLC caching and superior firmware. If you own a Sonix, the good news is there will be a forthcoming firmware update that will make the Sonix just as potent.
Synthetic Benchmarks – AS SSD
NOTE: All benchmark screenshots are empty secondary volumes. Charts are OS Disk 75% full unless otherwise noted.
AS SSD
Version and / or Patch Used: 1.8.5611.39791
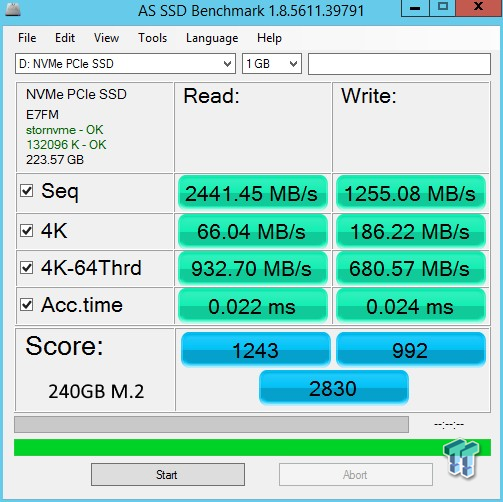
AS SSD determines the performance of SSDs. The tool contains four synthetic as well as three practice tests. The synthetic tests are to determine the sequential and random read/write performance of the SSD.
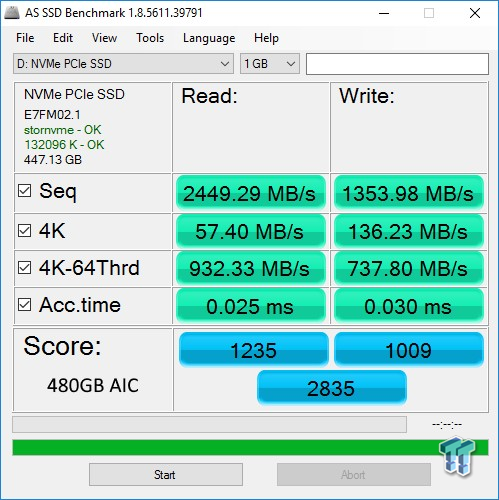
Scoring OS Disk 75% Full
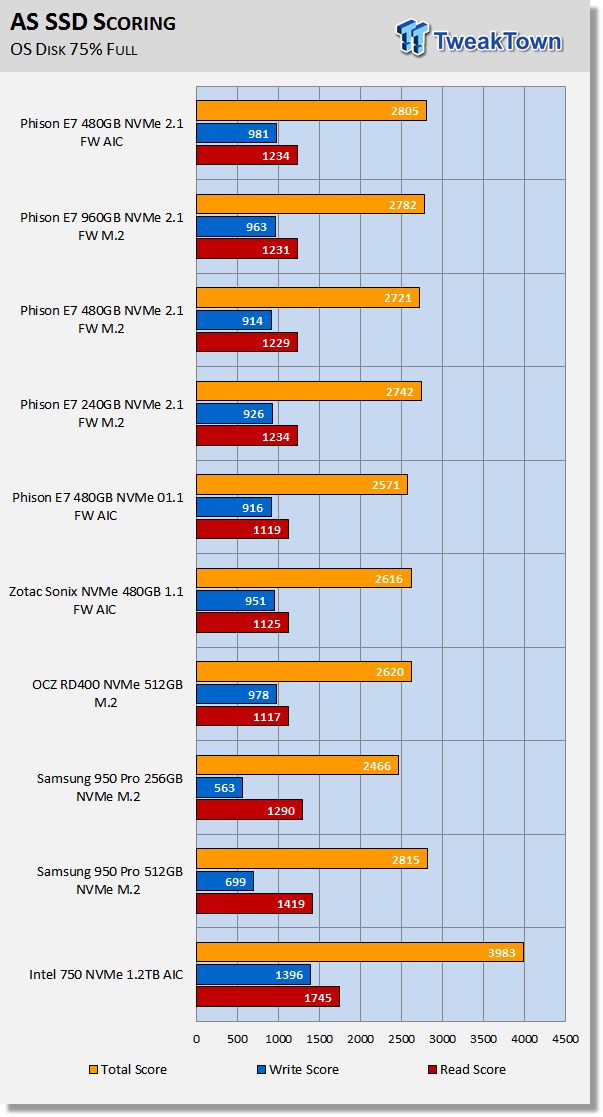
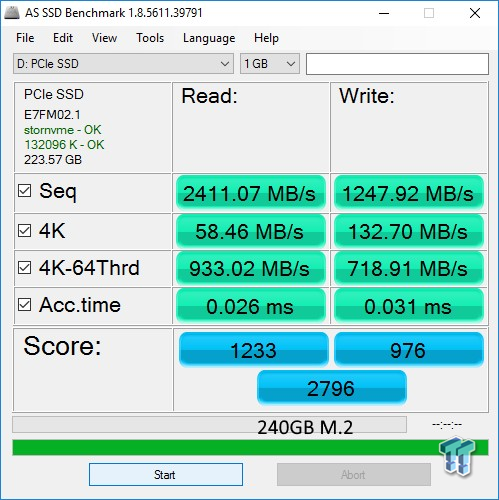
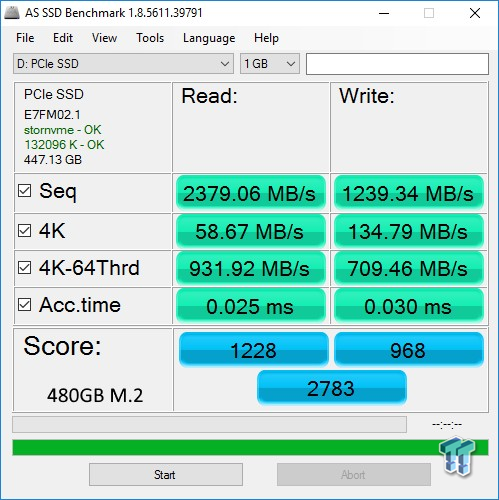
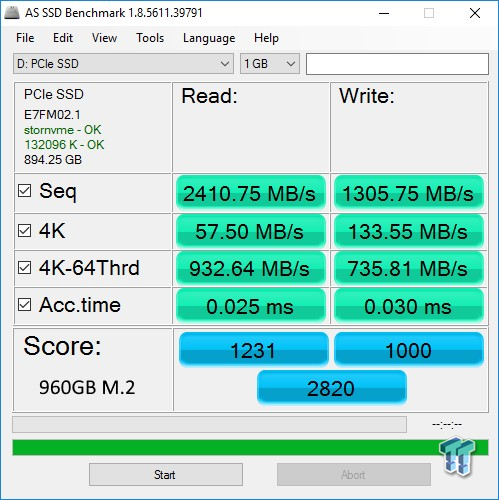
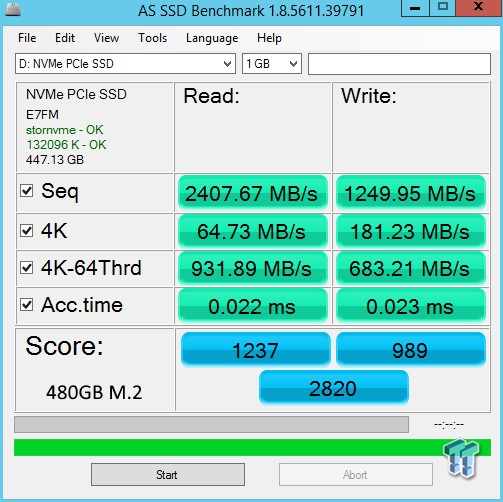
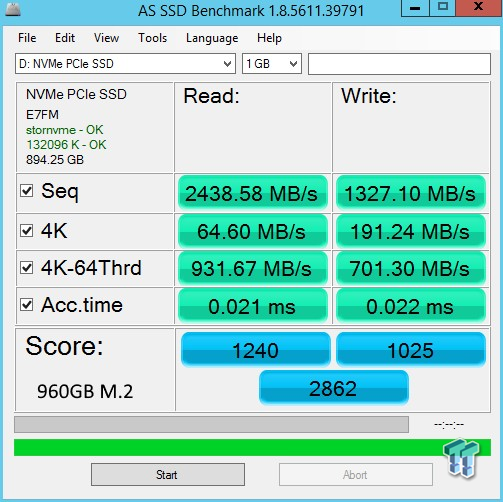
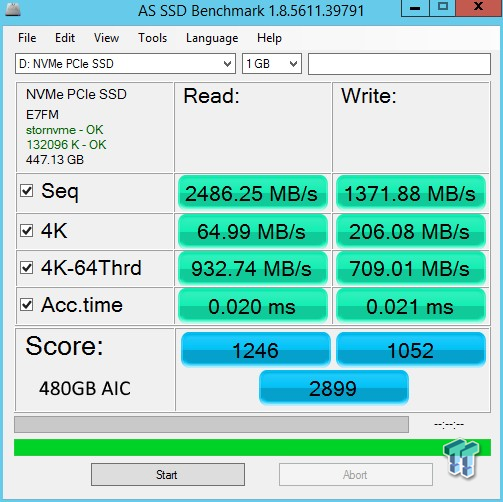
AS SSD is a demanding test and the E7's with FW 2.1 deliver the goods. In this testing, the E7's with FW 2.1 even manage to outperform Toshiba's powerful RD400. Again, we see a large performance increase over the Zotac Sonix with its RC 1.1 firmware.
The 950 Pro delivers a higher total score due to its superior overall read performance. In terms of scoring, the E7 AIC with 2.1 firmware is hot on the heels of the 950 Pro. The Intel 750 1.2TB dominates this test due to its massive IOPS at high queue depths.
Benchmarks (Trace-Based) - PCMark Vantage & PCMark 7
NOTE: All benchmark screenshots are empty secondary volumes. Charts are OS Disk 75% full unless otherwise noted.
Moderate Workload Model
We categorize these tests as indicative of a light to moderate workload environment.
PCMark Vantage - Hard Disk Tests
Version and / or Patch Used: 1.2.0.0
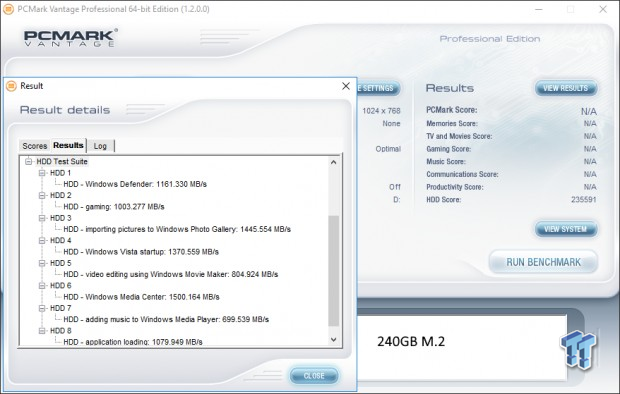
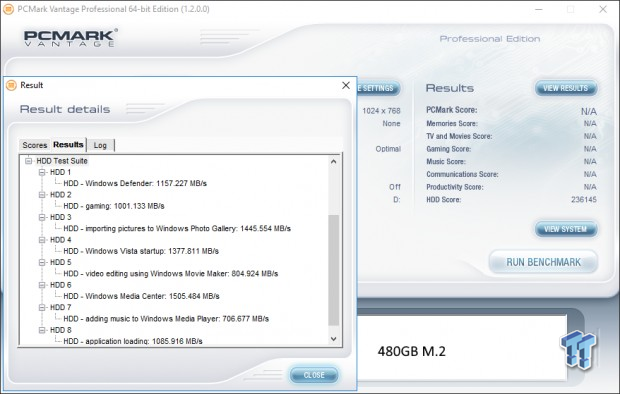
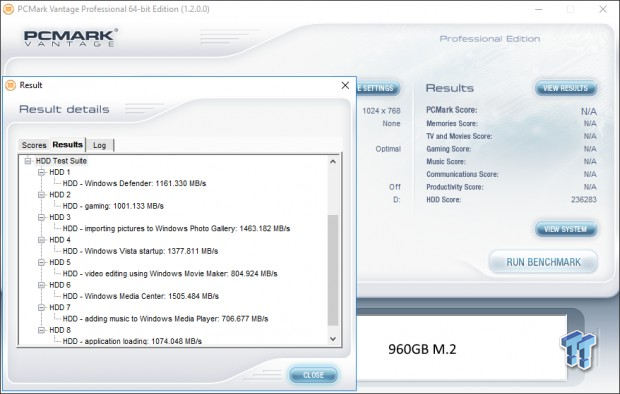
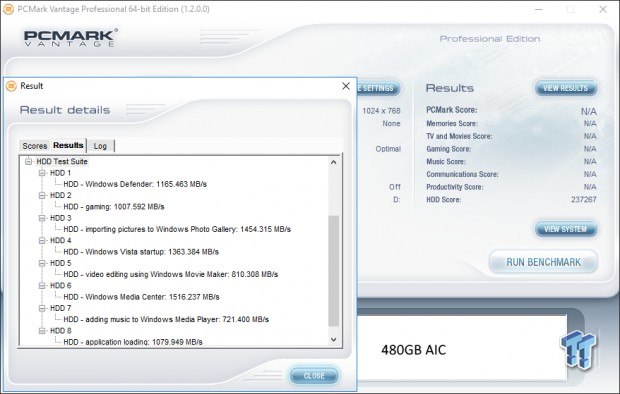
The reason we like PCMark Vantage is because the recorded traces are played back without system stops. What we see is the raw performance of the drive. This allows us to see a marked difference between scoring that other trace-based benchmarks do not exhibit. An example of a marked difference in scoring on the same drive would be empty vs. filled.
Scoring OS Disk 75% Full
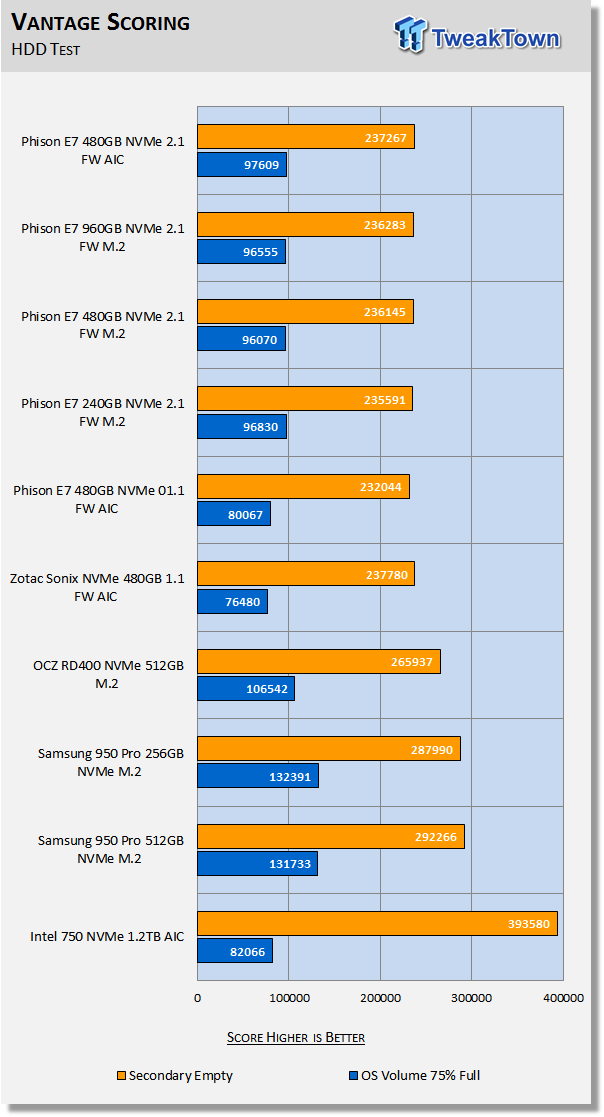
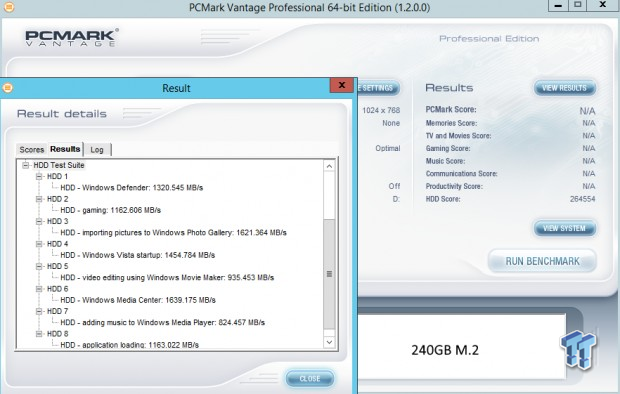
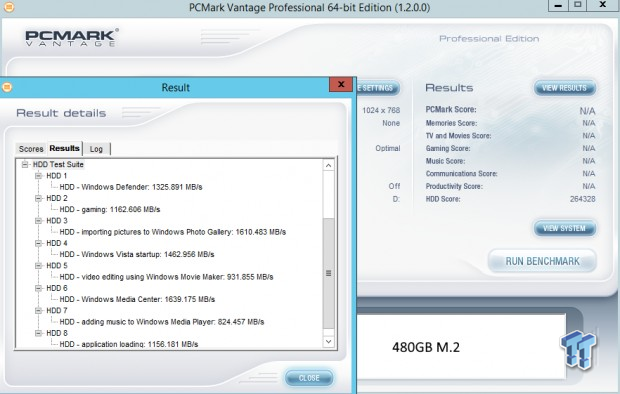
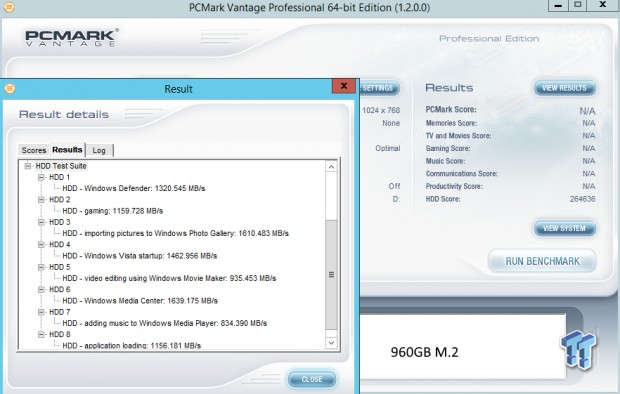
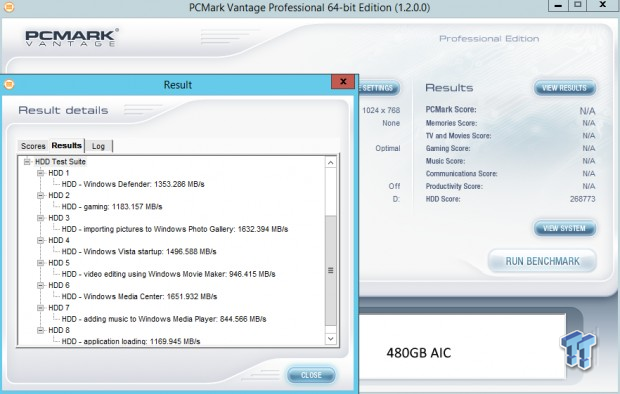
When testing with Vantage, there is always a big drop in performance when data is on the drive. Have a look at the Intel 750 on our chart for an example. We want to see a score of over 90K with an NVMe SSD that is 75% full. E7-powered SSDs couldn't achieve 90K at 75% full, until now.
Look at the Zotac Sonix; it can only hit 76K at 75% full. The E7's with 2.1 firmware that we are testing today smash right past 90K quite easily. Intel's most powerful consumer SSD is not even close to achieving 90K and like its score, the Intel 750 does not deliver a user experience anywhere near as good as the E7's with 2.1 firmware.
PCMark 7 - System Storage
Version and / or Patch Used: 1.4.0
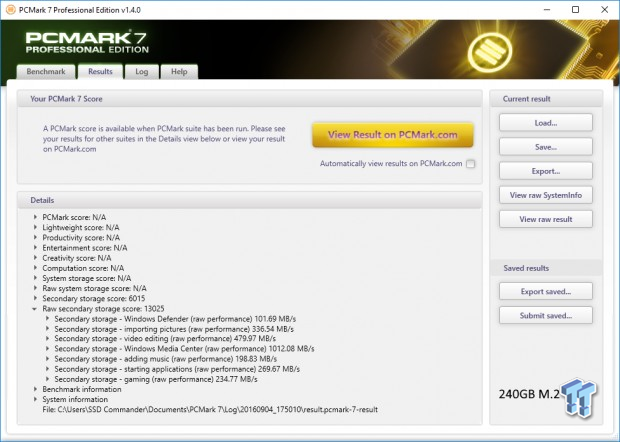
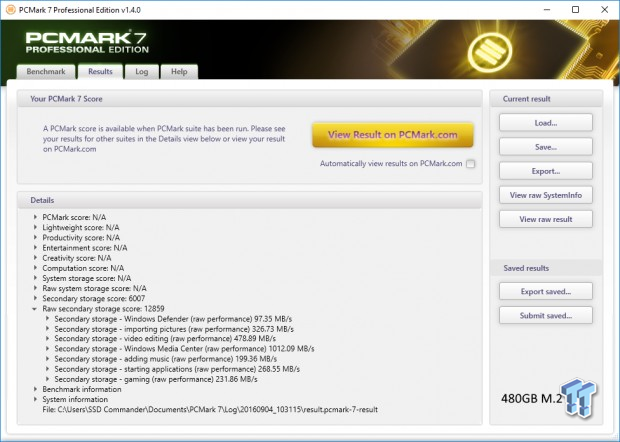
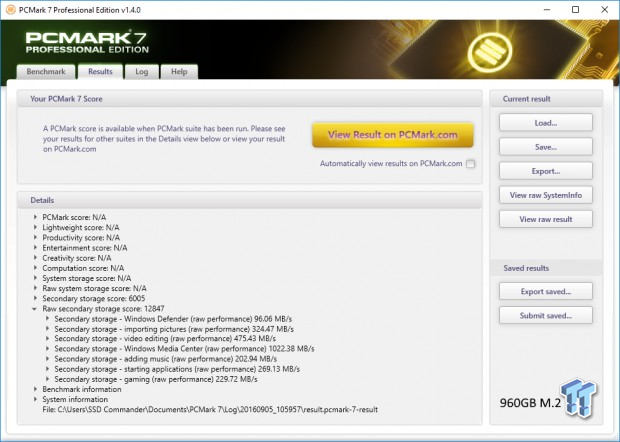
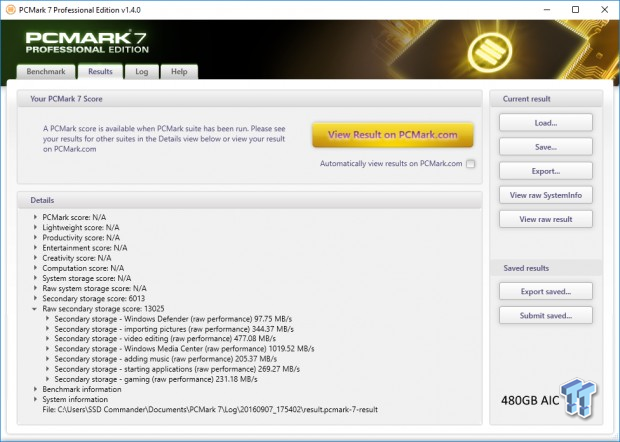
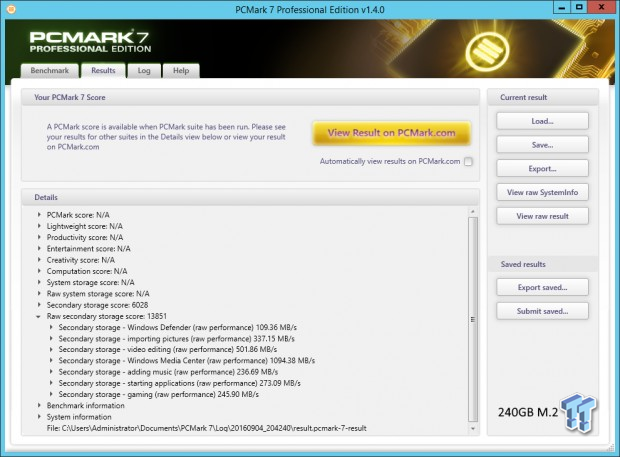
We will look to Raw System Storage scoring for evaluation because it's done without system stops and, therefore, allows us to see significant scoring differences between drives.
Scoring OS Disk 75% Full
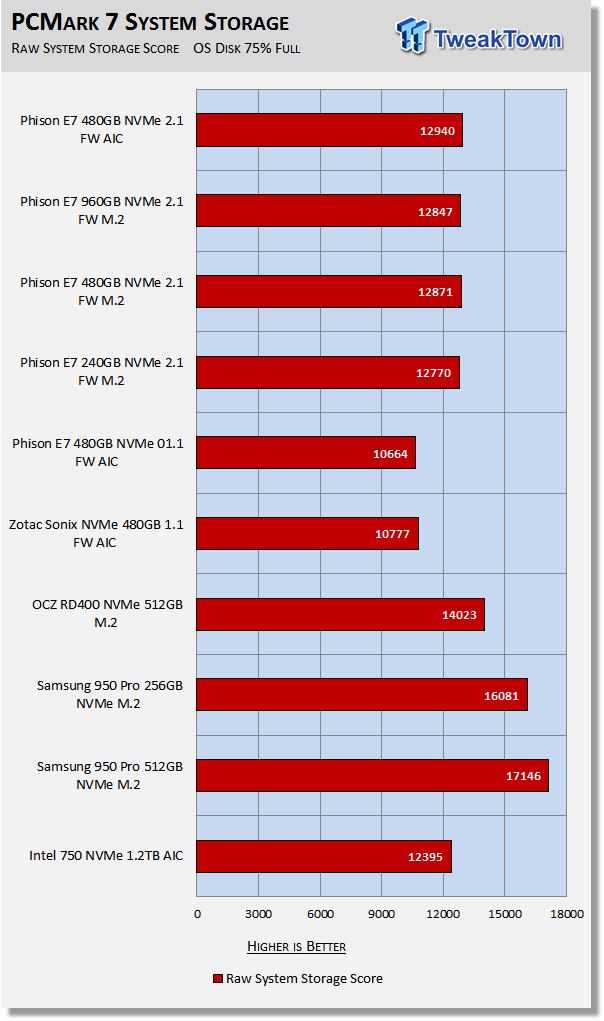
Pecking order remains the same as we saw with our Vantage testing. The E7's with 2.1 firmware all outperform Intel's 750 1.2TB, Samsung's 950 Pro's dominate, and Toshiba's RD400 finishes ahead of the E7's. Again, we note a huge increase in performance over the Zotac Sonix.
All of the E7's with 2.1 firmware are within 170 points of one another. It is nice to see that you don't lose any significant amount of performance with the E7 at the 240GB capacity point.
Benchmarks (Trace-Based) - PCMark 8
NOTE: All benchmark screenshots are empty secondary volumes. Charts are OS Disk 75% full unless otherwise noted.
Moderate Workload Model
We categorize this test as indicative of a light to moderate workload environment.
PCMark 8 - Storage Bandwidth
Version and / or Patch Used: 2.4.304
We use PCMark 8 Storage benchmark to test the performance of SSDs with traces recorded from Adobe Creative Suite, Microsoft Office, and a selection of popular games. You can test the system drive or any other recognized storage device, including local external drives. Unlike synthetic storage tests, the PCMark 8 Storage benchmark highlights real-world performance differences between storage devices.
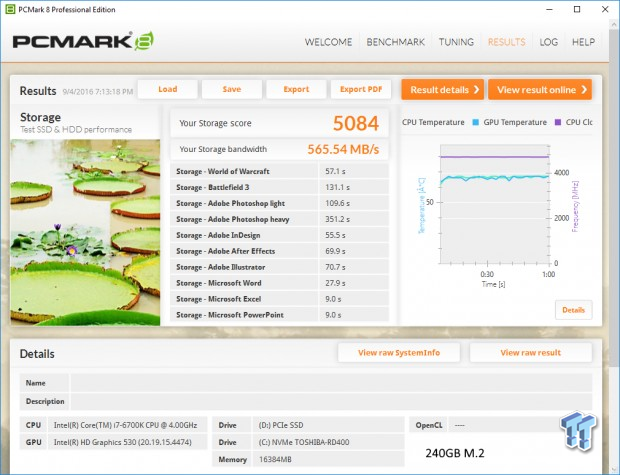
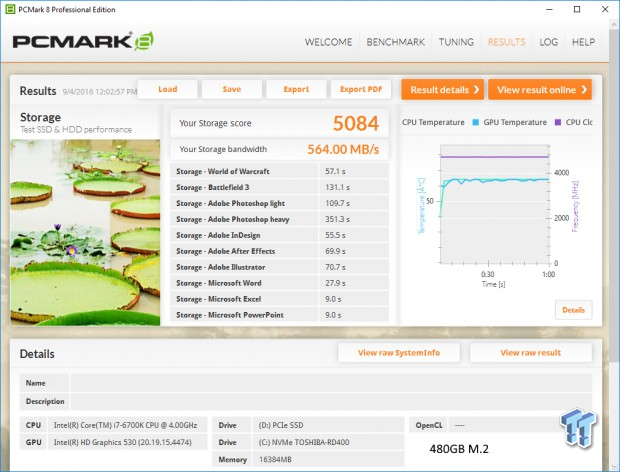
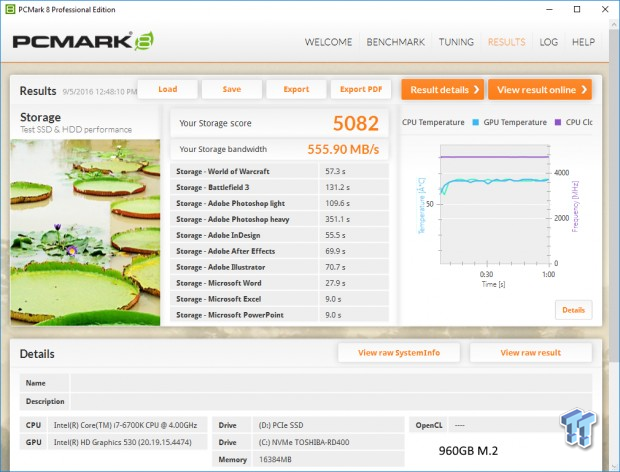
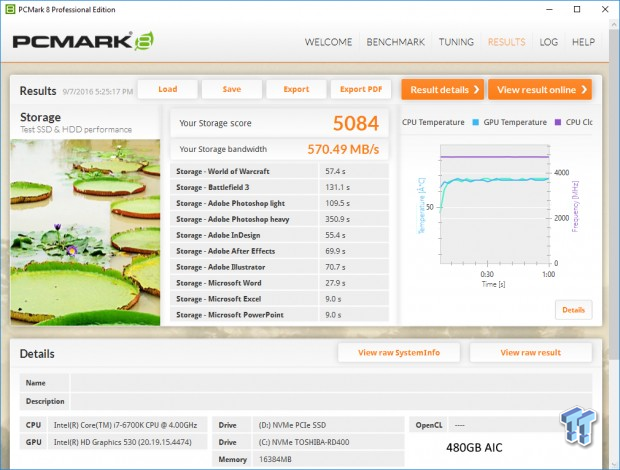
Scoring OS Disk 75% Full
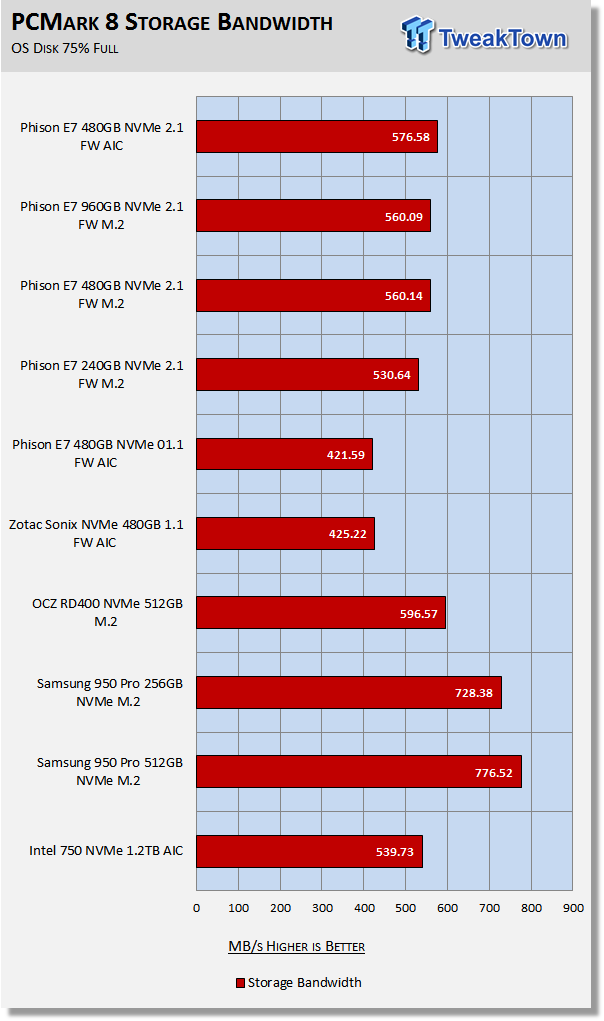
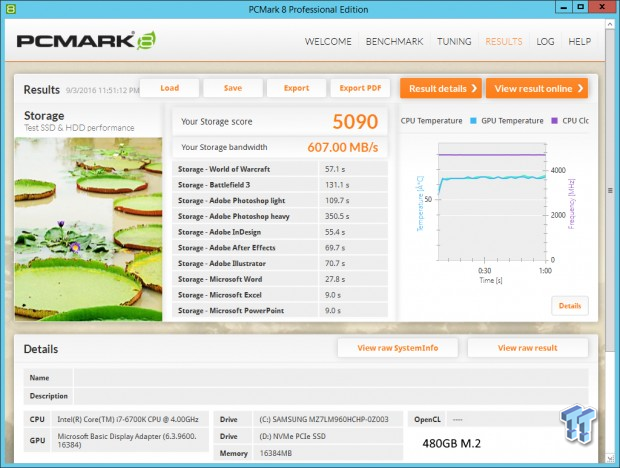
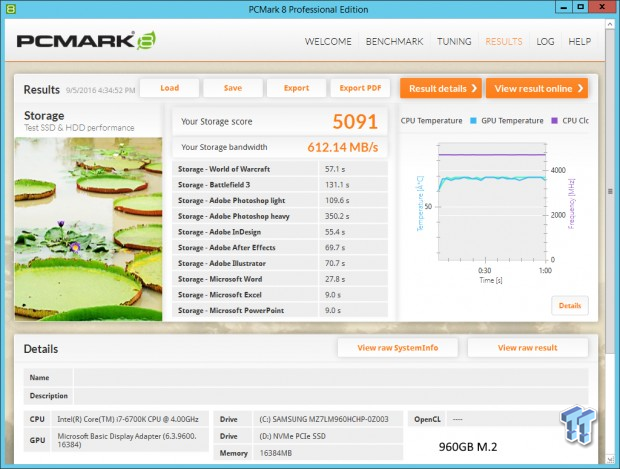
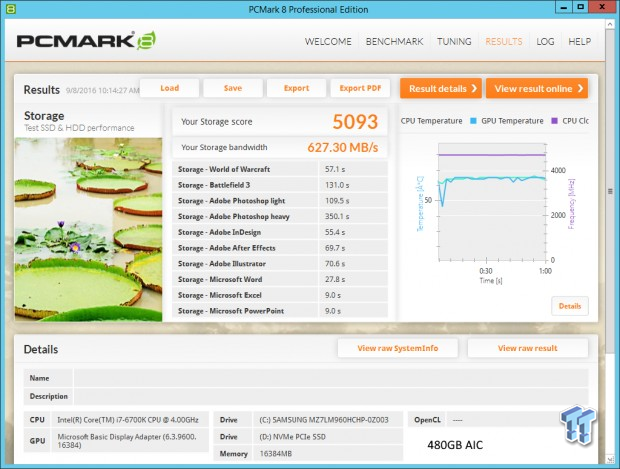
PCMark 8 is the most intensive moderate workload simulation we run. With respect to moderate workloads, this test is what we consider the best indicator of a drive's performance. For some unknown reason, the 960GB M.2 and 480GB AIC manage to score slightly better with data on the drive. This particular test is where we found the Zotac Sonix to be underperforming the most. We want to see storage bandwidth of at least 500 MB/s for NVMe SSDs.
With the new firmware, the E7's have no problem cranking out well over 500 MB/s storage bandwidth. This test highlights something we have been badgering Phison about, a proprietary NVMe driver. Although we are getting more than acceptable performance from the standard Windows NVMe driver, it would be so much better with a proprietary NVMe driver. Hopefully, in the near future, we will get our wish.
Benchmarks – Max IOPS & Disk Response
NOTE: We are providing charts only for these two tests. All drives are running as empty secondary volumes.
Iometer – Maximum IOPS
Version and / or Patch Used: Iometer 2014
We use Iometer to measure high queue depth performance. (No partition one thread-QD32)
Max IOPS Read/Write
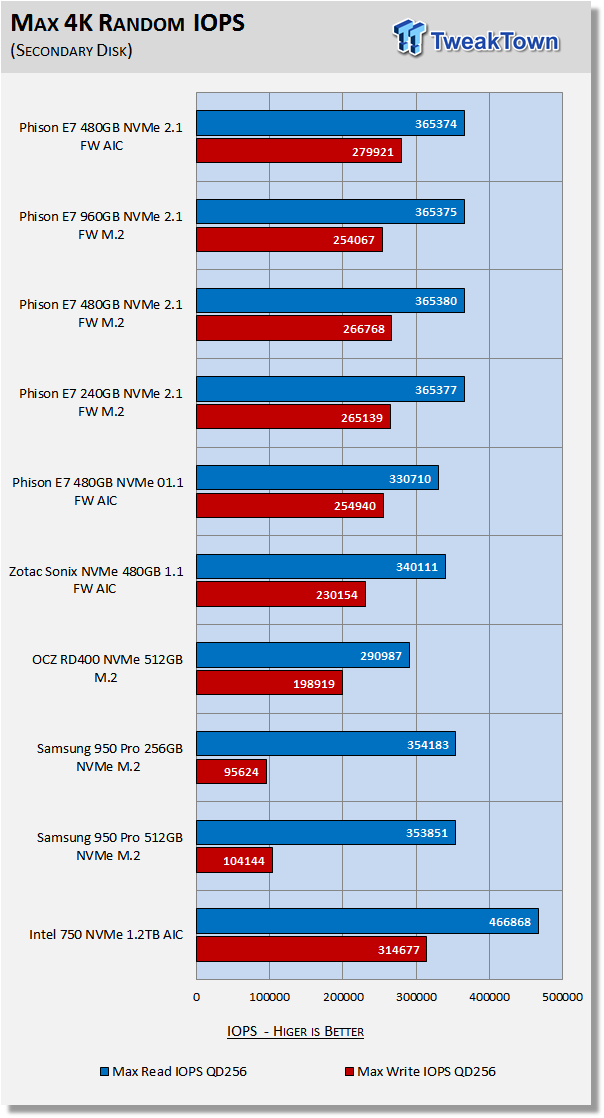
With our configuration, we are able to easily exceed Phison's factory specifications of 300K/200K IOPS. The E7's with 2.1 firmware deliver higher read/write IOPS than all but the Intel 750 1.2TB.
Iometer – Disk Response & QD1 Performance
Version and / or Patch Used: Iometer 2014
We use Iometer to measure disk response times. Disk response times are measured at an industry accepted standard of 4K QD1 for both write and read. Each test runs twice for 30 seconds consecutively, with a 5-second ramp-up before each test. We partition the drive/array as a secondary device for this testing.
Avg. Read/Write Response at QD1
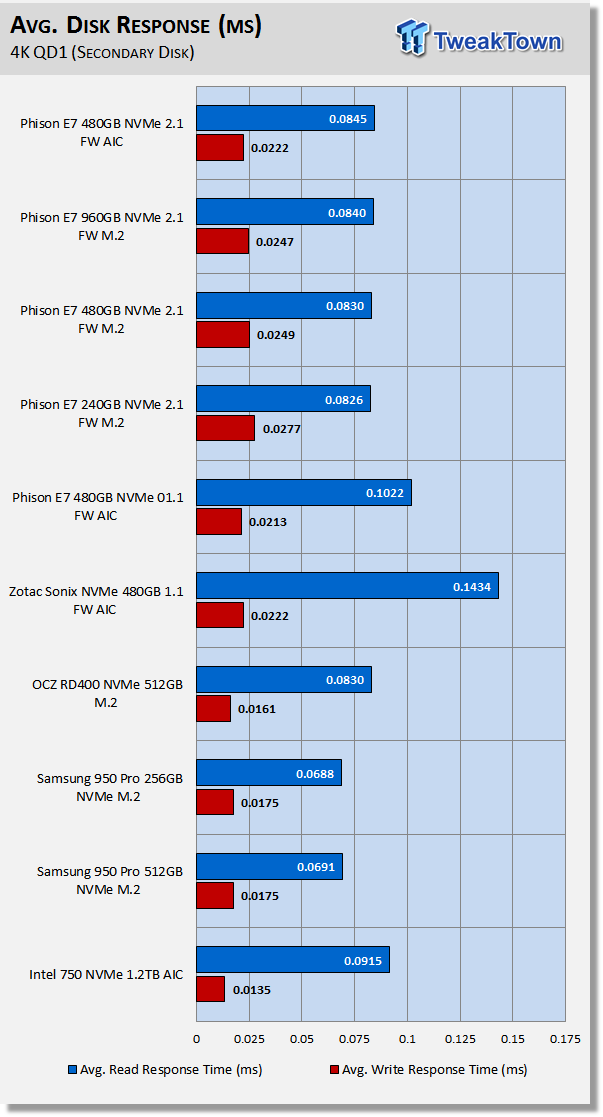
We note a massive improvement in read response (4K QD1) over 1.1 firmware.
Benchmarks - Transfer Rate
NOTE: All benchmark screenshots are empty secondary volumes. We are not providing any comparison charts for this test because write transfer rates have substantially increased with Windows 10 Anniversary Edition. This increase in write transfer rates is due to a relaxing of Windows power mode switching in Anniversary Edition. This is something that has plagued Windows since the introduction of Windows 8. We are very happy to see the issue remedied with Windows 10 Anniversary Edition.
DiskBench - Directory Copy
Version and / or Patch Used: 2.6.2.0
We use DiskBench to time a 28.6GB block (9,882 files in 1,247 folders) composed primarily of incompressible sequential and random data as it's transferred from our 1TB Toshiba RD400 PCIe NVME SSD to our test drive. We then read from a 6GB zip file that's part of our 28.6GB data block to determine the test drive's read transfer rate. Our system is restarted prior to the read test to clear any cached data, ensuring an accurate test result.
Write Transfer Rates
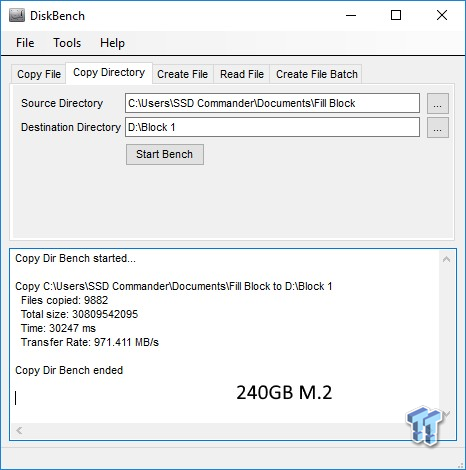
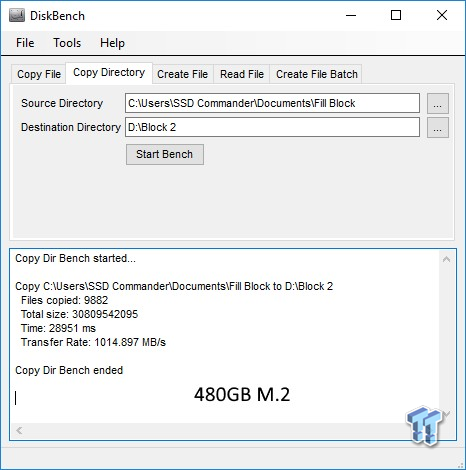
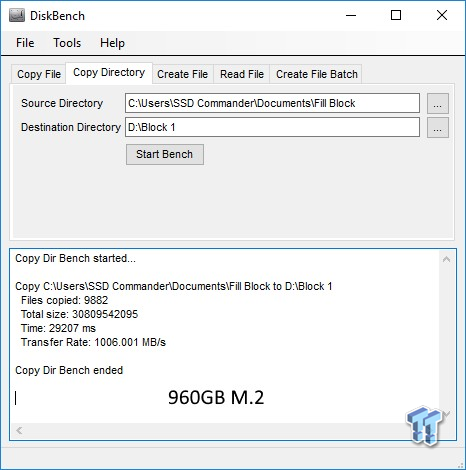
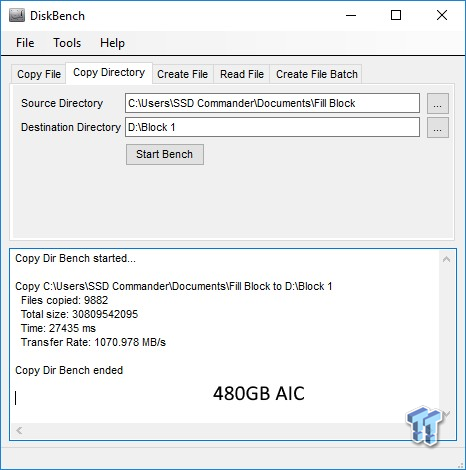
Write transfer rates are double what we were getting with Windows 10 build 10586. This is what we get from Windows 7 and Server 2008 R2 - as it should be. We verified this with Samsung's SM961, and we went from a 624 MB/s transfer rate to 1188 MB/s. We will be making new write transfer rate charts for Windows Anniversary Edition as best as we can considering we do not have all of the drives on our charts in the lab any longer.
Read Transfer Rate
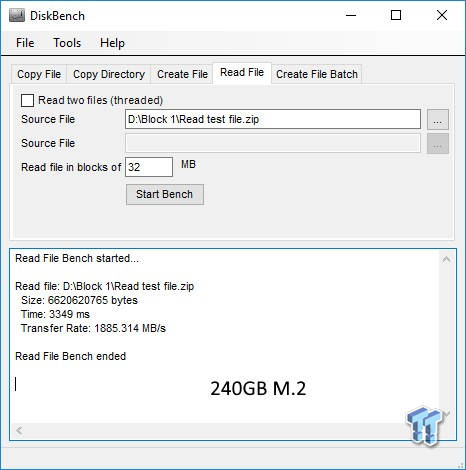
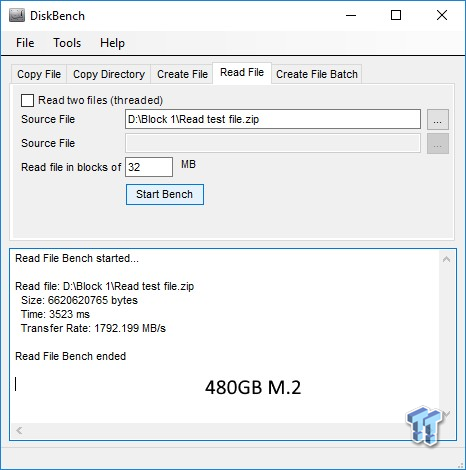
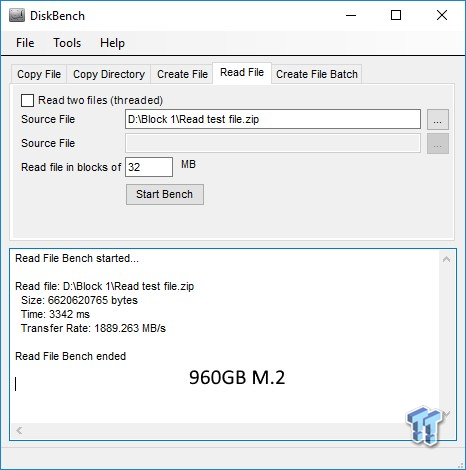
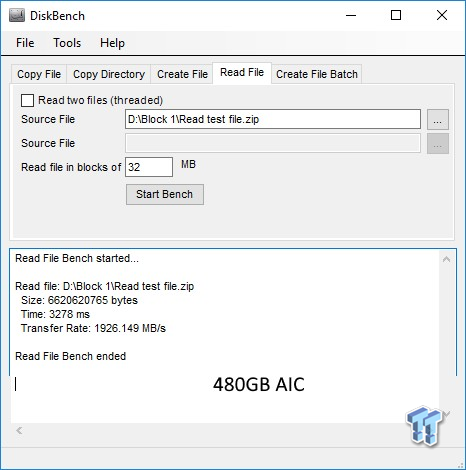
The E7's with 2.1 firmware deliver blistering fast read transfers. Although not charted, the E7's are second only to the RD400 and SM961 in read transfer performance.
Maxed-Out Performance (MOP)
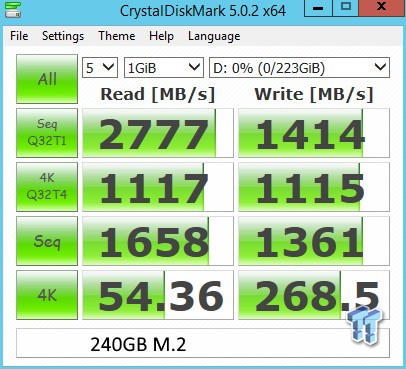
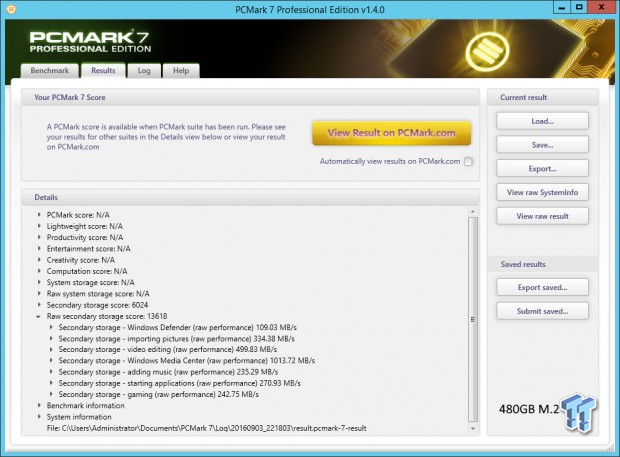
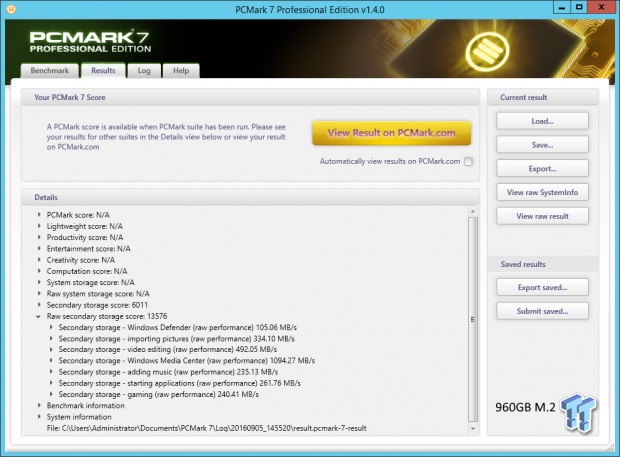
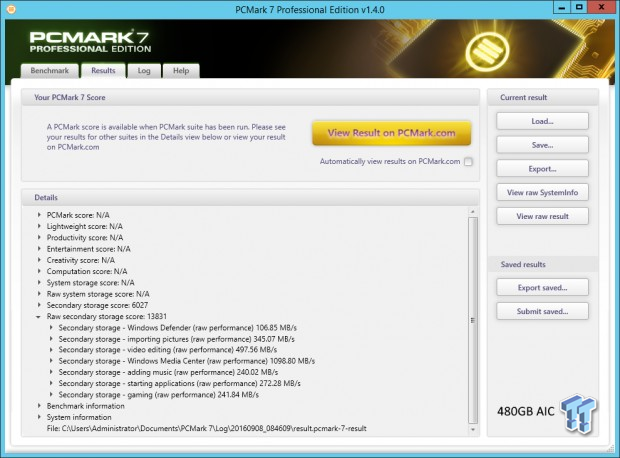
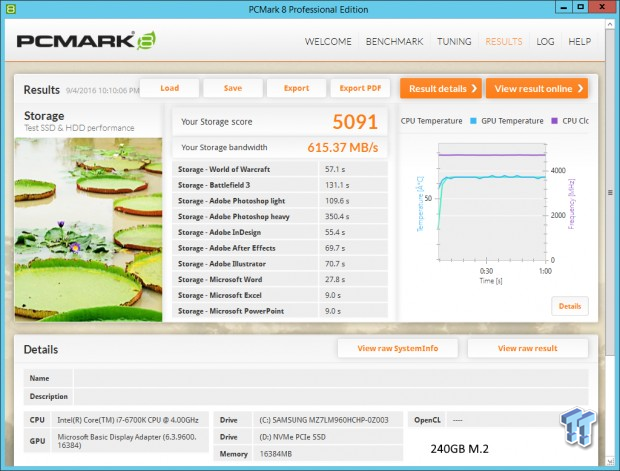
This testing is just to see what the drive is capable of in an FOB (Fresh Out of Box) state under optimal conditions. We are utilizing Windows Server 2012 R2 64-bit for this testing. Same Hardware, just an OS change. The Windows 10 NVMe driver does not deliver as good of performance as the Windows 8.1 NVMe driver.
These results are much closer to what you will get with Windows 8.1 because Server 2012 R2 and Windows 8.1 use the same NVMe driver. Windows 2008 R2 would deliver even better performance, but ONLY with a proprietary NVMe driver. Because there is no Phison proprietary NVMe driver in existence, we are stuck using Server 2012 R2.
CDM MOP
Anvil's MOP
AS SSD MOP
Vantage MOP
PCMark 7 MOP
PCMark 8 MOP
Final Thoughts
With Phison's new 2.1 firmware, E7-powered SSDs are indeed ready for primetime. If you are looking for an NVMe SSD, E7-powered drives are worth taking a close look at. The performance delivered is blistering fast, and the user experience is on par with the fastest consumer-based NVMe SSDs ever made. It all comes down to one thing; user experience.
The only gripe we have is a small one; the lack of a proprietary NVMe driver. If Phison had one, we believe the E7 would give Toshiba's RD400 a run for its money. Additionally, Windows 7 users would be able to enjoy E7 SSDs running at their full potential. We gave our E7's a try with Windows standard NVMe driver for Windows 7 and Server 2008, and we can tell you it's a no-go, just as it is for any NVMe SSD without a proprietary driver.
TweakTown has been working with Phison providing feedback on different firmware revisions and how they perform. We are happy with firmware 2.1, very happy, and we know you will be as well. We want to thank Phison for providing us the opportunity to be first to publish benchmarks with their new firmware. Because this is a performance preview, we do not give an award. We will save that for retail E7 products coming down the pipe. Although we will not be giving an award today, we will provide the Phison E7 with firmware 2.1 a TweakTown recommendation. Well done, Phison.

