











NVIDIA's built-in statistics overlay has quietly picked up one of its most requested missing features. Version 11.0.9 of the NVIDIA App adds CPU temperature, clock speed, and power consumption to the overlay.
NVIDIA notably did not mention the addition in the official 11.0.9 release notes, which only document DLSS 4.5 Ray Reconstruction, per-application Resizable BAR controls, and a handful of interface changes. It went largely unnoticed until Reddit picked it up.
Popular Now: Kojima shares details on Sony breakup, says PlayStation abruptly cancelled PHYSINT months agoIt's worth mentioning that NVIDIA has offered CPU monitoring through its separate FrameView utility for years, but those metrics were not available in the NVIDIA App's own in-game statistics. The new update finally brings them directly into the same interface used for GPU, FPS, and DLSS information.
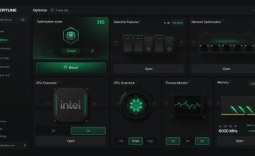
To enable the new metrics, open the NVIDIA App and press Alt+Z to bring up the overlay. Head into the Statistics section at the bottom, switch to Custom view, and toggle the overlay on with Alt+R. From there, you can pick which stats appear, adjust font size and colour, and choose between a horizontal readout or a vertical stack if you have a lot on screen at once. You can enable CPU temperature, clock speed, and power alongside the existing GPU, FPS, and DLSS information.

It is a genuinely useful update for most GeForce users, and for anyone running DLSS it means you can now confirm which preset is actually active in a given game while keeping an eye on CPU numbers at the same time, all without opening a third-party app.

Frequently Asked Questions
Open a question for an answer from TweakTown's coverage of this news, or ask your own below.
How do you turn on the new CPU temperature and clock speed stats in the NVIDIA App overlay?
Which NVIDIA App version adds CPU monitoring to the in-game statistics overlay?
Does the new overlay show per-core CPU temperatures or only one overall reading?
What CPU-related metrics can the NVIDIA App overlay now display alongside GPU and FPS data?
Have a question about this content not listed here? Ask below and TweakBot will answer it.

That said, it is not a full replacement for dedicated monitoring software yet. CPU temperature is currently a single overall reading rather than per-core data, and the overlay still lacks VRAM and system RAM usage. Anyone who needs that level of detail will still want RTSS or HWiNFO running alongside it.