


Our Verdict
Introduction, Drive Specifications, Pricing & Availability
MyDigitalDiscount's SBX series M.2 NVMe SSDs are much faster than any SATA SSD. To this point, the one thing SATA had in its favor was lower cost per gigabyte of storage than NVMe could offer. Now MDD's SBX is challenging SATA on the price front as well.
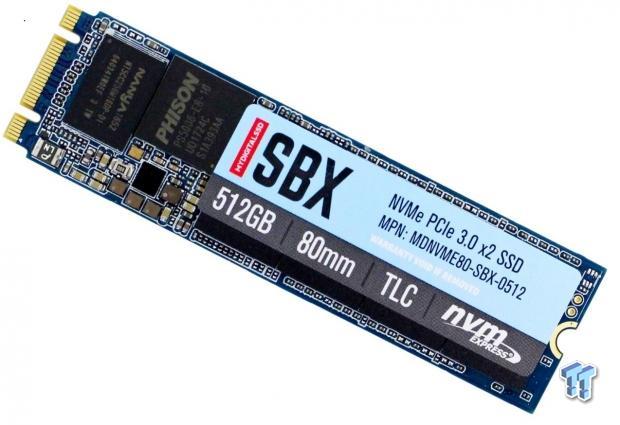
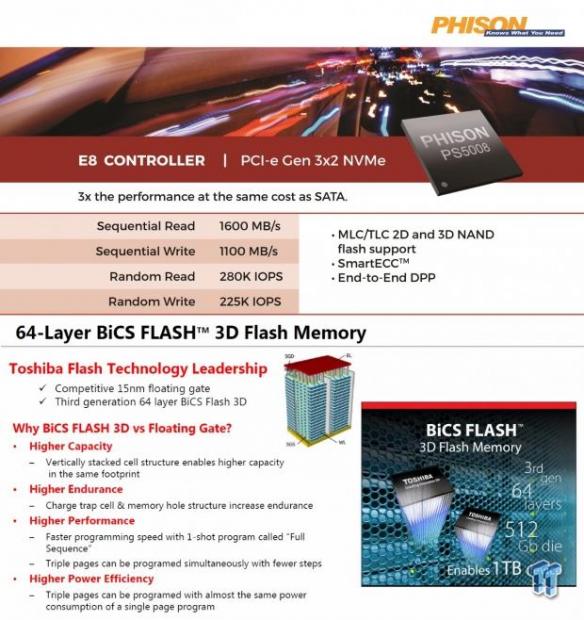
MDD's SBX pairs Phison's PS5008-E8 (E8) 4-channel 2-lane NVMe controller with BiCS 3 64-layer 3D flash to create a powerful yet inexpensive SSD capable of delivering performance that is up to 3X better than SATA has to offer.
MDD really made a name for themselves with their last major NVMe SSD, the MDD BPX. To this day it is still one of our all-time favorite SSDs. What made the BPX so popular was that it offered far and away the best value on the NVMe front.
MDD's SBX is following in the BPX' footsteps. Like the BPX was at the time, MDD's SBX is currently the lowest cost NVMe SSD on the market. The SBX represents the first time we've seen NVMe SSDs priced similarly to SATA.
Phison designed their E8 controlled SSDs to primarily compete with the likes of Intel's 600p Series. The SBX is designed to not only be cheaper than Intel's 600p, but at the same time deliver better performance despite being only a 2-lane device.
MDD's SBX is a Gen3 x2 NVMe SSD. Having 2-lanes instead of four like we typically see, means that the SBX is more power efficient than most 4-lane SSDs. It is also cheaper. The other side of the coin is that with only 2-lanes, the SBX doesn't deliver sequential performance that is as high as we are used to seeing from most 4-lane NVMe SSDs.
However, as you will see when we get to the numbers, MDD's SBX is no slouch on the performance front. In-fact, the SBX actually outperforms many 4-lane SSDs currently on the market. We already demonstrated this with our Phison E8 performance preview.
Our Latest SSD Review Coverage
- Phison E37T SSD Controller Exclusive Preview - The Fastest DRAMless SSD Platform Yet
- Seagate FireCuda X1070 4TB SSD Review - A New Mainstream Contender
- Micron 3610 2TB SSD Review - DRAMless QLC at 11,000 MB/s
- SK hynix Platinum P51 2TB SSD Review - A Powerful Gen5 Alternative
- Biwin Black Opal X570 Pro 8TB SSD Review - Massive Capacity with Elite Performance
NVMe performance for the price of SATA sounds good to us, now let's see for ourselves what the SBX is serving up.
Specifications
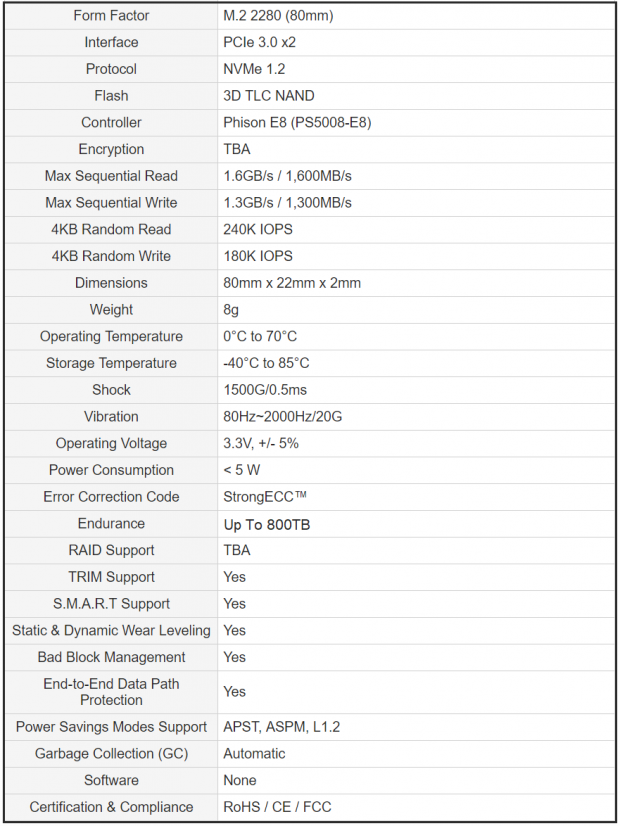
MyDigitalDiscount's SBX is available in four capacities. All capacity points are single sided M.2 x2280 designs. Available capacities: 128GB, 256GB, 512GB and 1024GB.
- Sequential Read: up to 1,600 MB/s
- Sequential Write: up to 1,300 MB/s
- Max 4K Random Read Speed: up to 240,000 IOPS
- Max 4K Random Write Speed: up to 180,000 IOPS
- Endurance: up to 800 TBW
- MTBF: 1.5 Million Hours
- Warranty: 3-Year Limited Warranty
- SLC caching
- Smart ECC
- End-to-End DPP
- TRIM
- Garbage Collection
The SBX is currently selling at MyDigitalDiscount for: 128GB = $56.42, 256GB = $89.15, 512GB = $149.92, 1TB = $318.71
Availability: Available now.
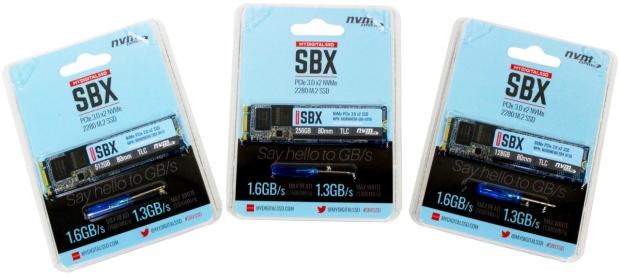
Drive Details
MDD SBX M.2 PCIe NVMe SSD
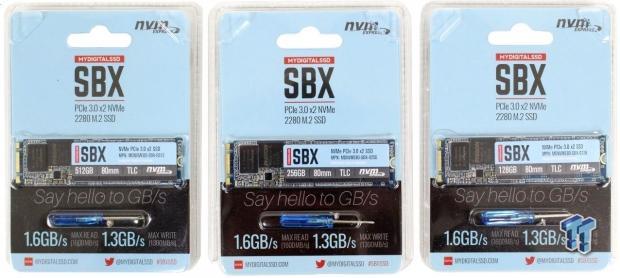
The SBX ships in a protective transparent blister pack. The drive itself is visible as is a small screwdriver and mounting screw.
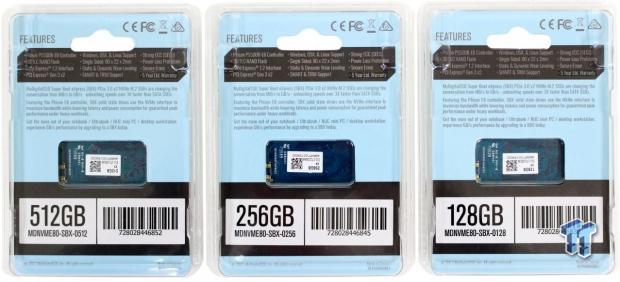
Through the back of the transparent blister pack, features of the enclosed SSD can be read. The SSDs capacity is also advertised here.
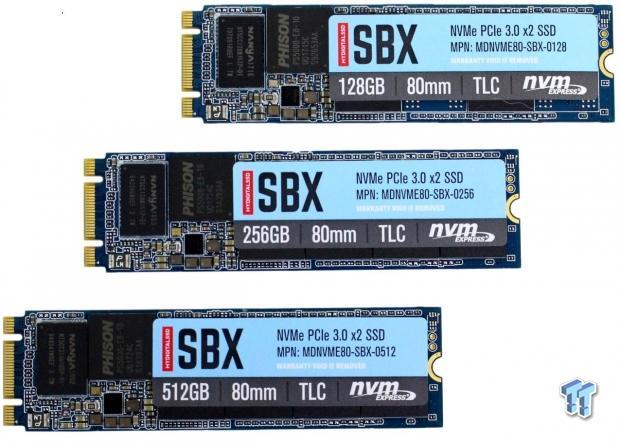
A colorful label covers the drive's flash packages. The model and other relevant information is advertised here.
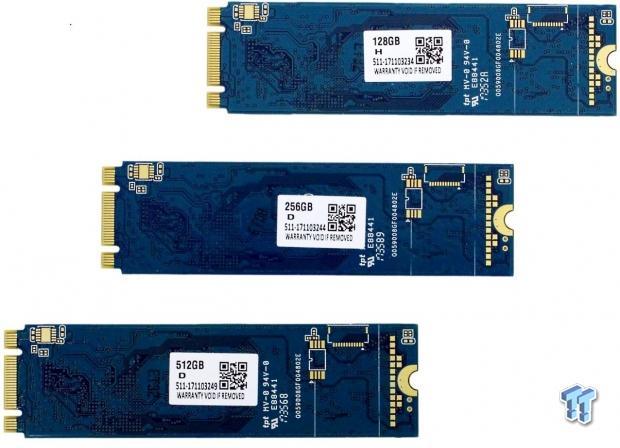
The other side of the PCB is devoid of components, making the SBX a single-sided design.
Test System Setup, Drive Properties & SSD Toolbox
Jon's Consumer PCIe SSD Z270 Intel Review Test System Specifications
- Motherboard: ASRock Z270 Taichi - Buy from Amazon / Read our review
- CPU: Intel Core i7 7700K @ 5.0GHz - Buy from Amazon / Read our review
- Cooler: Swiftech H2O-320 Edge - Buy from Amazon / Read our review
- Memory: Corsair Vengeance LPX DDR4 16GB 3200MHz - Buy from Amazon
- Video Card: Onboard Video
- Case: IN WIN X-Frame - Buy from Amazon / Read our review
- Power Supply: Seasonic Platinum 1000 Watt Modular - Buy from Amazon / Read our review
- OS: Microsoft Windows 10 Professional 64-bit - Buy from Amazon
We would like to thank ASRock, Crucial, Intel, Corsair, RamCity, IN WIN, and Seasonic for making our test system possible.
Drive Properties
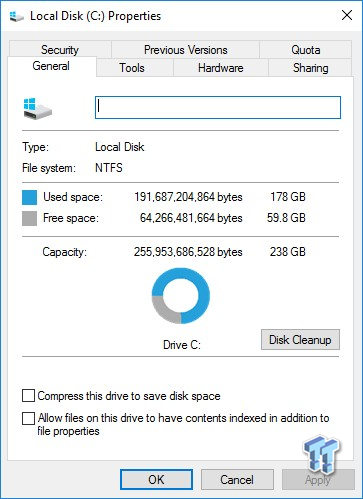
MDD SBX 256GB M.2 PCIe NVMe SSD OS Disk 75% Full
MDD SBX 512GB M.2 PCIe NVMe SSD OS Disk 75% Full

The majority of our testing is performed with our test drive as our boot volume. Our boot volume is 75% full for all OS Disk "C" drive testing to replicate a typical consumer OS volume implementation. We feel that most of you will be utilizing your SSDs for your boot volume and that presenting you with results from an OS volume is more relevant than presenting you with empty secondary volume results.
System settings: Cstates and Speed stepping are both disabled in our systems BIOS. Windows High-Performance power plan is enabled. Windows write caching is enabled, and Windows buffer flushing is disabled. We are utilizing Windows 10 Pro 64-bit OS (Build 14393) for all of our testing except for our MOP (Maxed-Out Performance) benchmarks where we switch to Windows Server 2012 R2 64-bit. Empty Windows 10 benchmark screenshots will also be shown on our MOP page.
Please note: When comparing our results to those of other review sites, look at page 10 Maxed Out Performance-Windows 10 which is done with the disk empty.
Benchmark screenshots will be shown 256GB model first followed by the 512GB model. No screenshots for the 128GB model will be shown. The 128GB model will appear on our charts.
Synthetic Benchmarks - ATTO & Anvil Storage Utilities
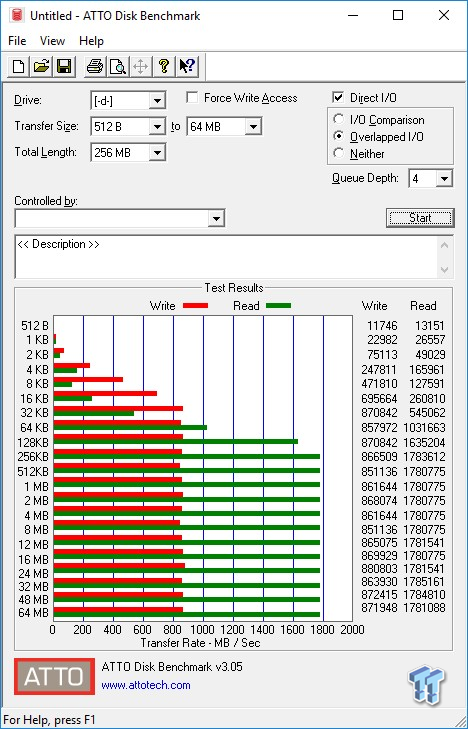
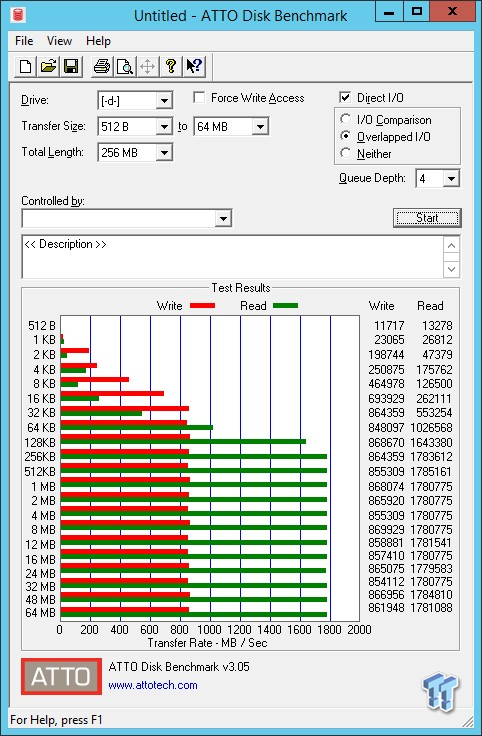
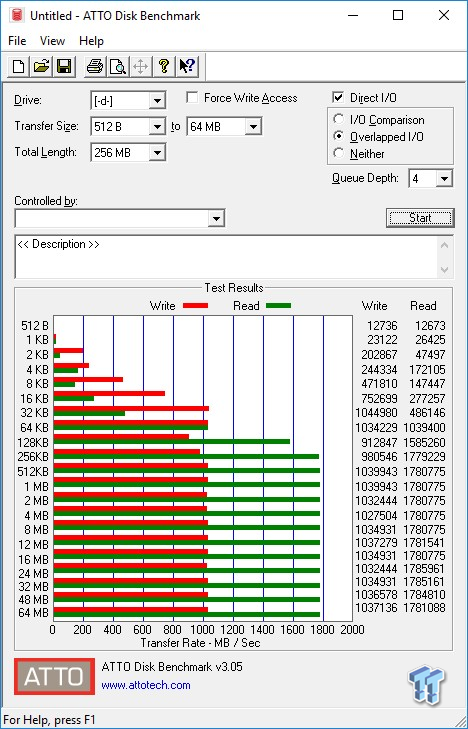
ATTO
Version and / or Patch Used: 3.05
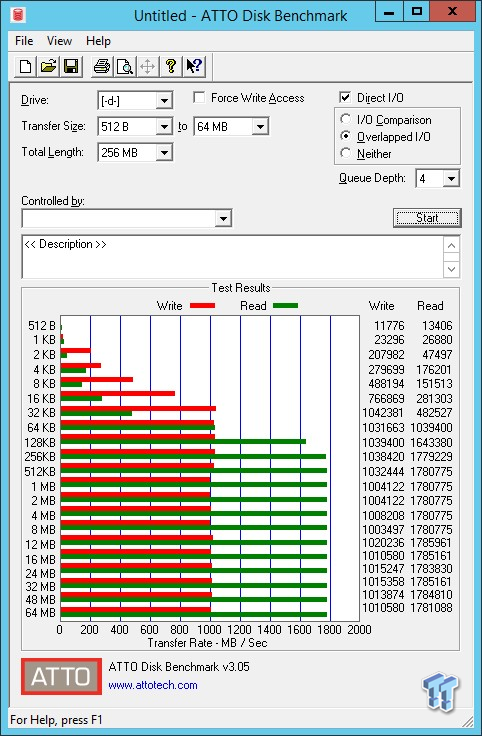
ATTO is a timeless benchmark used to provide manufacturers with data used for marketing storage products. When evaluating ATTO performance, we focus on the drive's performance curve.

Somehow, we lost our screenshot of the 512GB model. So, all we have to present for a screenshot is the 256GB model.
Sequential Write
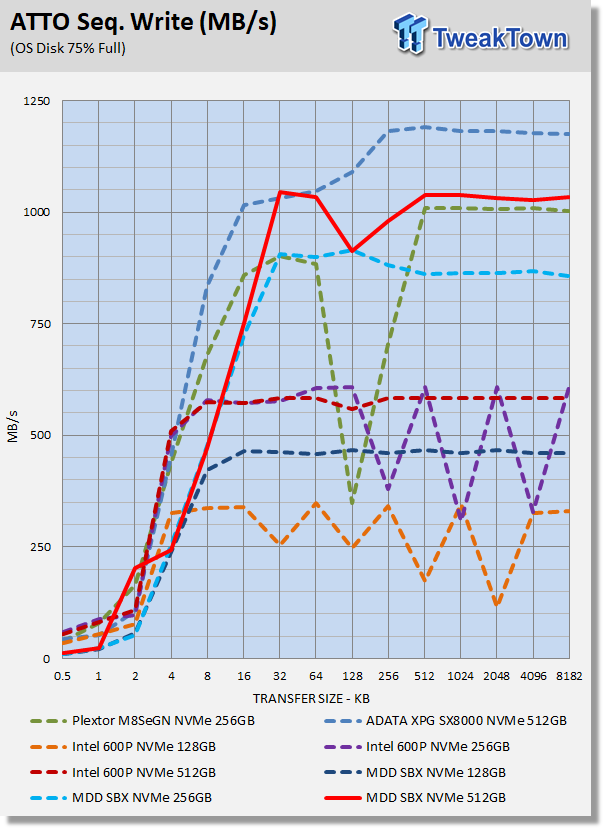
We would like to see performance ramp up a bit faster, but we are pleased to see no large dips in performance like we see from the Intel 600p.
Sequential Read
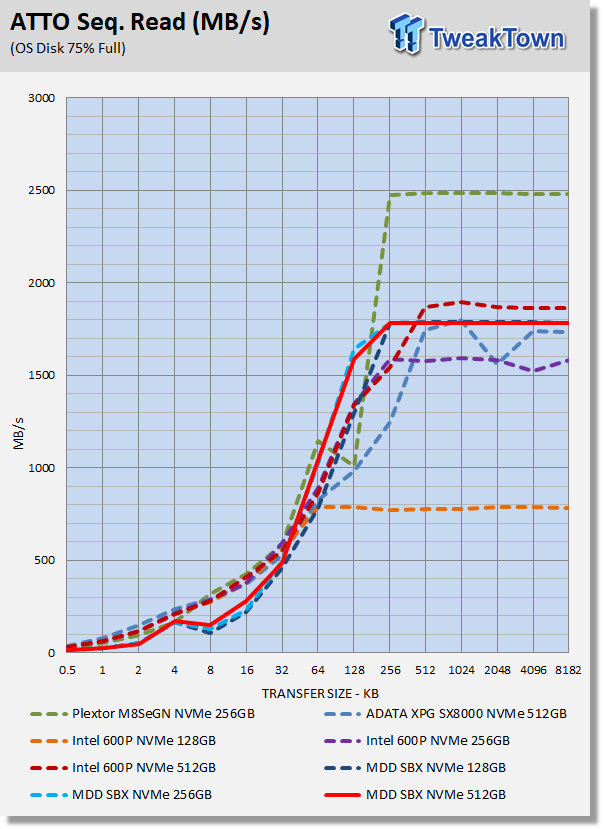
Here again, we would like to see performance ramp up faster. This time we are able to hit max factory sequential specifications, unlike the previous test.
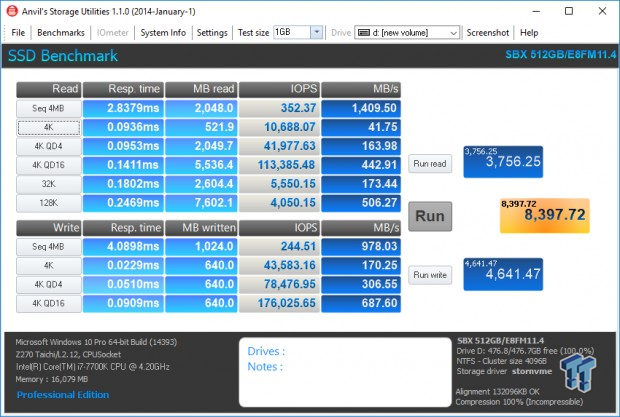
Anvil Storage Utilities
Version and / or Patch Used: 1.1.0
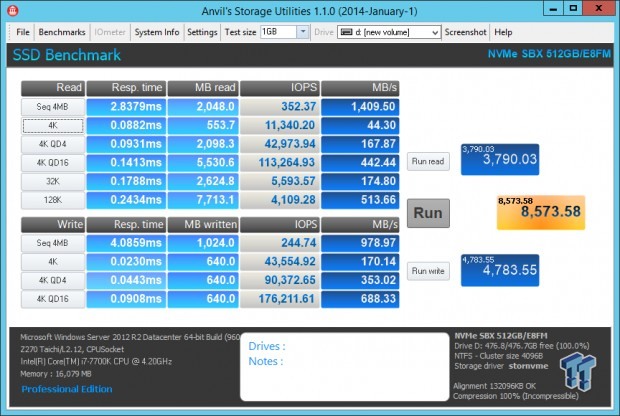
Anvil's Storage Utilities is a storage benchmark designed to measure the storage performance of SSDs. The Standard Storage Benchmark performs a series of tests; you can run a full test or just the read or write test, or you can run a single test, i.e. 4k QD16. When evaluating performance with Anvils, we focus on total score. When evaluating NVMe SSDs we are typically looking for a minimum total score of over 10K. We place a greater importance on read performance than write performance.


Scoring
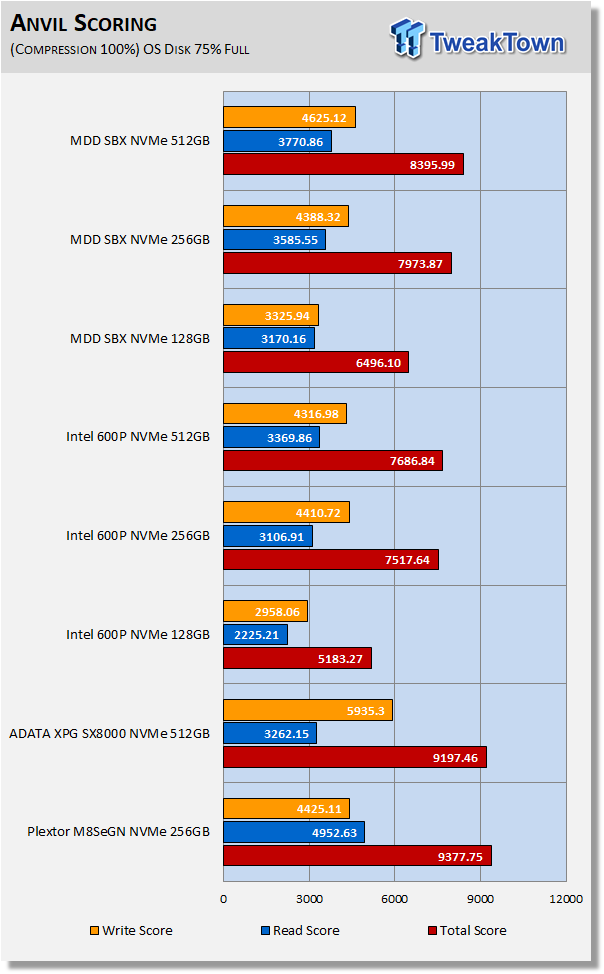
None of the drives in our test pool can give us our 10K, but we don't expect to see 10K from value-oriented SSDs. The SBX performs as intended, easily beating Intel's 600p at all capacity points despite a 2-lane disadvantage.
(Anvil) Read IOPS through Queue Depth Scale

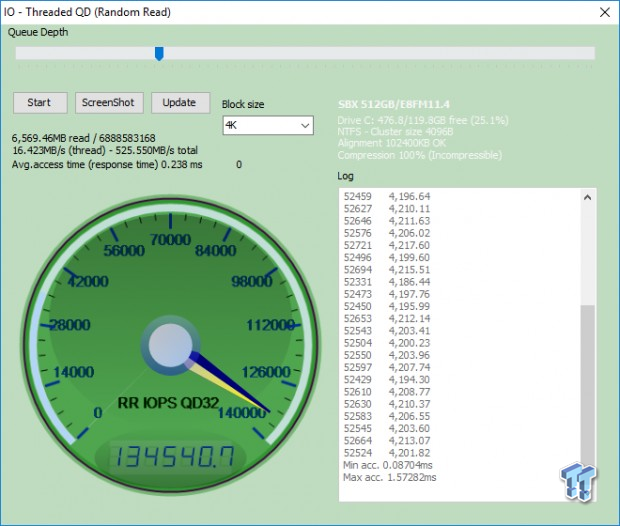
This is the random read performance we're getting at QD32, with an OS on the drive and 75% full.
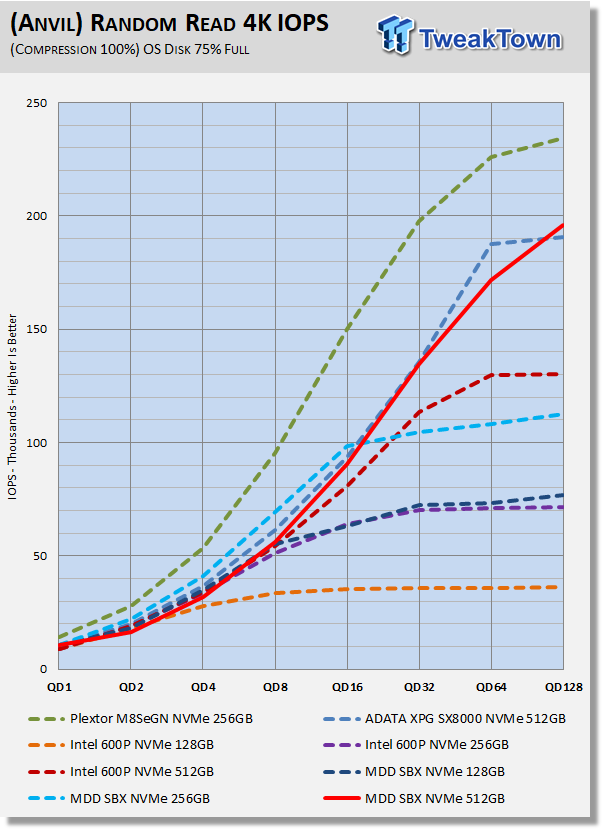
The SBX doesn't run into the same wall as the 600p does at higher queue depths. Looking at the 128GB SBX, we see it outperforming the 128GB 600p by about double at higher queue depths. In-fact the 128GB SBX is outperforming the 256GB 600p across the board.
(Anvil) Write IOPS through Queue Scale

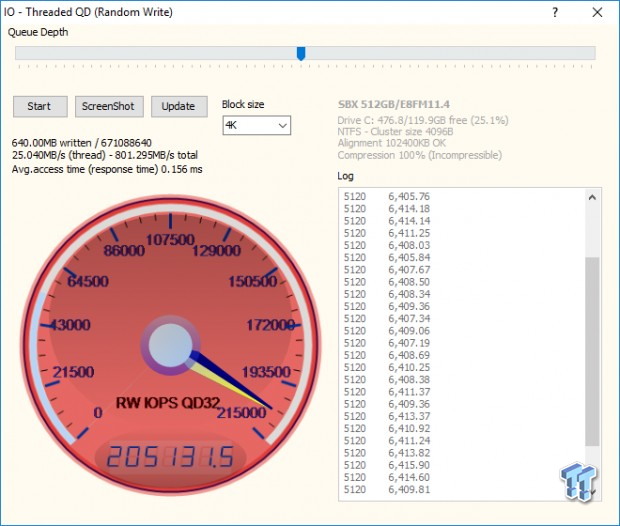
This is the random write performance we're getting at QD32, with an OS on the drive and 75% full.
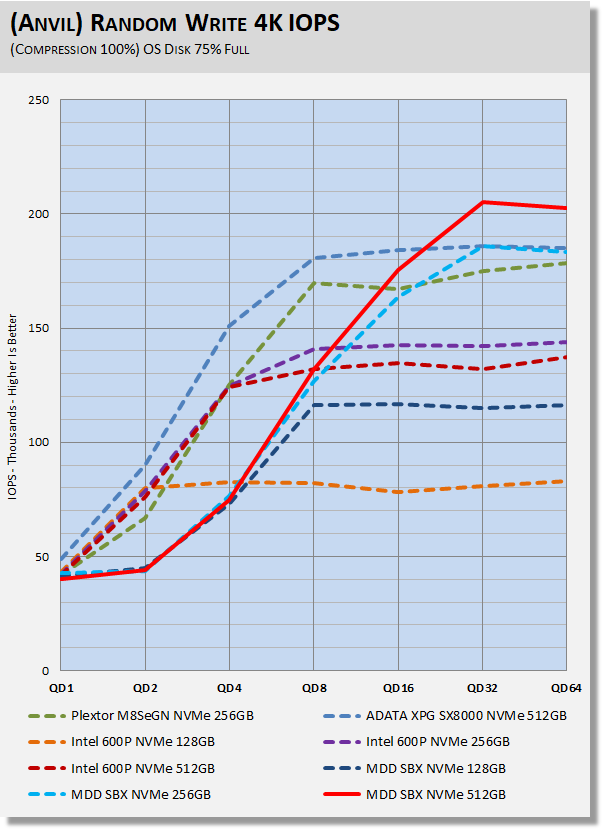
Here again, we see performance ramping up slowly. At QD1-2 performance is almost flat. At higher queue depths, the SBX comes on strong even beating out the SX8000 and M8SeGN.
Synthetic Benchmarks - CrystalDiskMark & AS SSD
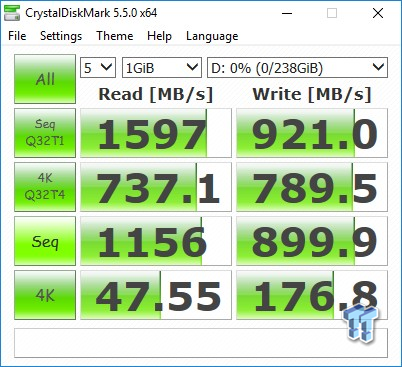
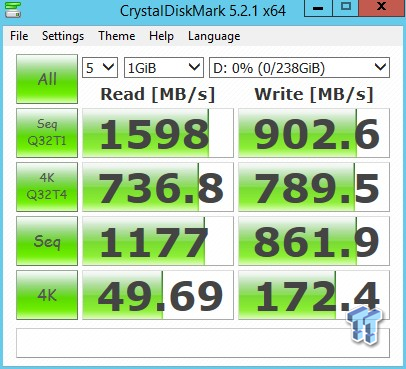
CrystalDiskMark
Version and / or Patch Used: 3.0 Technical Preview
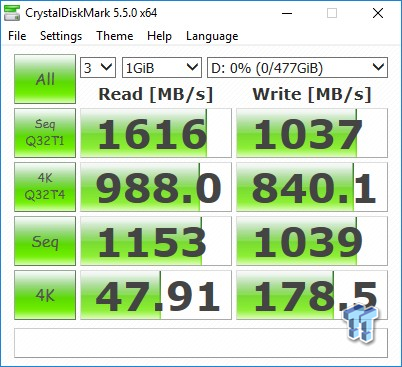
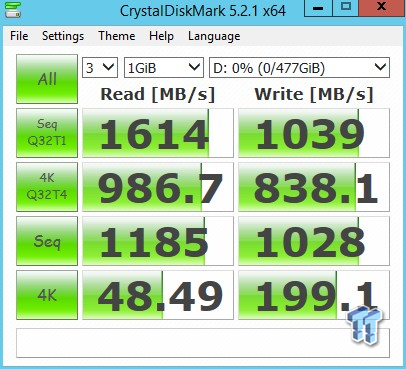
CrystalDiskMark is disk benchmark software that allows us to benchmark 4k and 4k queue depths with accuracy. Note: Crystal Disk Mark 3.0 Technical Preview was used for these tests since it offers the ability to measure native command queuing at QD4. When evaluating CDM results, we focus on 4K random performance at QD1 and QD4.
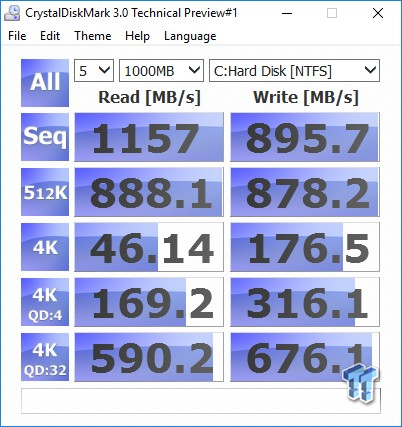
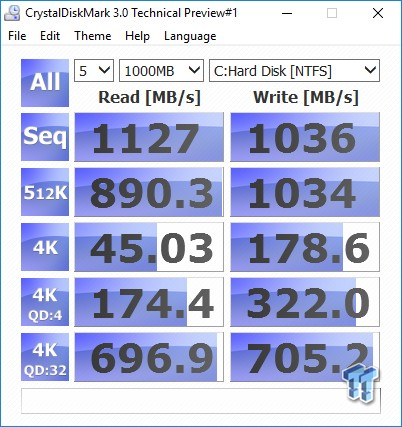
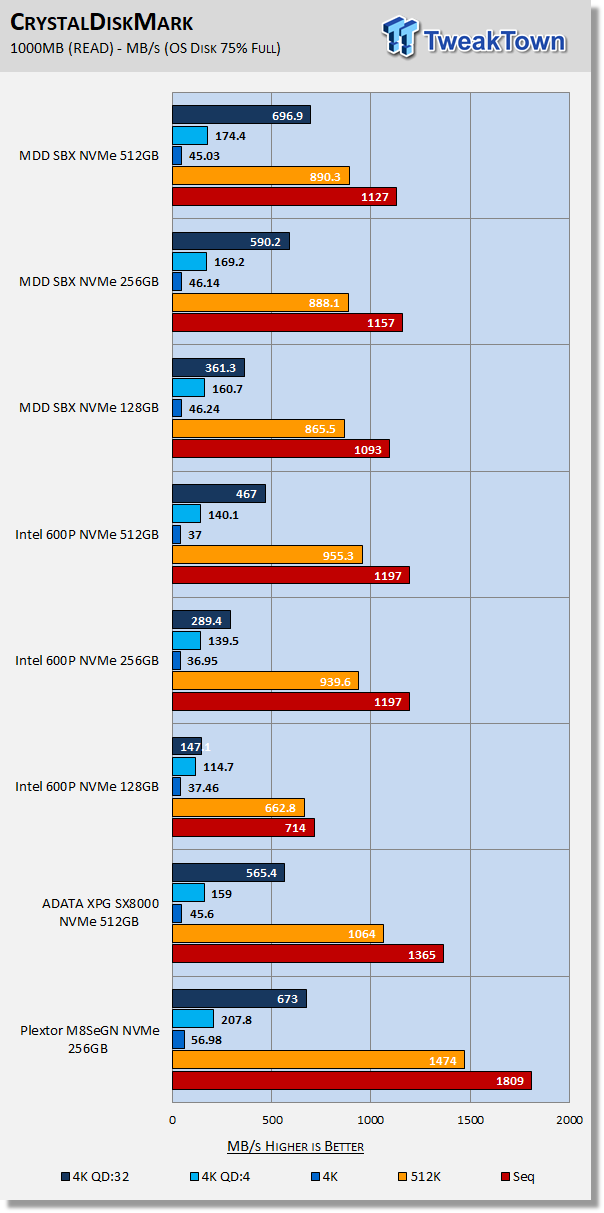
Focusing in on QD1 and QD4, we find the SBX outperforming all of our contenders with the exception of the M8Se.
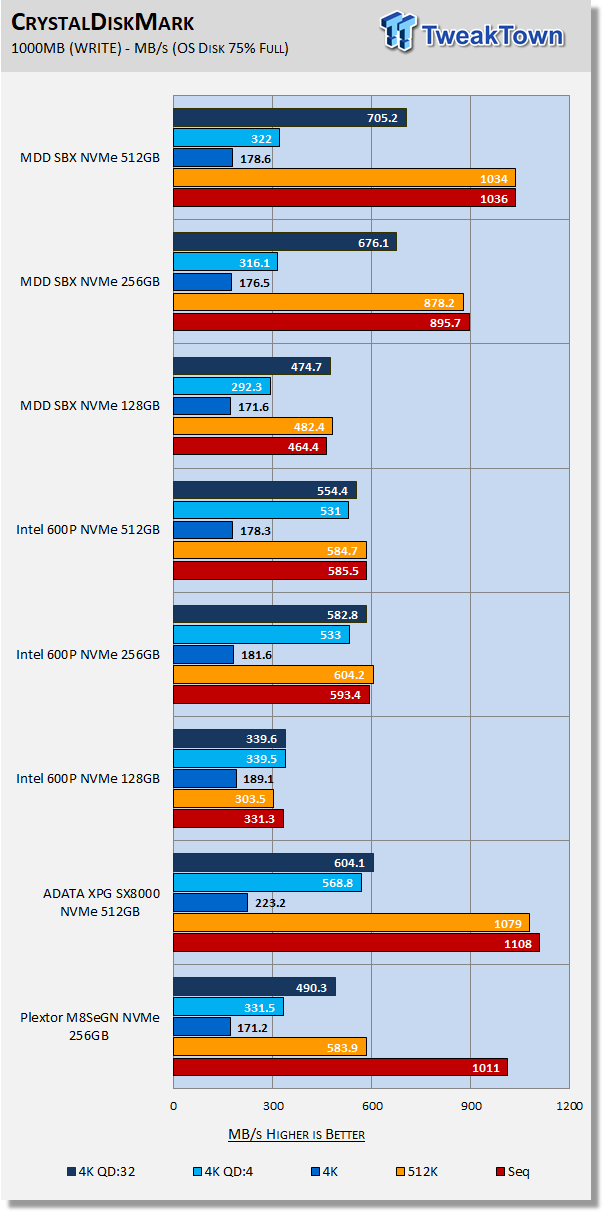
This time, Intel's 600p gets the better of the SBX at QD1 and QD4. However, if we shift our focus to sequential, the SBX leaves the 600p in the dust.
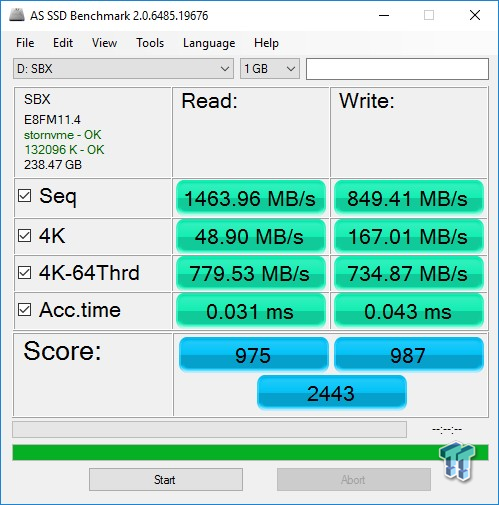
AS SSD
Version and / or Patch Used: 1.8.5611.39791
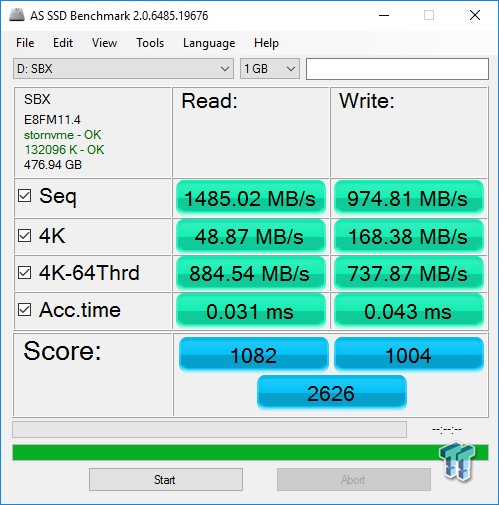
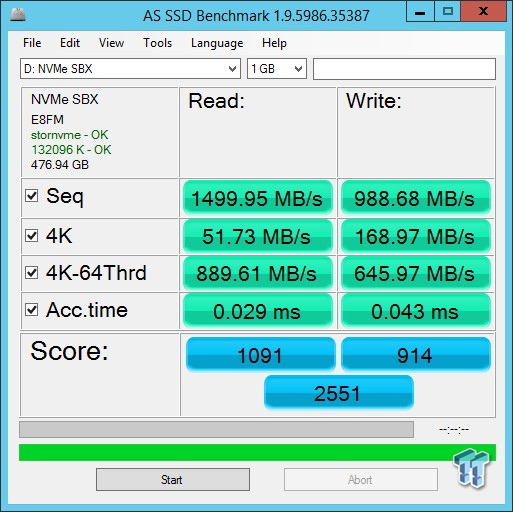
AS SSD determines the performance of SSDs. The tool contains four synthetic as well as three practice tests. The synthetic tests are to determine the sequential and random read and write performance of the SSD. We evaluate AS SSD performance in terms of overall score. We are looking for a minimum score of 2,000 when evaluating NVMe SSDs


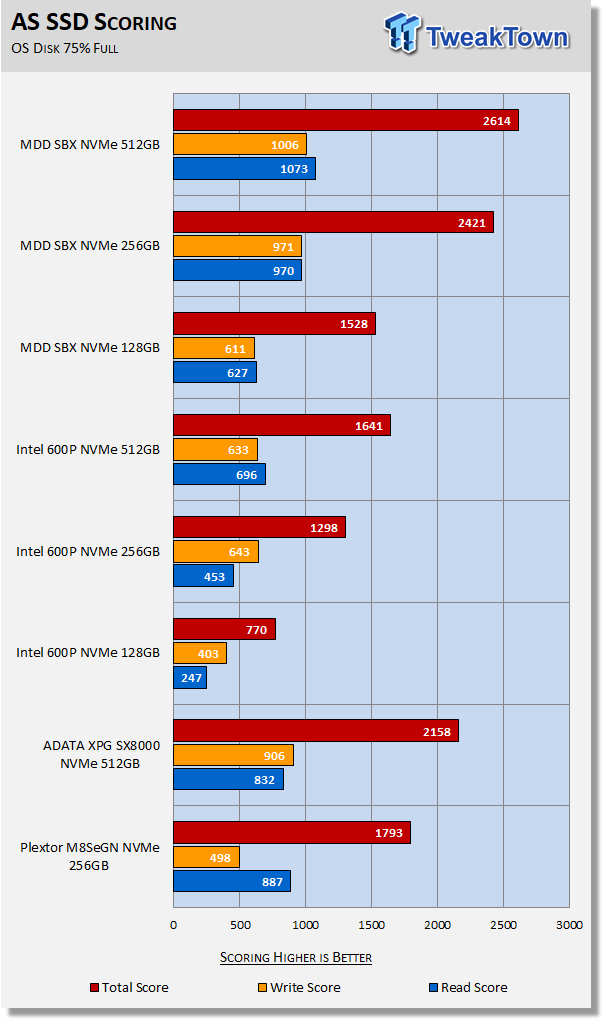
AS SSD is a demanding test, and somewhat surprisingly, the SBX handles it with ease. Both the 512GB and 256GB SBX give us our 2K minimum and then some. The 128GB SBX does almost as well as the 512GB 600p. Excellent performance here. Now let's move on to our real-world testing and see what the SBX has to offer.
Benchmarks (OS) - Vantage, PCMark 7, PCMark 8 & More
Moderate Workload Model
We categorize these tests as indicative of a moderate workload environment.
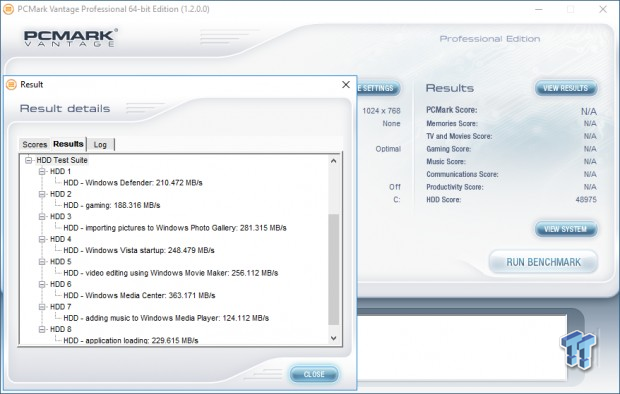
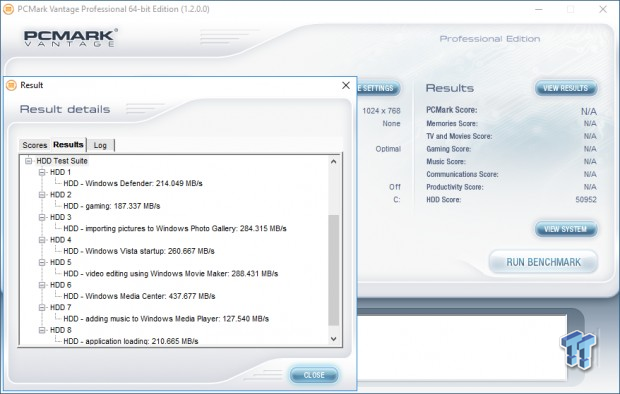
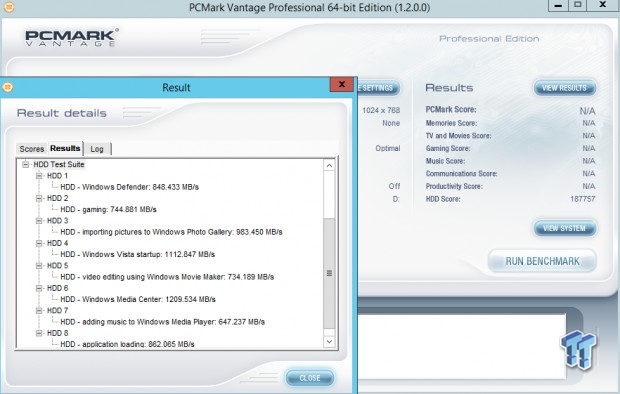
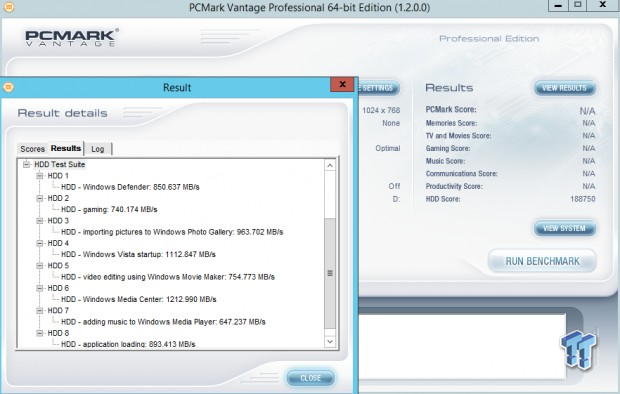
PCMark Vantage - Hard Disk Tests
Version and / or Patch Used: 1.2.0.0
The reason we like PCMark Vantage is because the recorded traces are played back without system stops. What we see is the raw performance of the drive. This allows us to see a marked difference between scoring that other trace-based benchmarks do not exhibit. An example of a marked difference in scoring on the same drive would be empty vs. filled vs. steady state.
We run Vantage three ways. The first run is with the OS drive 75% full to simulate a lightly used OS volume filled with data to an amount we feel is common for most users. The second run is with the OS volume written into a "Steady State" utilizing SNIA's consumer guidelines. Steady-state testing simulates a drive's performance similar to that of a drive that been subjected to consumer workloads for extensive amounts of time. The third run is a Vantage HDD test with the test drive attached as an empty, lightly used secondary device.
OS Volume 75% Full - Lightly Used


OS Volume 75% Full - Steady State
Secondary Volume Empty - FOB


There's a big difference between an empty drive, one that's 75% full/used, and one that's in a steady state.
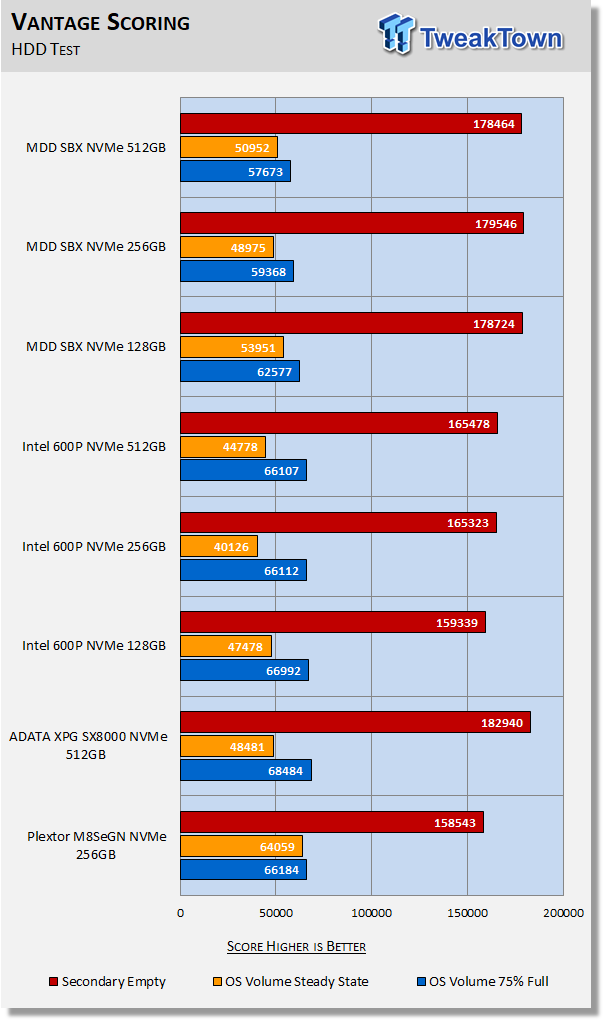
The important scores to pay attention to are "OS Volume Steady State" and "OS Volume 75% full." These two categories are most important because they are indicative of typical of consumer user states. When a drive is in a steady state, it means garbage collection is running at the same time it's reading/writing.
Focusing in on steady-state performance, we see that at every capacity point, the SBX outperforms Intel's 600p. It even manages to do better than ADATA's SX8000.
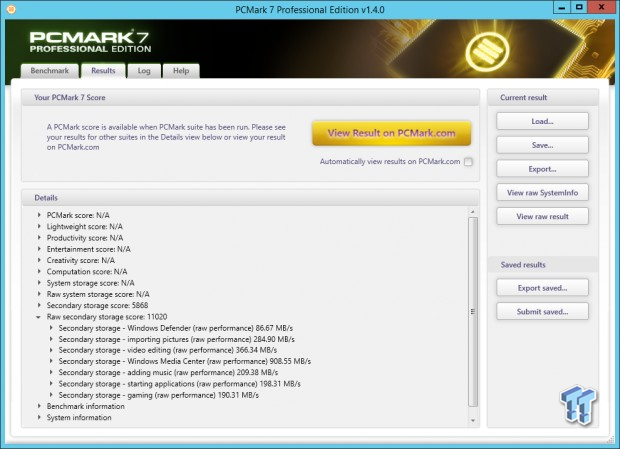
PCMark 7 - System Storage
Version and / or Patch Used: 1.4.0
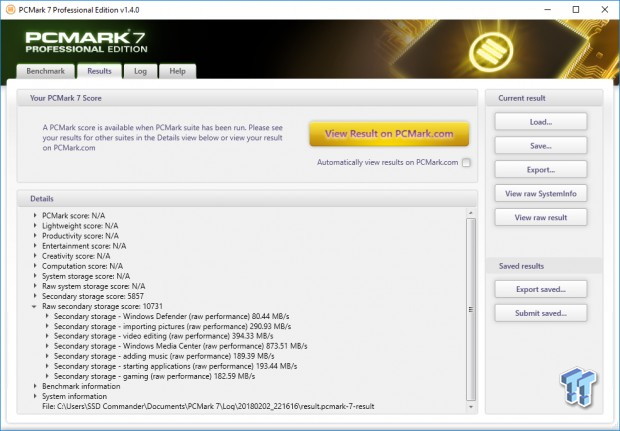
We will look to Raw System Storage scoring for evaluation because it's done without system stops and, therefore, allows us to see significant scoring differences between drives. When evaluating NVMe SSDs we are looking for a minimum score of 11,000
OS Volume 75% Full - Lightly Used
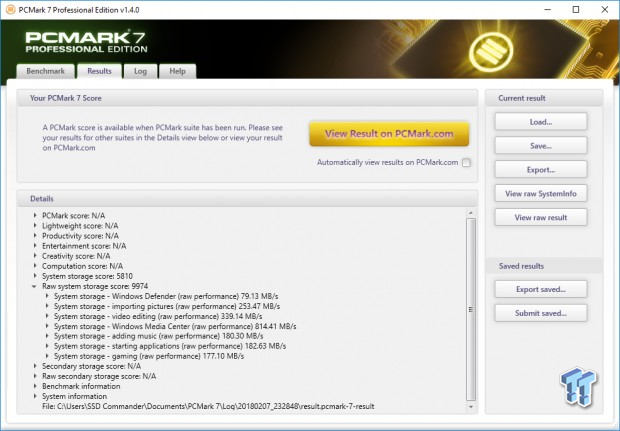
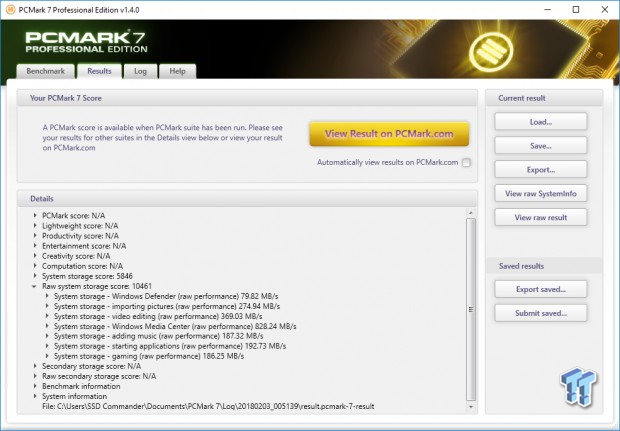
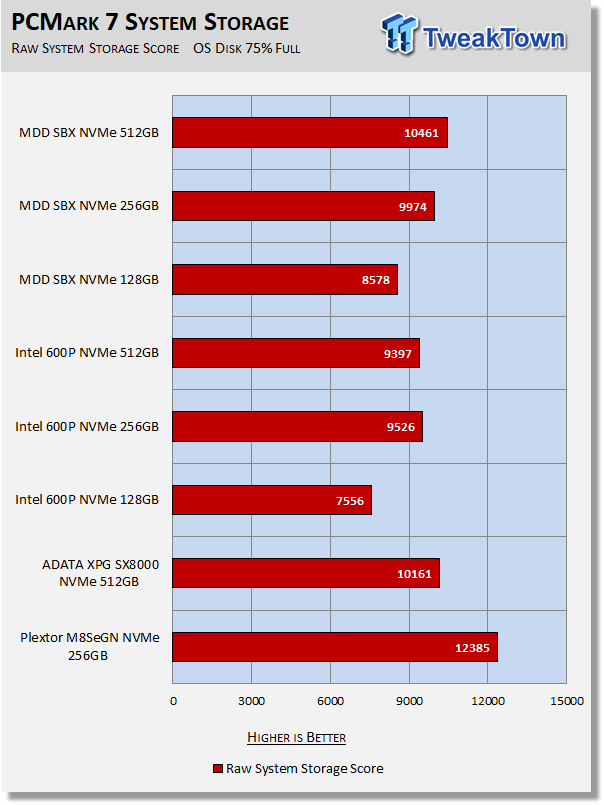
Exactly what we observed with Vantage. At every capacity point, the SBX outperforms Intel's 600p. and, this is with a 2-lane handicap. Again, the 512GB SBX outperforms the 512GB SX8000.
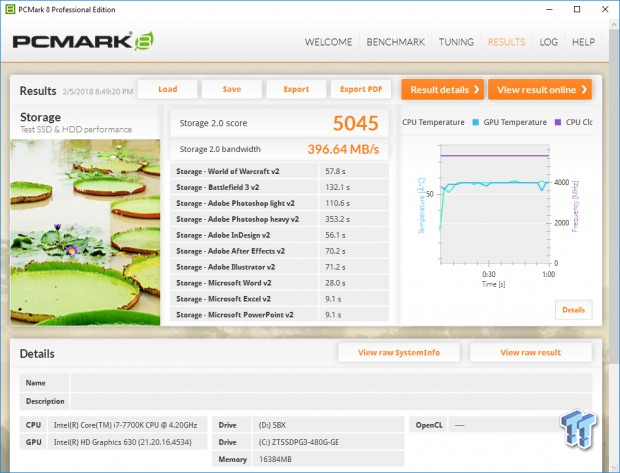
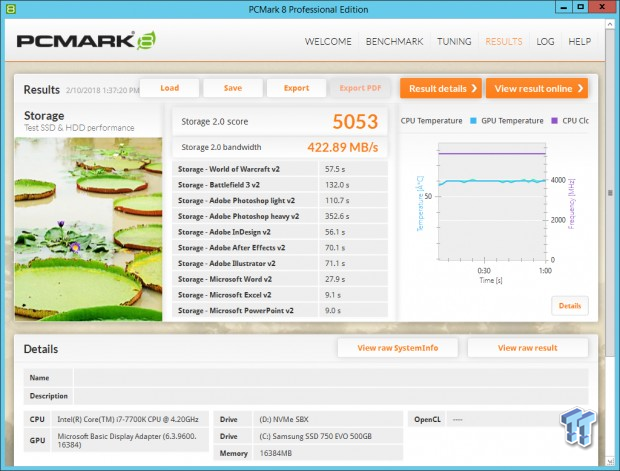
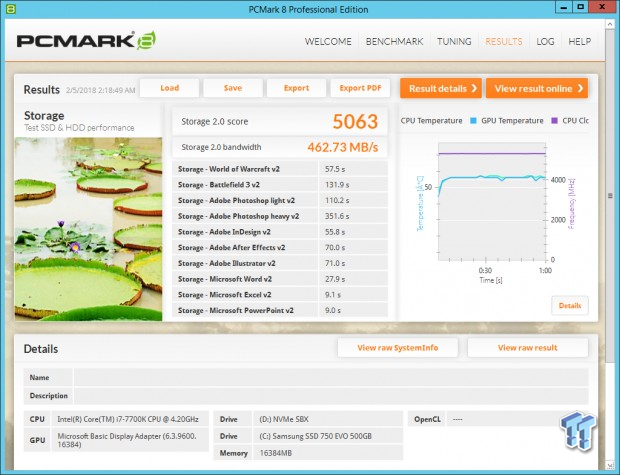
PCMark 8
Version and / or Patch Used: 2.4.304
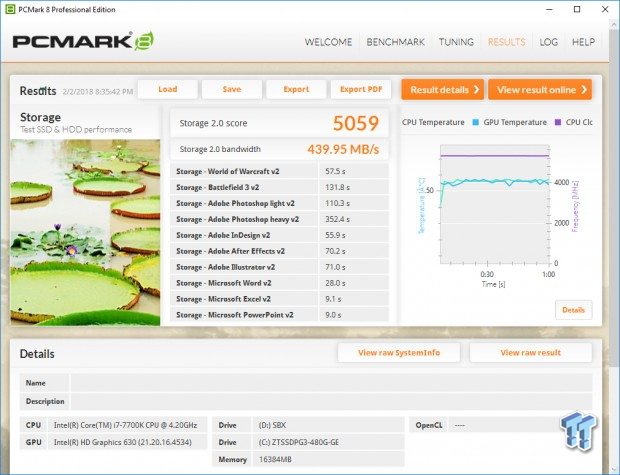
We use PCMark 8 Storage benchmark to test the performance of SSDs, HDDs, and hybrid drives with traces recorded from Adobe Creative Suite, Microsoft Office, and a selection of popular games. You can test the system drive or any other recognized storage device, including local external drives. Unlike synthetic storage tests, the PCMark 8 Storage benchmark highlights real-world performance differences between storage devices. We focus on the total score first and then storage bandwidth when evaluating PCMark 8 results.
OS Volume 75% Full - Lightly Used
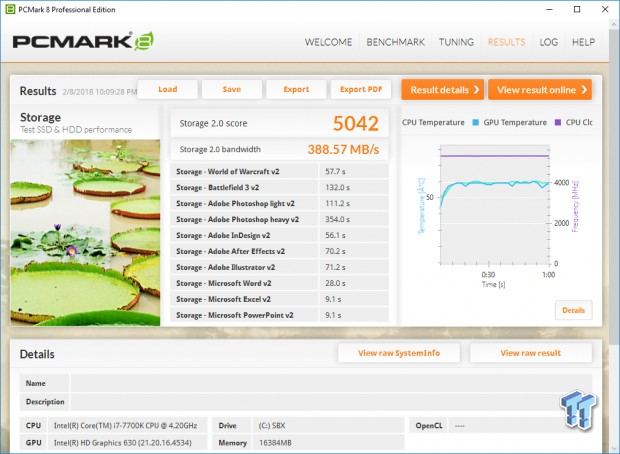

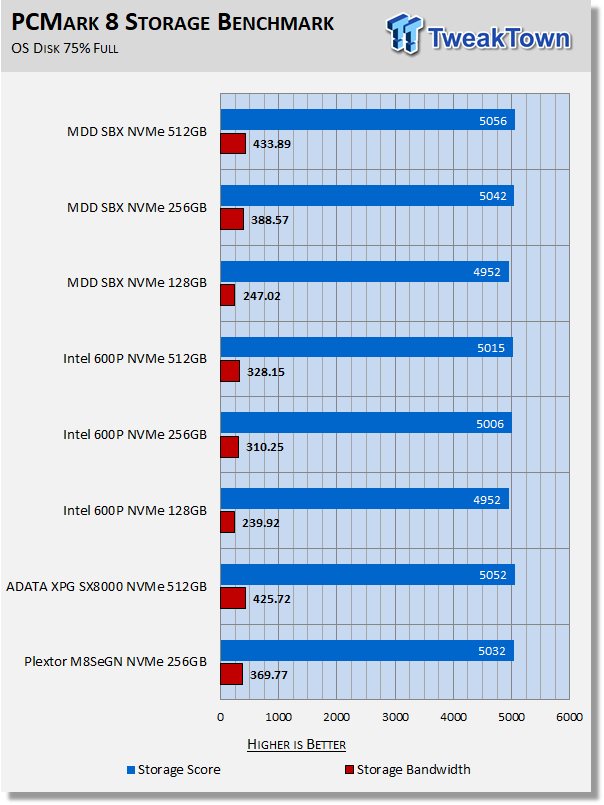
PCMark 8 is the most intensive moderate workload simulation we run. With respect to moderate consumer type workloads, this test is what we consider the best indicator of a drive's performance.
This is an outright win for the SBX. The 512GB model performs significantly better than the contenders in our test pool. Absolutely top-notch performance from a 2-lane SSD. This is where it matters, and this is where the SBX is delivering the goods.
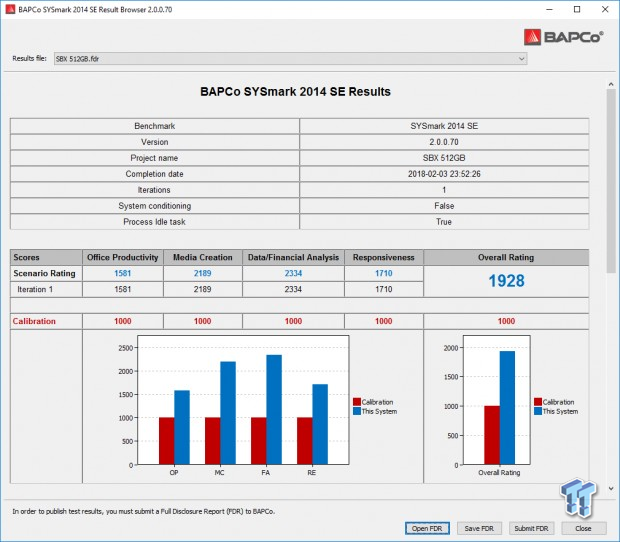
BAPCo SYSmark 2014 SE Application Performance
Version and / or Patch Used: 2.0.0.70
SYSmark 2014 SE is considered the gold standard for testing system performance because it is an application based benchmark. This test gives us the ultimate in real-world results because it utilizes actual applications running on the system, instead of playing back recorded traces. If you want to know what kind of impact a particular SSD will have on your system's overall performance; this test will show you.
Our systems are much more powerful than the calibration system (1000-point baseline) used by BAPCo, so we ran an OCZ TL100 120GB SATA III SSD to establish a comparison point relative to our test systems. We will be running this test going forward and we will add drives to our chart as we test them.

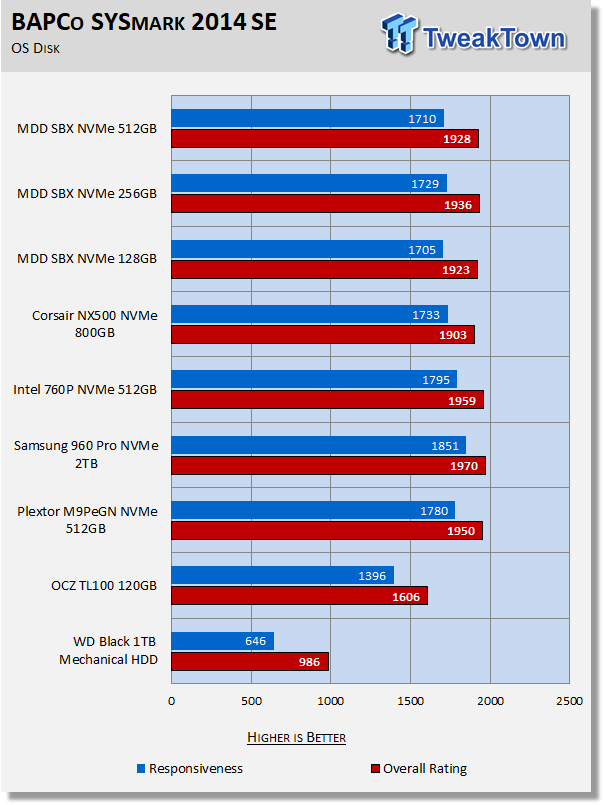
We did not test the 600p, M8Se or the SX8000 with this benchmark. However, we believe that if we were to do so, the SBX would for certain outperform the 600p and possibly the M8Se and SX8000 as well.
Benchmarks (Secondary) - IOPS, Response & Transfer Rate
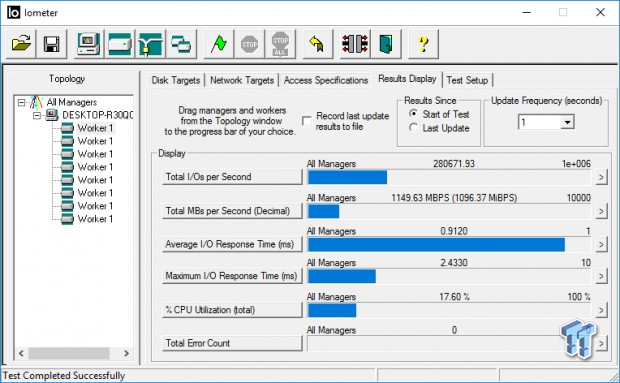
Iometer - Maximum IOPS
Version and / or Patch Used: Iometer 2014
We use Iometer to measure high queue depth performance. (No Partition)
Max IOPS Read
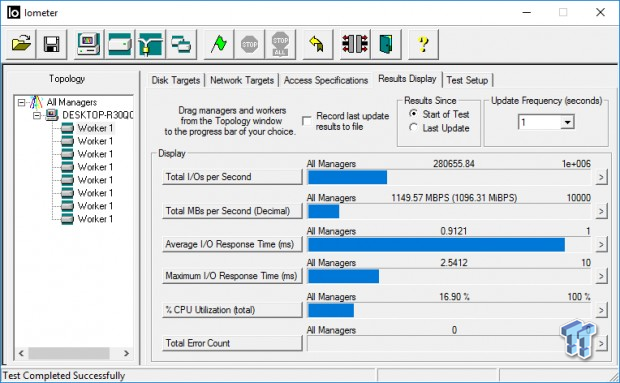
Max IOPS Write
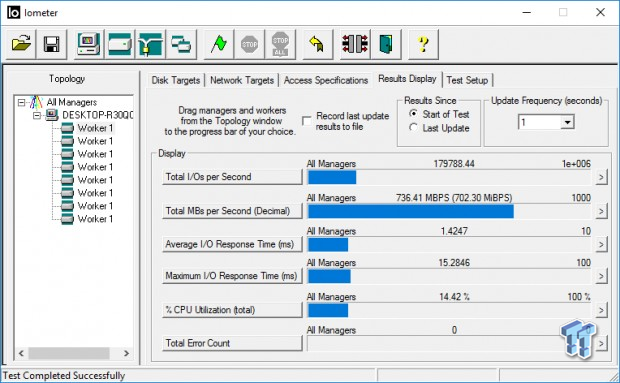
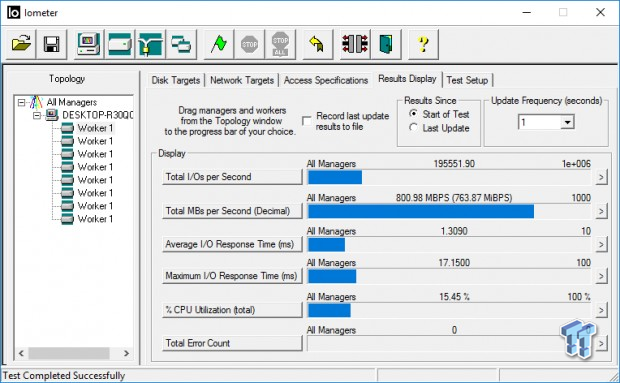
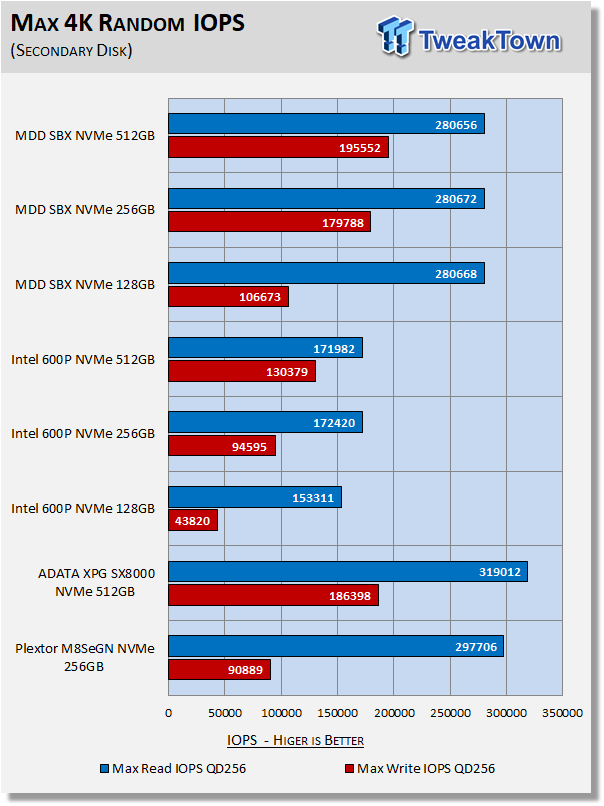
We test NVMe SSDs using eight threads at QD32, or QD256. We do this because we want to see what the drive can generate at its maximum attainable queue depth.
This test sums up pretty well what we've seen to this point. The SBX is faster than the 600p at every capacity point. Faster and cheaper is a winning combination in our book.
Iometer - Disk Response
Version and / or Patch Used: Iometer 2014
We use Iometer to measure disk response times. Disk response times are measured at an industry accepted standard of 4K QD1 for both write and read. Each test runs twice for 30 seconds consecutively, with a 5-second ramp-up before each test. We partition the drive/array as a secondary device for this testing.
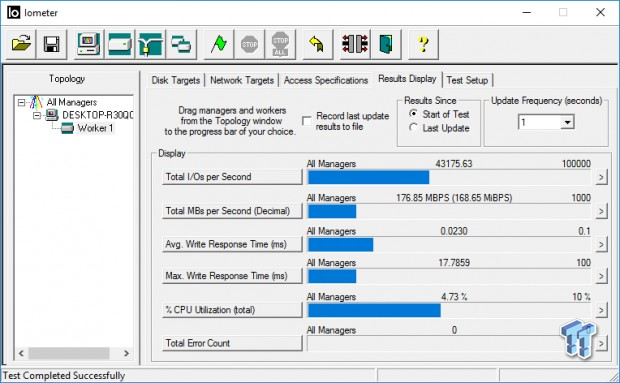
Avg. Write Response
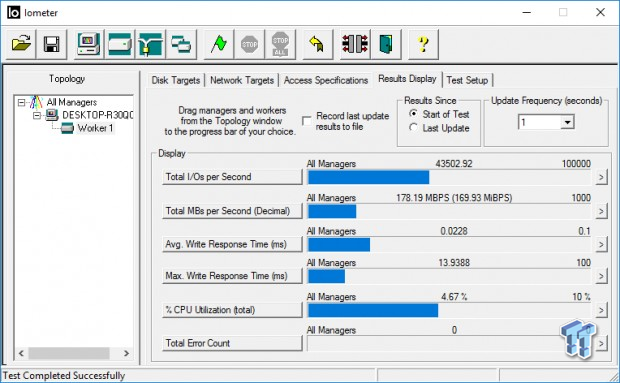
Avg. Read Response
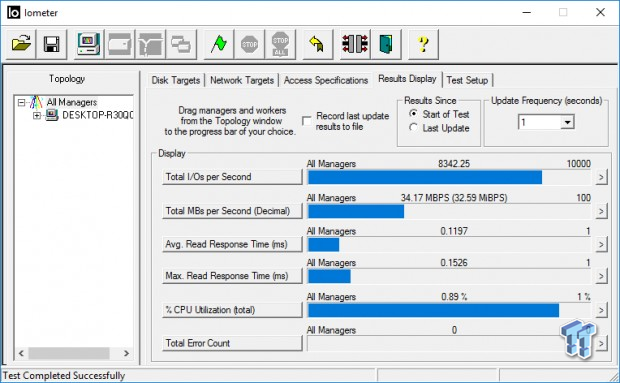
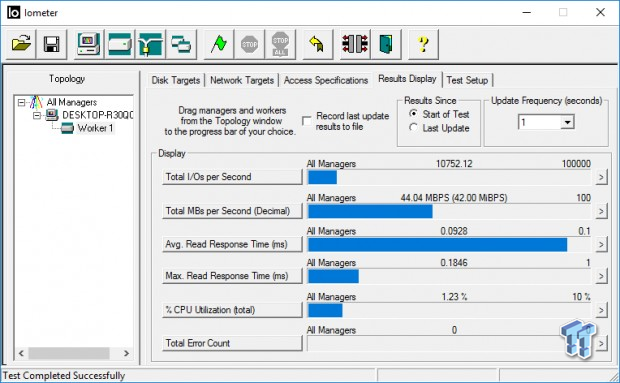
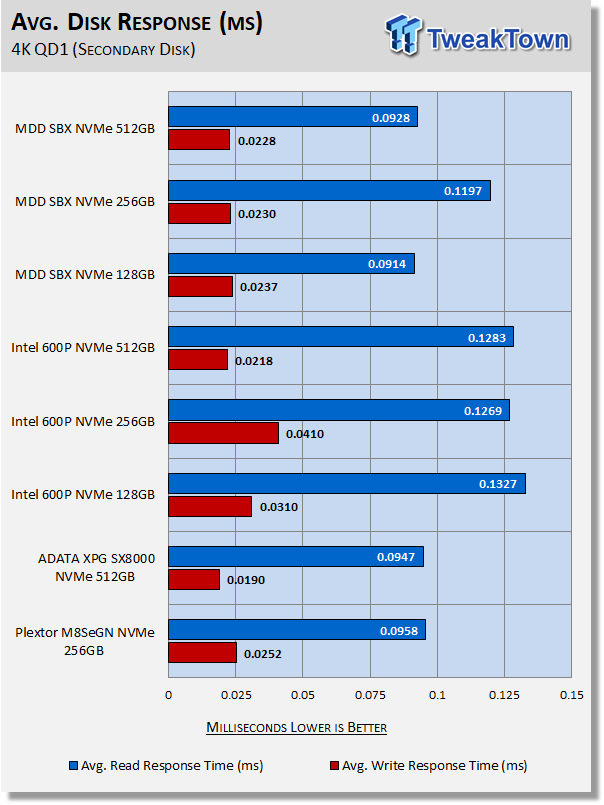
The 512GB 600p manages to eek out a win in write response, but that's it. Other than that, the SBX dominates the 600p. Take a look at read response, which is more important than write response. Both the 512GB and 128GB SBX are delivering the goods better than the M8Se and the SX8000. We consider this a win for the SBX.
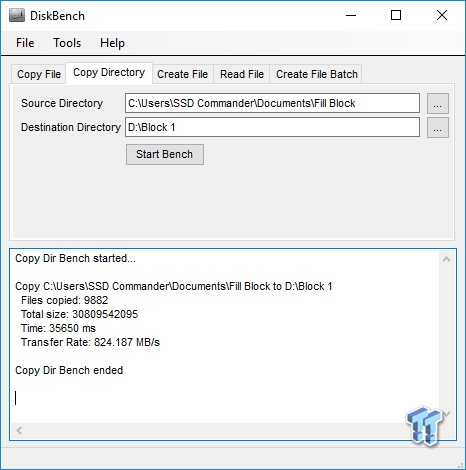
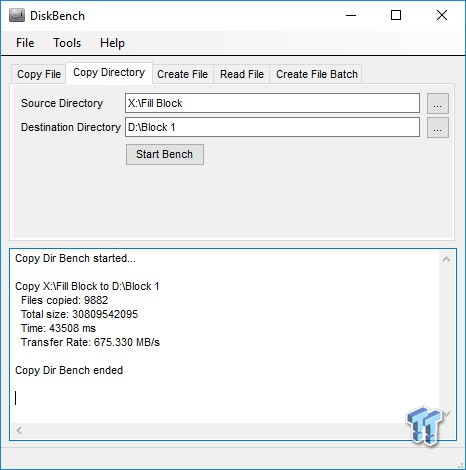
DiskBench - Transfer Rate
Version and / or Patch Used: 2.6.2.0
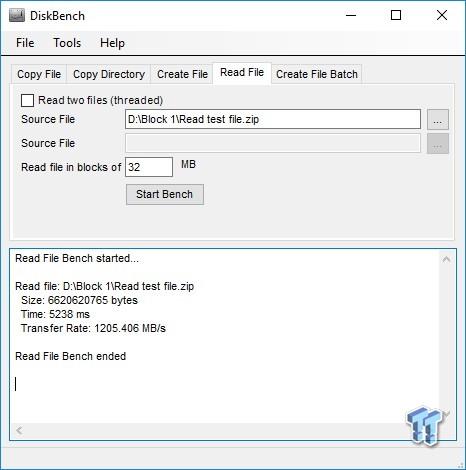
We use DiskBench to time a 28.6GB block (9,882 files in 1,247 folders) composed primarily of incompressible sequential and random data as it's transferred from our Toshiba RD400 1TB NVME SSD to our test drive. We then read from a 6GB zip file that's part of our 28.6GB data block to determine the test drive's read transfer rate. Our system is restarted prior to the read test to clear any cached data, ensuring an accurate test result.
Write Transfer Rate

Read Transfer Rate
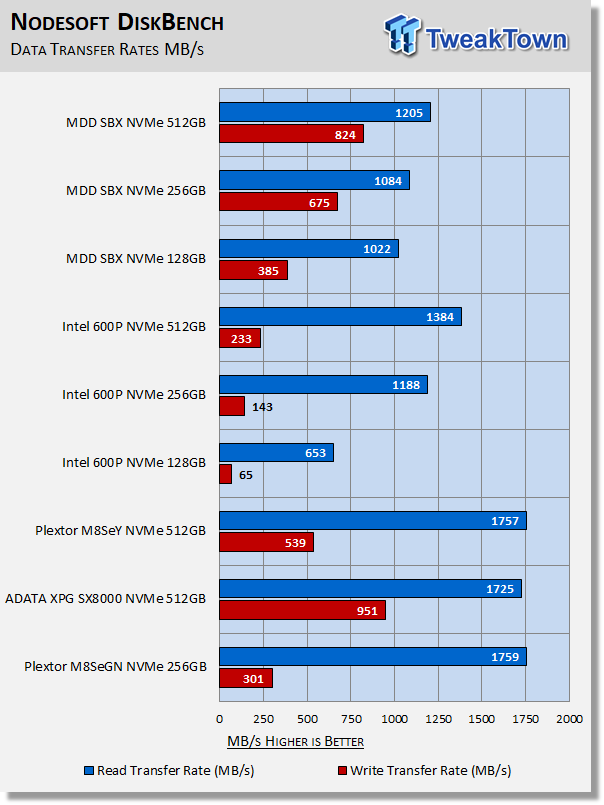
We recently upgraded our test system to Windows 10 build 14393. With that upgrade, write transfer rates almost doubled. The reason for this, as far as we know, is that CPU power switching modes have been relaxed on the latest version of Windows 10. We included the NVMe drives we've tested to date on this build of Windows 10. If you needed a good reason to upgrade to a newer version of Windows 10; this is a good reason.
This test reveals our biggest beef with Intel's 600p front and center. Look at the write transfer rate. It's slower than some mechanical HDDs. This means that if you are transferring a large block of data like a game, the 600p is slower than some mechanical HDDs. Now look at how much better the SBX does. It's even better than our 4-lane Plextor contenders.
Benchmarks – 70/30 Mixed Workload & Sustained Sequential Write
70/30 Mixed Workload Test (Sledgehammer)
Version and / or Patch Used: Iometer 2014
Heavy Workload Model
This test hammers a drive so hard we've dubbed it "Sledgehammer". Our 70/30 Mixed Workload test is designed to simulate a heavy-duty enthusiast/workstation steady-state environment. We feel that a mix of 70% read/30% write, full random 4K transfers best represents this type of user environment. Our test allows us to see the drive enter into and reach a steady state as the test progresses.
Phase one of the test preconditions the drive for 1 hour with 128K sequential writes at QD32. Phase two of the test runs a 70% read/30% write at QD32, full random 4K transfer workload on the drive for 1 hour. We log and chart (phase two) IOPS data at 5-second intervals for 1 hour (720 data points). 60 data points = 5 minutes.
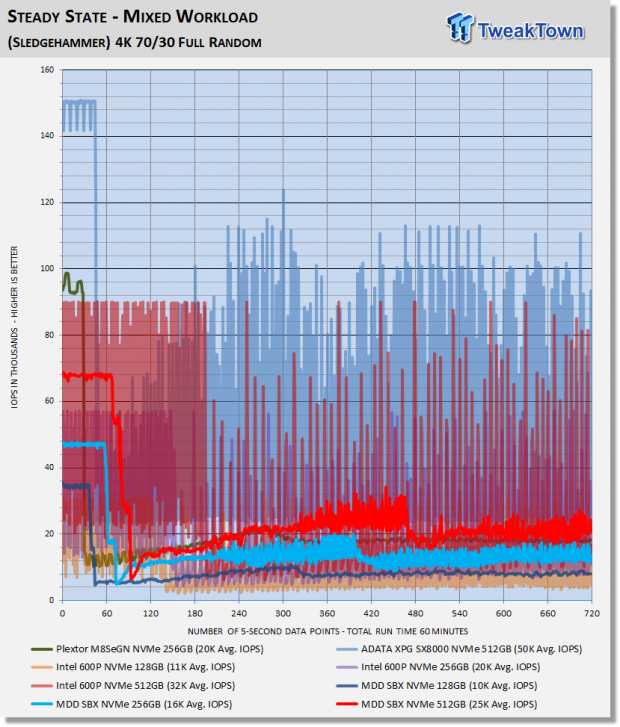
What we like about this test is that it reflects reality. Everything lines up, as it should. Consumer drives don't outperform Enterprise-Class SSDs that were designed for enterprise workloads. Consumer drives based on old technology are not outperforming modern Performance-Class SSDs, etc.
The SBX doesn't fare very will with this testing for two reasons. First, the SBX has no overprovisioning, which is why Intel's 600p does better. Looking at the capacities of our 600p lineup, it would appear that the 600p doesn't have any overprovisioning, but it does. Due to the odd die size (384Gbit) of the flash used on the 600p, it does in-fact have a significant amount of OP built-in. Second, having only 2-lanes to work with is a significant disadvantage when it comes to this brutal test.
Sustained Sequential Write
Version and / or Patch Used: Iometer 2014
Heavy Workload Model
We write to the drive for 1 hour with 128K sequential writes at QD32. We log and chart megabytes per second data at 5-second intervals for 1 hour (720 data points). 60 data points = 5 minutes.
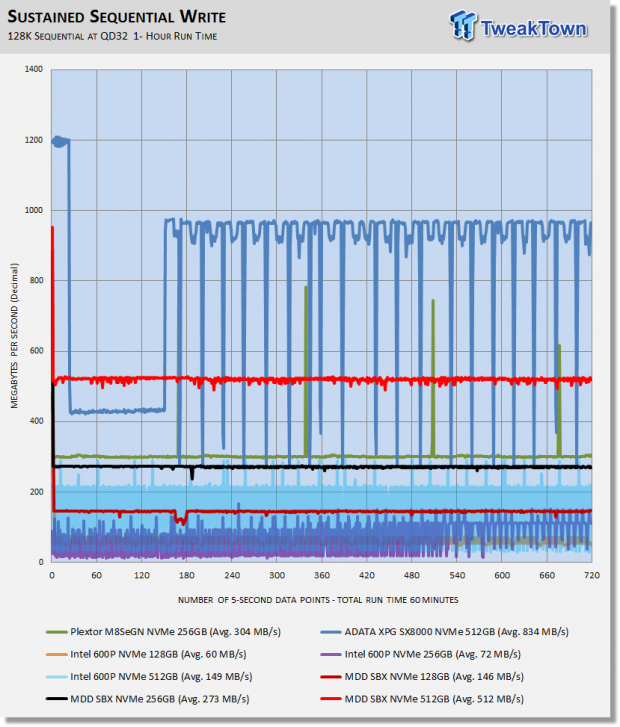
This test unmasks sequential write performance of TLC flash arrays. This test shows very clearly that the SBX is a vastly superior choice over Intel's 600p series. Looking at the 512GB SBX, we find it can sustain writes more than 3x better than the 512GB 600p.
Maxed-Out Performance (MOP)
This testing is just to see what the drive is capable of in an FOB (Fresh Out of Box) state under optimal conditions. We are utilizing empty volumes of Windows 10 and Windows Server 2012 R2 64-bit for this testing.
Windows 10 MOP
MDD SBX 256GB M.2 PCIe NVMe SSD


Windows Server 2012 R2 MOP
MDD SBX 256GB M.2 PCIe NVMe SSD


Windows 10 MOP
MDD SBX 512GB M.2 PCIe NVMe SSD
Windows Server 2012 R2 MOP
MDD SBX 512GB M.2 PCIe NVMe SSD
Final Thoughts
When Phison first envisioned their E8 controller they set out to accomplish several things. First, they wanted to create the most affordable NVMe drives on the market. Going with two PCIe lanes and four channels was the best path to accomplish this feat. But, it would still need to be faster than other value-oriented SSDs even with a 2-lane disadvantage.
Next, Phison wanted to produce an NVMe SSD that could challenge SATA in pricing. This is probably the biggest hurdle because it's not in Phison's hands to do so. This would have to come from vendors. Naturally, the one to do it is MyDigitalDiscount. They are the only source for NVMe SSDs that are priced like SATA.
The SBX isn't the only E8 powered SSD on the market. Kingston's A1000 is another. Both the SBX and the A1000 perform identically, but the A1000 is priced much higher than the SBX. And with the SBX you get full drive capacity. This means not only is the SBX much cheaper than the A1000, you get between 8 and 64GB more capacity from MDD's SBX.
Looking back at our results, it's clear that Phison did deliver a 600p killer as they hoped to accomplish - despite a 2-lane disadvantage. Cheaper and faster wins every time. Not only is the SBX faster than the 600p it is also faster than WD's first generation Black PCIe SSD. Additionally, if we use our PCMark 8 results as a marker, the SBX is faster than ADATA's SX8000 and Plextor's M8Se at the same capacity points.
So, what do we have in MyDigitalDiscount's SBX? An NVMe SSD that is priced like SATA but delivers up to 3x the performance of SATA. Win. The SBX is faster, cheaper and more enduring than Intel's popular 600p. Win. The SBX is faster than many 4-lane NVMe SSDs. Win. The SBX comes in the most popular form-factor - a single-sided M.2 x2280. Win.
All those wins do matter, but what matters most is user experience. The SBX delivers there as well. It is noticeably more responsive than anything SATA has to offer. That's important because SSDs like the 600p actually do not deliver a user experience that is better than the best SATA has to offer. We are happy with our user experience while running the MDD SBX as our system disk, which is why MyDigitalDiscount's SBX is TweakTown Recommended.
Pros:
- Cost
- Endurance
- Workload performance
Cons:
- Low QD Random
- No Software
 Phison E37T SSD Controller Exclusive Preview - The Fastest DRAMless SSD Platform Yet
 Seagate FireCuda X1070 4TB SSD Review - A New Mainstream Contender
 ASUSTOR Lockerstor 2 Gen2+ AS6702T v2 NAS Review - Fast Performance
 TERRAMASTER D1 SSD Pro Thunderbolt/USB Portable Enclosure Review - Incredible Potential
 Orico K20 Mini 2TB Magnetic Portable SSD Review - Ultra-Thin MagSafe Drive
 HDMI 2.2 products are coming in 2027 as chip makers begin sampling FRL2 silicon this year
 Solo dev tries to make his own GTA 6 with AI, as he got tired of waiting for Rockstar
 Repair channel buys ASUS RTX 4090 for $222 and finds plastic die with fake NVIDIA markings
 Epic's gen AI use deters partners, Vampire Survivors x Fortnite might get cancelled
 Sony seems to confirm singleplayer first-party PlayStation games will remain console exclusive
 NVIDIA GeForce GTX 1650 modded with 8GB of GDDR6 memory doubles performance in God of War and Unigine Superposition
 Apple will be working with Intel to design and build its chips in the USA, confirms President Donald Trump
 GTA 6 pre-order date revealed by Rockstar
 Anthropic's CEO confirms he can be fired as CEO through the company's own authority
 Speed Racer (2008) 4K Ultra HD Blu-ray Review: a stunning remaster of the cult classic
 MOAIPLAY ORA PRO G1 850W ATX 3.1 PSU Review: high efficiency and 10-year warranty for $119.99
 Navman MiVue Smart True 4K Surround Dashcam Review - Seeing In All Directions At Once
 IQUNIX Magi96 Pro Aluminum Low Profile Mechanical Keyboard Review - Premium Build, Satisfying Sound
 Asetek Forte S-Series Racing Simulator Bundle Review
 Razer Pro Type Ergo Wireless Split Ergonomic Keyboard Review - Built for Comfort and Support
 ASUS ROG Strix Morph 96 Wireless Gaming Keyboard Review - Great Performance, More Affordable
 SAPPHIRE Radeon RX 9070 GRE PULSE OC Review - A New 1440p Challenger Has Arrived
 NZXT H6 RGB+ Compact Dual-Chamber Chassis Review
 ASRock Radeon RX 9070 GRE Steel Legend Review - The RDNA 4 Mid-Range Reshuffle
 I read the Windows Backup app screen carefully, and it does not back up what most people think
 Low Sound Volume on Windows 11? How to fix audio issues and restore normal volume
 8 Critical Warning Signs You Should Never Ignore in Windows 11
 This Windows security feature protects Documents from ransomware, but it is off by default
 Windows 11 already has a voice typing tool, and it is the one most people are not using
 Quick Assist is the only remote-support tool I open when a relative calls about their PC
 The PowerToys utilities I keep enabled on every Windows 11 PC, and the ones I turned off within a week
 TweakTown's Best of Computex 2026 Awards - The Best Hardware, Gaming Gear, and AI