
The Bottom Line
Introduction, Drive Specifications, Pricing & Availability
We got our first glimpse of Silicon Motion's next-gen SM2262 controller at last year's Flash Memory Summit. Since then we've been eagerly awaiting our chance to test an SSD based on this powerful controller. Well, that day is finally upon us. Intel's 760p represents our first hands-on with the SM2262 and this drive delivers the goods in a big way.
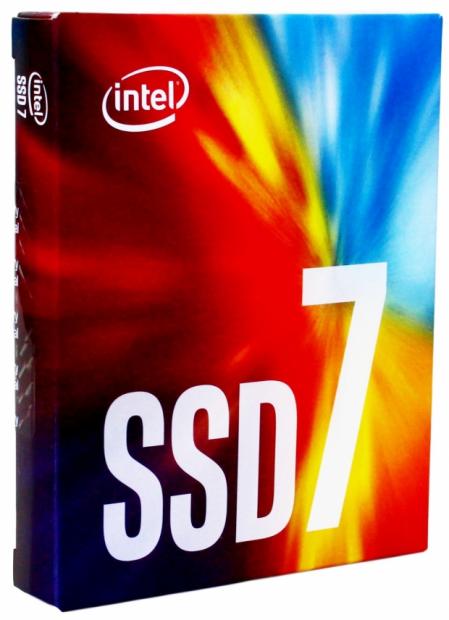
Silicon Motion's SM2262 controller is SMI's second go around with Intel and NVMe. Intel's 600p was their first M.2 NVMe SSD and it is powered by an SMI SM2260. The Intel 600p paired a Silicon Motion SM2260 controller with Intel 32-layer TLC flash and served up decent NVMe sequential read speeds for a super-low cost, but failed to deliver compelling overall performance.
SMI took the lessons learned from the SM2260 and developed the SM2262 with a focus on delivering Tier-1 NVMe performance at near SATA cost. As we like to do whenever a new controller makes its way into the lab, we have provided a factory spec sheet for the Silicon Motion SM2262:
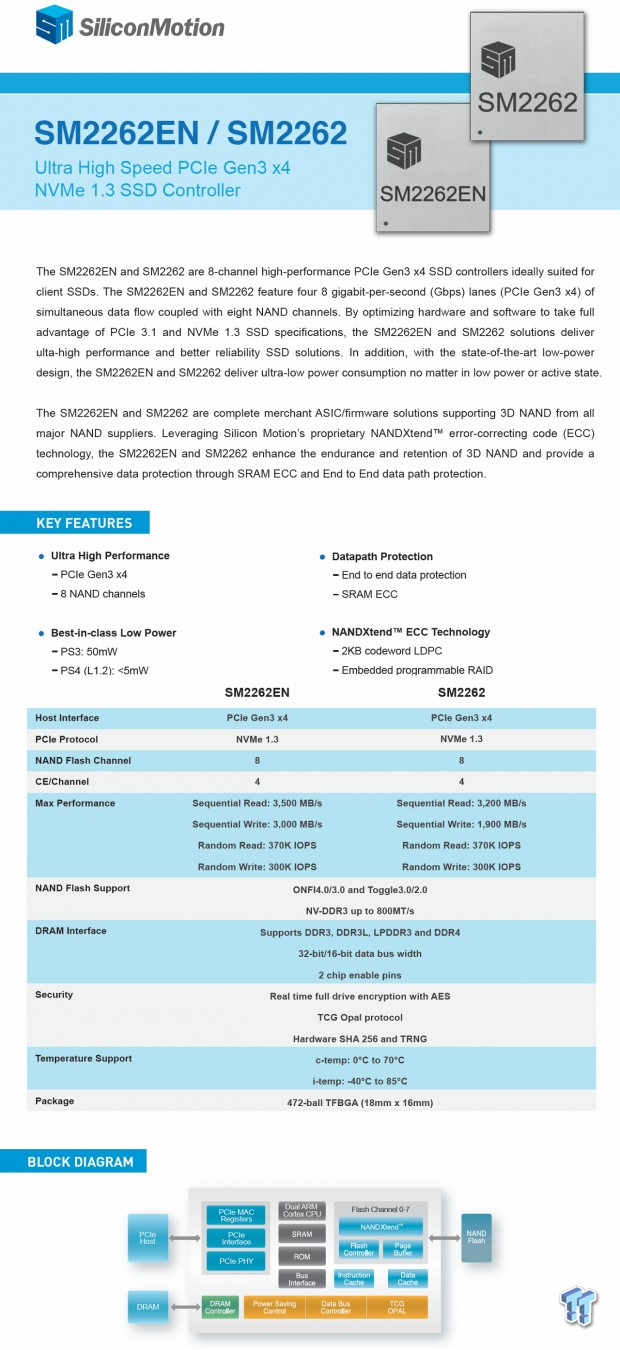
The SM2262 controller comes in two versions. The SM2262 is the tame version and the SM2262EN is the all-out performance version. The drive we have in the lab today utilizes the SM2262 version but make no mistake the SM2262 is still a beast. Both controllers deliver similar random performance, but the EN version delivers substantially better sequential performance. Notable features include LDPC error correction (which greatly extends the endurance of NAND-flash), end-to-end data path protection, encryption, 8 NAND channels, NVMe 1.3 and best-in-class low power.
Intel's 760p Series pairs SMI's SM2262 controller with Intel's 64-layer TLC (Triple Level Cell) 256Gbit 3D flash.
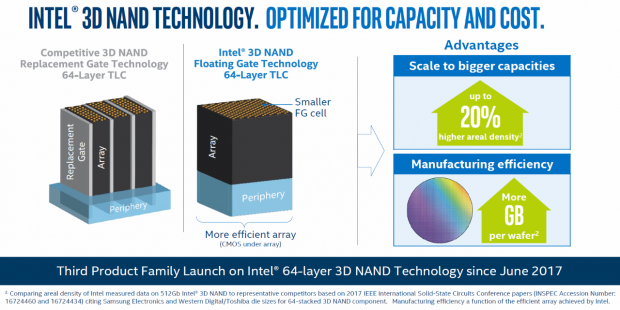
Intel's 64-layer flash is based on floating gate technology with CMOS under array. Intel believes this is more efficient than competitive 3D NAND based on replacement gate technology. Advantages include higher areal density and better manufacturing efficiency that nets more GB per wafer, resulting in lower production cost per bit.
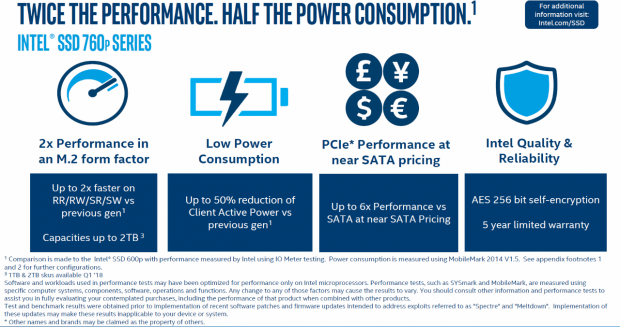
The SM2262 paired with Intel 64-layer TLC is a giant leap forward in both performance and power efficiency over the 600p series. The 760p delivers twice the performance of the 600p and does so with half the power consumption. Pairing the SM2262 with Intel 64-layer flash increases reliability and additionally allows for near SATA pricing. The 512GB model we are testing today has a super-low opening MSRP of $199 which is indeed in the SATA price range.
SMI controllers are supplied with or without firmware, so buyers can customize performance and features if they have a firmware engineering team. We didn't ask, but we assume the SM2262 controller that powers the 760p is running on proprietary Intel optimized firmware.
On paper the 760p looks dazzling, now let's get into the review and take a close look at the actual numbers.
Specifications
Intel's 760p Series is available in five capacities: 128GB, 256GB, 512GB, 1TB and 2TB
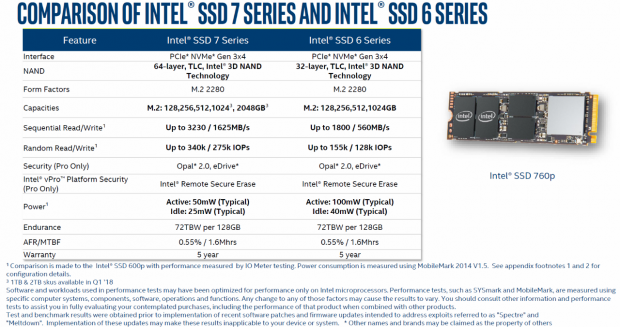
- Sequential Read up to 3230 MB/s
- Sequential Write up to 1625 MB/s
- Random Read up to 340K IOPS
- Random Write up to 257K IOPS
- MTBF: 1.5 Million Hours
- Warranty: 5-Year Limited Warranty
- SLC caching
- LDPC
- SMART
- TRIM
- End-to-End Datapath Protection
- Garbage Collection
Overview
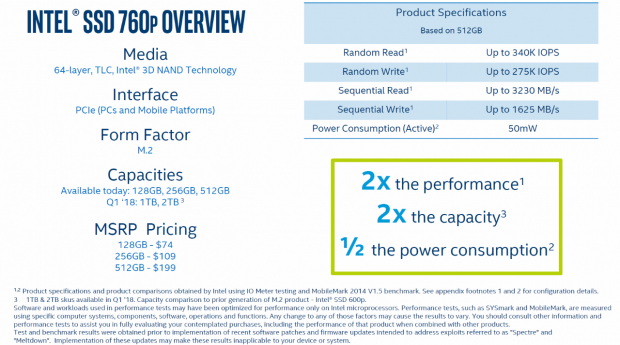
Availability: 128GB-512GB available now, 1TB & 2TB Q1 2018.
MSRP Pricing: 128GB - $74, 256GB - $109, 512GB - $199.
Drive Details
Intel 760P 512GB M.2 PCIe NVMe SSD
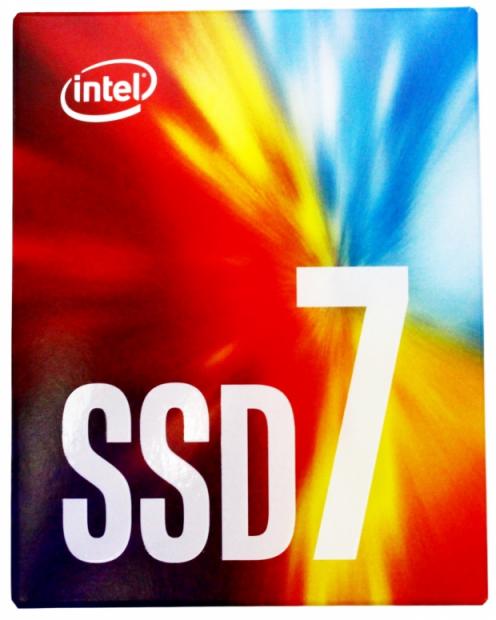
The front face of the colorful packaging lets you know that an Intel SSD7 is contained within.
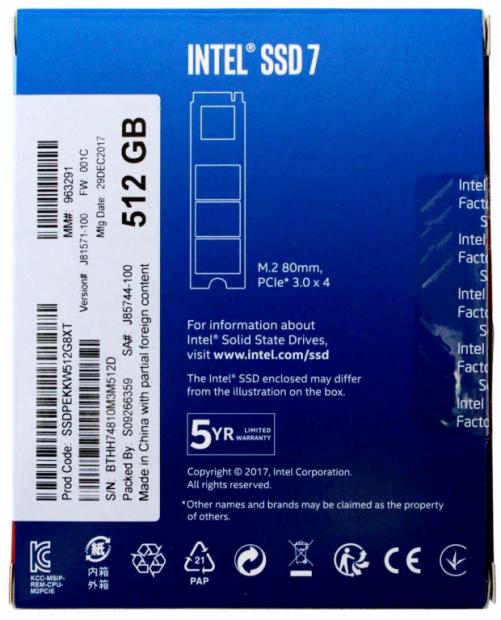
The back of the packaging advertises the capacity of the enclosed SSD, its form-factor and 5-year limited warranty.
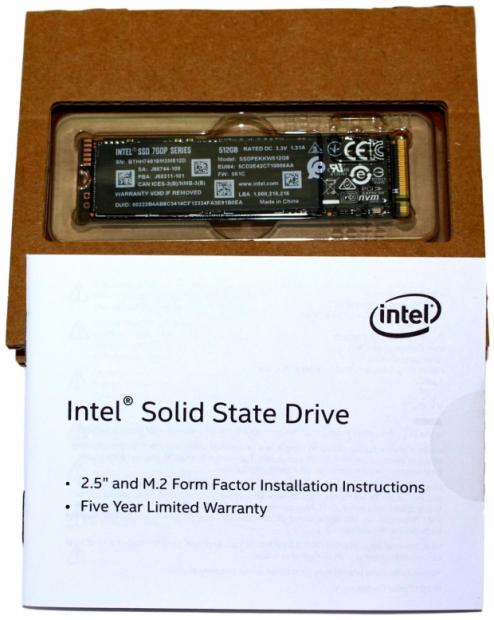
Opening the box reveals the drive enclosed in a clear plastic clamshell container and a printed pamphlet.

Normally the looks of an M.2 SSD are nothing to get excited about, but the 760p with its sleek black PCB and copper accents is very appealing. Even the shape is futuristic looking.

The 128GB - 1TB models are single sided designs, the 2TB model will be double-sided.

Removing the label exposes the drives controller, dual Micron 256MB DRAM cache packages and two 256GB Intel flash packages.
Test System Setup, Drive Properties
Jon's Consumer PCIe SSD Z270 Intel Review Test System Specifications
- Motherboard: ASRock Z270 Taichi - Buy from Amazon / Read our review
- CPU: Intel Core i7 7700K @ 5.0GHz - Buy from Amazon / Read our review
- Cooler: Swiftech H2O-320 Edge - Buy from Amazon / Read our review
- Memory: Corsair Vengeance LPX DDR4 16GB 3200MHz - Buy from Amazon
- Video Card: Onboard Video
- Case: IN WIN X-Frame - Buy from Amazon / Read our review
- Power Supply: Seasonic Platinum 1000 Watt Modular - Buy from Amazon / Read our review
- OS: Microsoft Windows 10 Professional 64-bit - Buy from Amazon
We would like to thank ASRock, Crucial, Intel, Corsair, RamCity, IN WIN, and Seasonic for making our test system possible.
Drive Properties
Intel 760P 512GB M.2 PCIe NVMe SSD OS Disk 75% Full
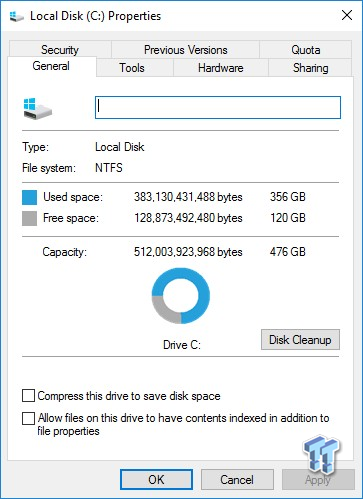
The majority of our testing is performed with our test drive as our boot volume. Our boot volume is 75% full for all OS Disk "C" drive testing to replicate a typical consumer OS volume implementation. We feel that most of you will be utilizing your SSDs for your boot volume and that presenting you with results from an OS volume is more relevant than presenting you with empty secondary volume results.
System settings: Cstates and Speed Stepping are both disabled in our system BIOS. Windows High-Performance power plan is enabled. Windows write caching is enabled, and Windows buffer flushing is disabled. We are utilizing Windows 10 Pro 64-bit OS (Build 14393) for all our testing except for our MOP (Maxed-Out Performance) benchmarks where we switch to Windows Server 2008 R2 64-bit. Empty Windows 10 benchmark screenshots will also be shown on our MOP page.
Please note: When comparing our results to those of other review sites, look at page 10 Maxed Out Performance-Windows 10 which is done with the disk empty.
Synthetic Benchmarks - ATTO & Anvil Storage Utilities
ATTO
Version and / or Patch Used: 3.05
ATTO is a timeless benchmark used to provide manufacturers with data used for marketing storage products. When evaluating ATTO performance we focus on the drive's performance curve.

We are not able match factory sequential read/write performance when the drive is 75% full. Keep in mind that factory sequential speeds are measured at QD32, we are running this test at QD4.
Sequential Write
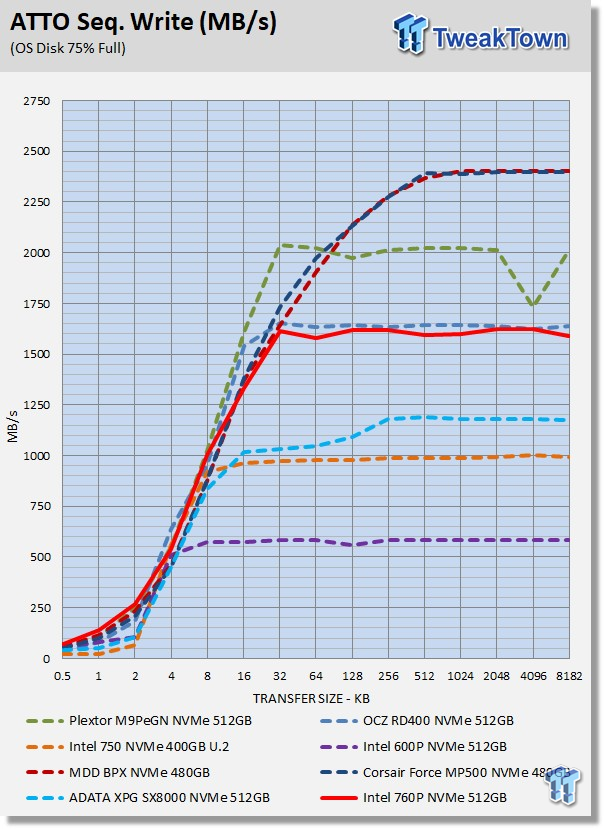
The performance curve looks good when writing sequential data in burst mode; especially small-file performance where the 760p is beating all the contenders in our test pool.
Sequential Read
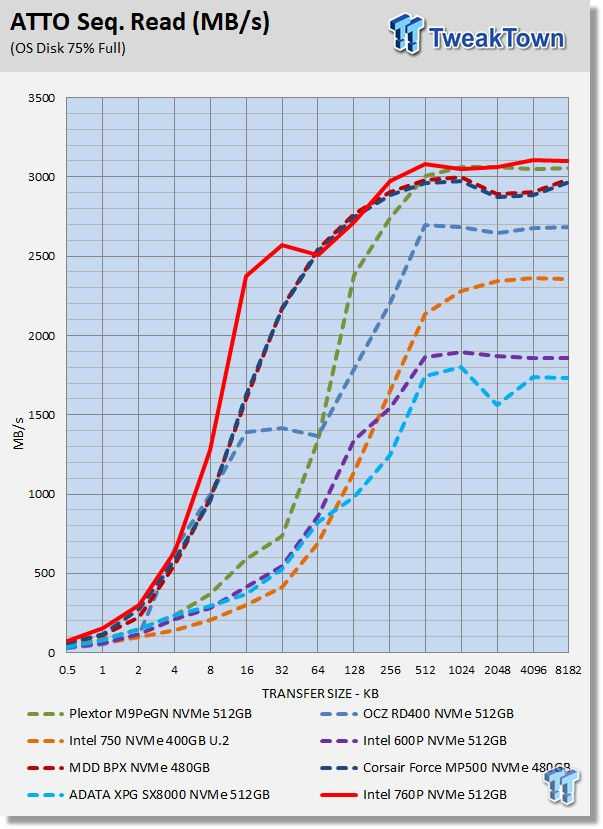
Sequential read performance ramps up fast, which is what we want to see. Even though the 760p flattens off a bit at 8KB-64KB transfers, it still dominates the contenders in our test pool.
Anvil Storage Utilities
Version and / or Patch Used: 1.1.0
Anvil's Storage Utilities is a storage benchmark designed to measure the storage performance of SSDs. The Standard Storage Benchmark performs a series of tests; you can run a full test or just the read or write test, or you can run a single test, i.e. 4K QD16. When evaluating performance with Anvils, we focus on total score. When evaluating NVMe SSDs we are typically looking for a minimum total score of over 10K. We place a greater importance on read performance than write performance.
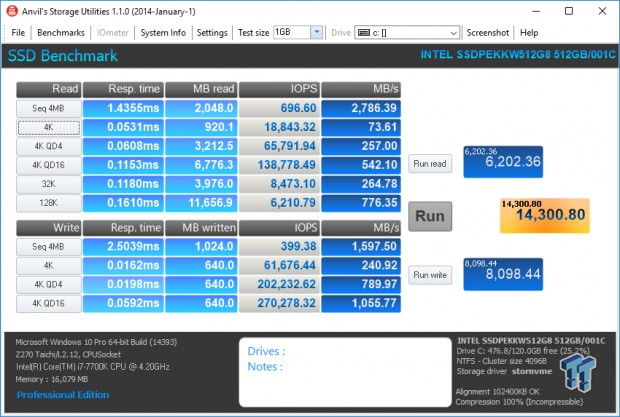
Take note of the 4K read performance. The 760p delivers the best we've seen from any flash-based SSD we have tested to date.
Scoring
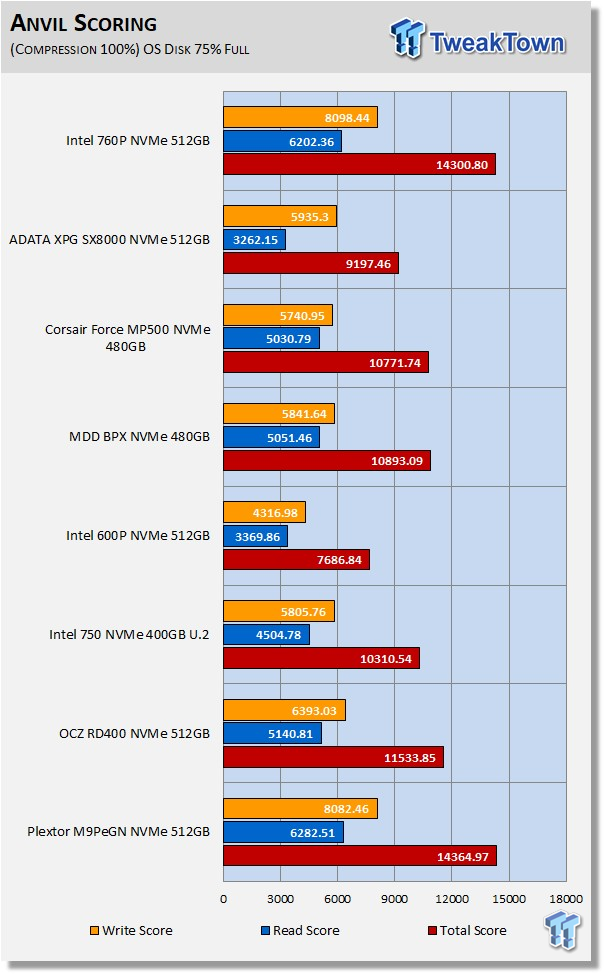
In terms of total score, the 760p trades blows with Plextor's M9Pe for the top spot. The Plextor drive just edges out the 760p by delivering a slightly better write score. Intel says the 760p delivers double the performance of their 600p and we are seeing close to that on our chart. Not only does the 760p crush the 600p, it also crushes its 7 Series sibling - the Intel 750.
(Anvil) Read IOPS through Queue Depth Scale
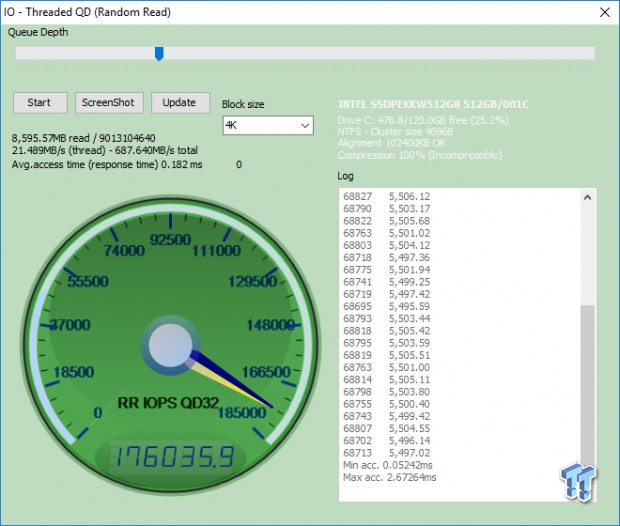
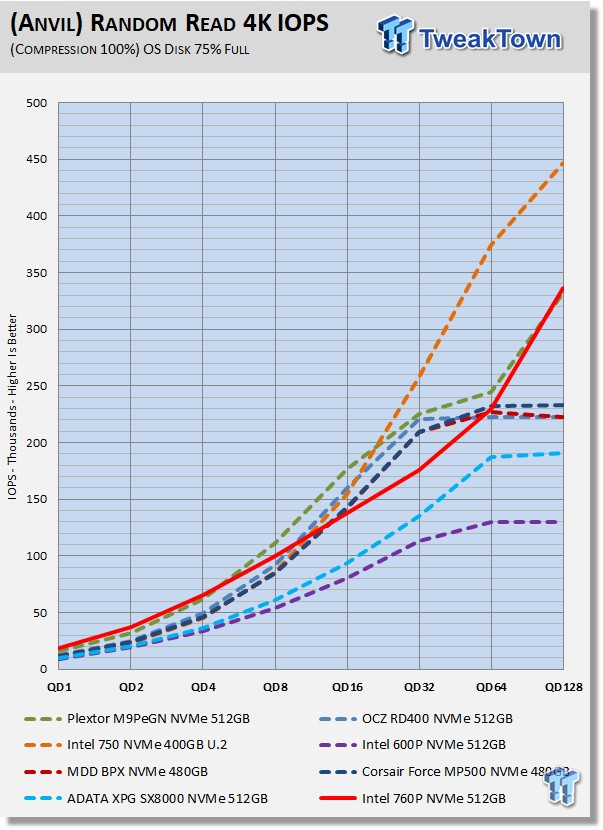
Random performance is much more important than sequential performance for a system disk. Low queue depth random performance is more important than high queue depth performance. With those two previous statements in mind, we give the win to the 760p because it delivers best-in-class low QD random read performance.
(Anvil) Write IOPS through Queue Scale
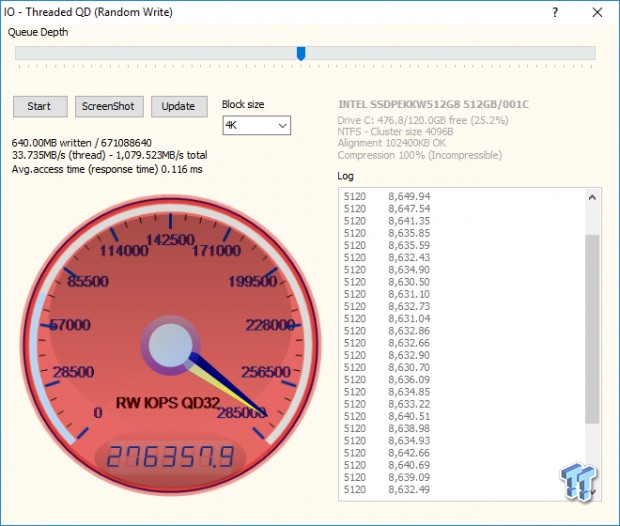
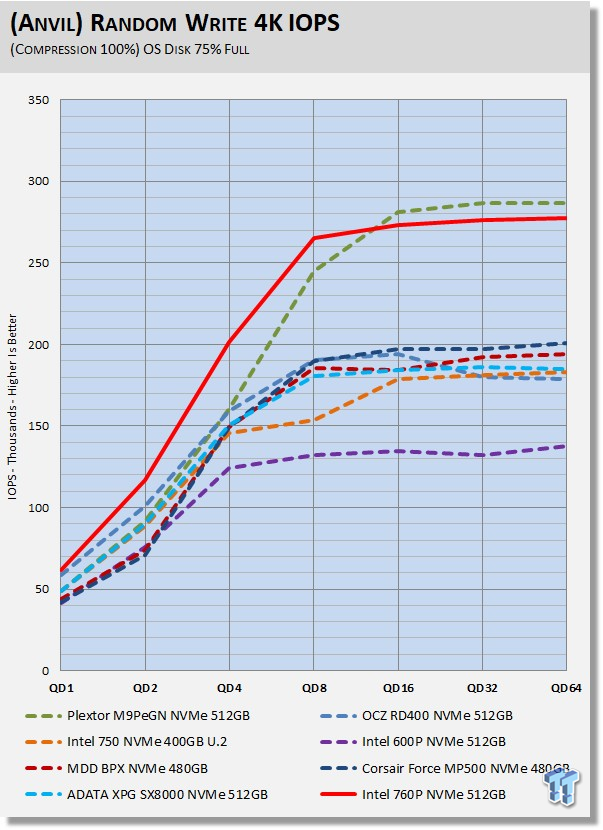
Awesome performance curve, the 760p easily wins this test and once again dominates the previous Intel offerings.
Synthetic Benchmarks - CrystalDiskMark & AS SSD
CrystalDiskMark
Version and / or Patch Used: 3.0 Technical Preview
CrystalDiskMark is disk benchmark software that allows us to benchmark 4K and 4K queue depths with accuracy. Note: Crystal Disk Mark 3.0 Technical Preview was used for these tests since it offers the ability to measure native command queuing at QD4. When evaluating CDM results, we focus on 4K random performance at QD1 and QD4.
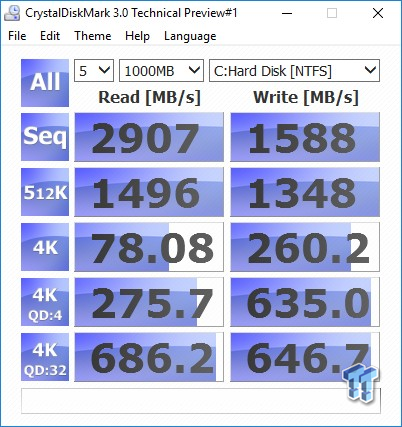
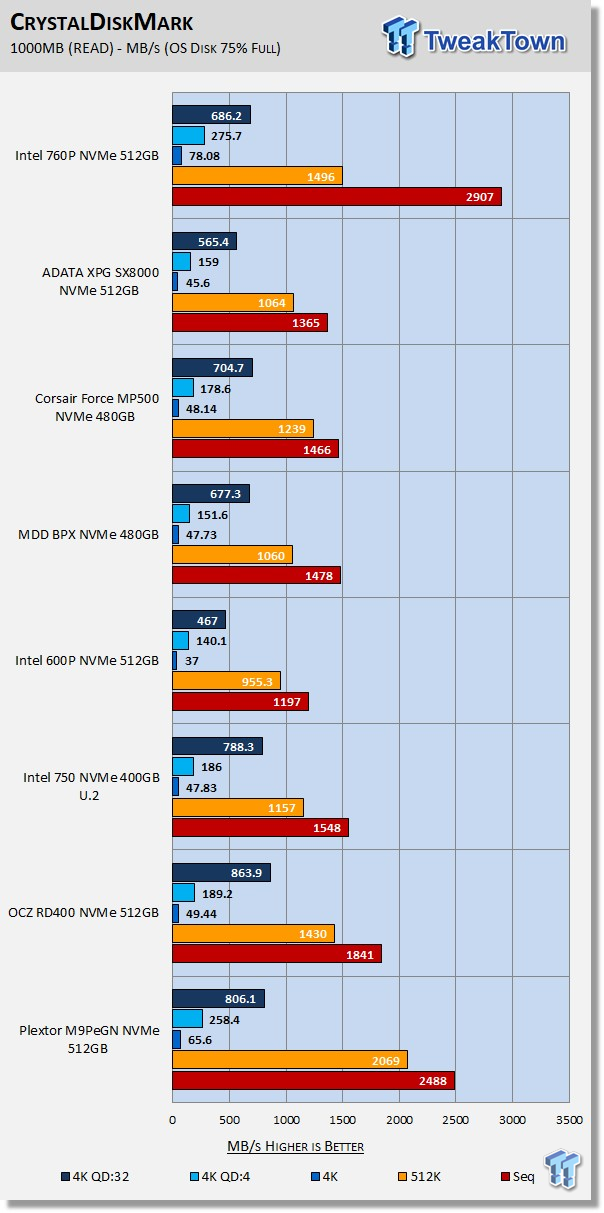
Focusing in on QD1 and QD4 we find the 760p delivering dominating performance. Although not charted, the 760p is delivering better random read performance at QD1 and QD4 than Samsung's 960 Series. This is in fact the best low queue depth random read performance we've seen from any flash-based SSD to date. We also cannot overlook the 760p's sequential read performance at QD1 because it's once again the best we've ever seen from a flash-based SSD.
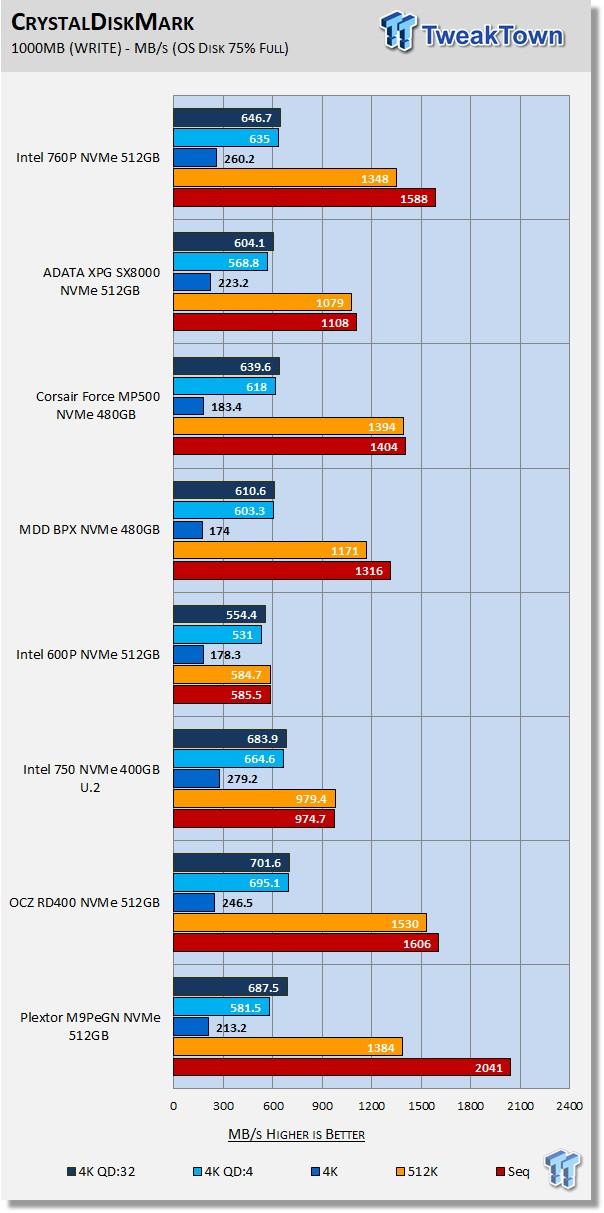
Random write performance at QD1, where it matters most, is second only to Intel's own 750 Series. We again looked back at our Samsung 960 Series numbers and found that the 760p is in-fact delivering better QD1 random write performance.
AS SSD
Version and / or Patch Used: 1.8.5611.39791
AS SSD determines the performance of SSDs. The tool contains four synthetic as well as three practice tests. The synthetic tests are to determine the sequential and random read and write performance of the SSD. We evaluate AS SSD performance in terms of overall score. We are looking for a minimum score of 2,000 when evaluating NVMe SSDs.
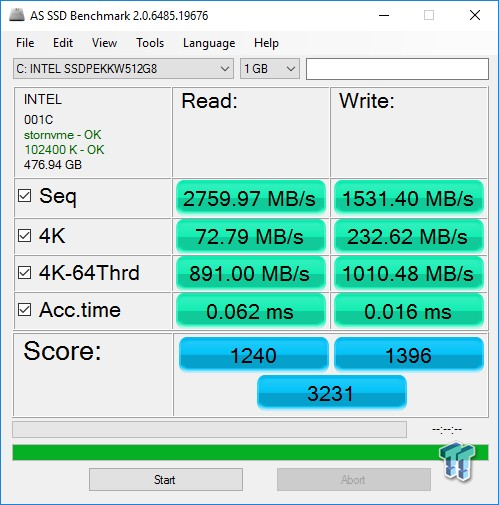
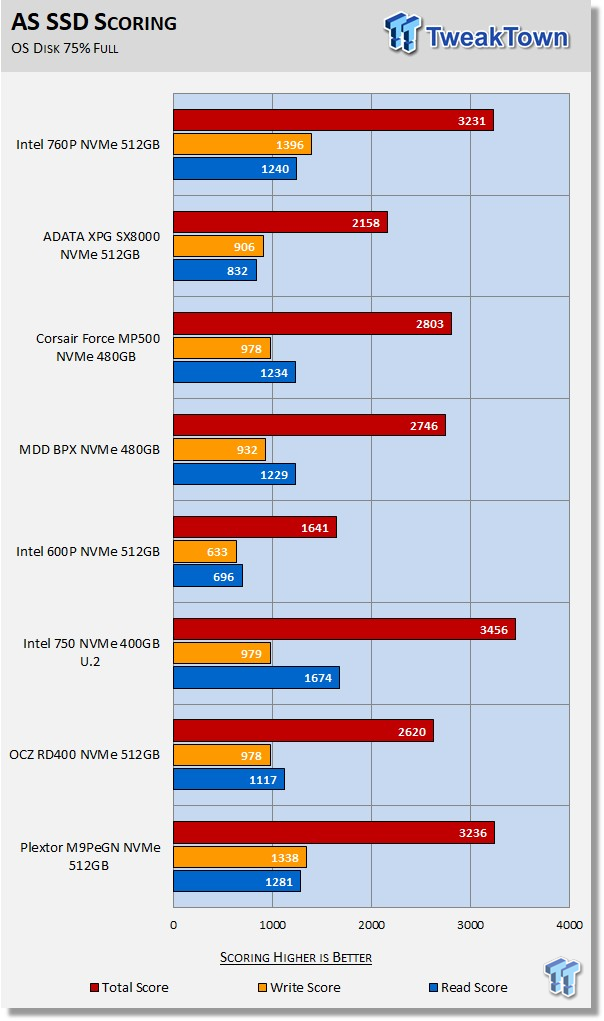
AS SSD is a demanding test, and as we've seen all along, when the 760p is reading random from its SLC cache at low queue depths, is the fastest flash-based SSD we've seen to date. 72 MB/s at QD1 random read is incredible to say the least. In terms of overall score, the 760p delivers Tier-1 performance but not the best we've seen. Now let's move on to moderate workload performance where SLC caching plays much less of a role in scoring.
Benchmarks (OS) - Vantage, PCMark 7, PCMark 8 & SYSmark 2014 SE
Moderate Workload Model
We categorize these tests as indicative of a moderate workload environment.
PCMark Vantage - Hard Disk Tests
Version and / or Patch Used: 1.2.0.0
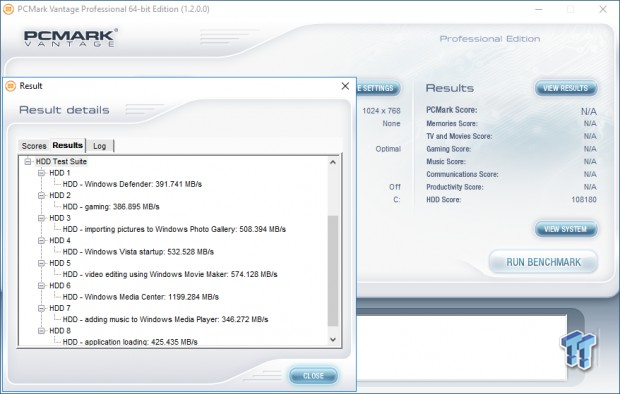
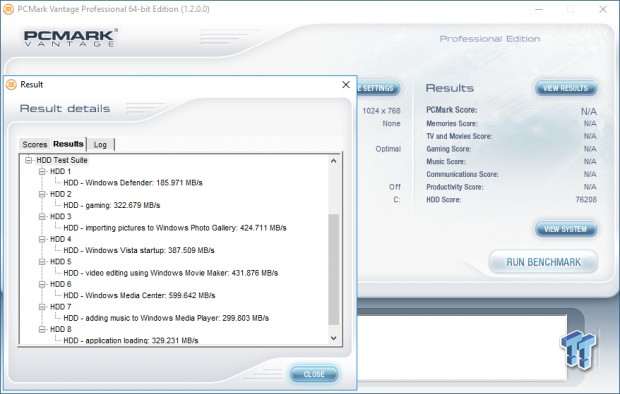
The reason we like PCMark Vantage is because the recorded traces are played back without system stops. What we see is the raw performance of the drive. This allows us to see a marked difference between scoring that other trace-based benchmarks do not exhibit. An example of a marked difference in scoring on the same drive would be empty vs. filled vs. steady state.
We run Vantage three ways. The first run is with the OS drive 75% full to simulate a lightly used OS volume filled with data to an amount we feel is common for most users. The second run is with the OS volume written into a "Steady State" utilizing SNIA's consumer guidelines. Steady state testing simulates a drive's performance similar to that of a drive that been subjected to consumer workloads for extensive amounts of time. The third run is a Vantage HDD test with the test drive attached as an empty, lightly used secondary device.
OS Volume 75% Full - Lightly Used
OS Volume 75% Full - Steady State
Secondary Volume Empty - FOB
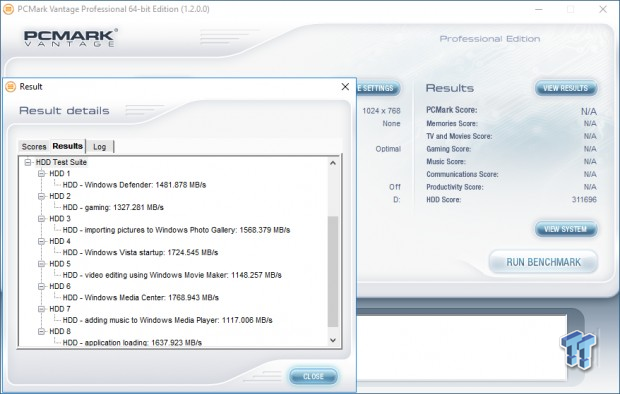
There's a big difference between an empty drive, one that's 75% full/used, and one that's in a steady state.
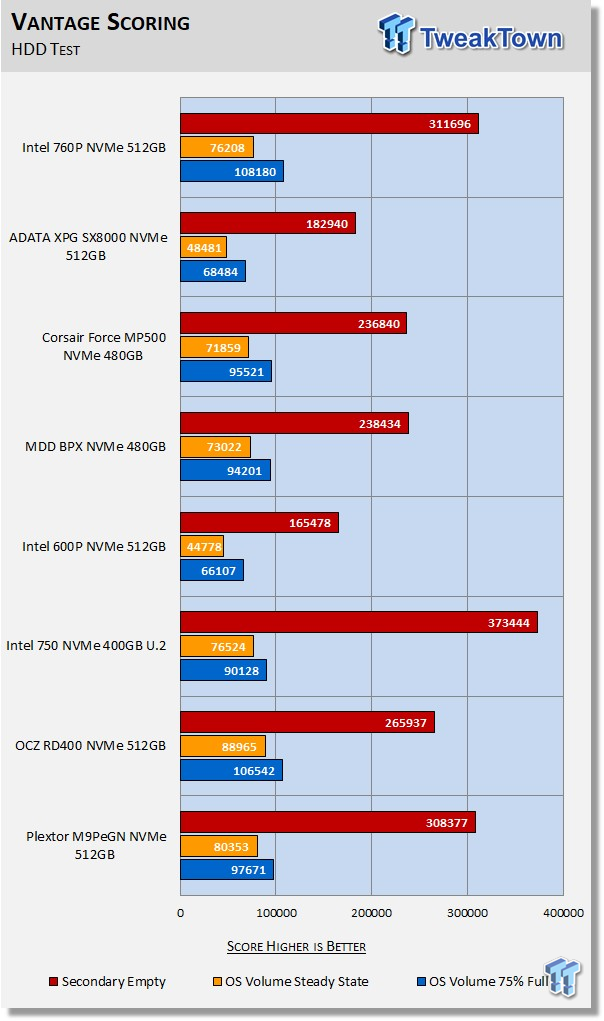
The important scores to pay attention to are "OS Volume Steady State" and "OS Volume 75% full." These two categories are most important because they are indicative of typical of consumer user states. When a drive is in a steady state, it means garbage collection is running at the same time it's reading/writing.
Focusing in on 75% full, we find the 760p beating all the contenders in our test pool. We looked back at our records and found that at 75% full and lightly used, the 760p delivers performance that is the third best for a flash-based SSD, behind only the 950 and 960 Pro both of which are MLC-based SSDs. Steady-state removes the impact of SLC caching completely and the 760p takes a bit of a beating, falling to 76K.
PCMark 7 - System Storage
Version and / or Patch Used: 1.4.0
We will look to Raw System Storage scoring for evaluation because it's done without system stops and, therefore, allows us to see significant scoring differences between drives. When evaluating NVMe SSDs we are looking for a minimum score of 11,000.
OS Volume 75% Full - Lightly Used
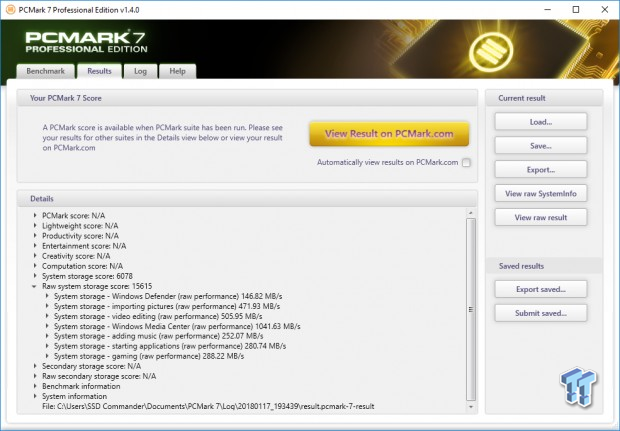
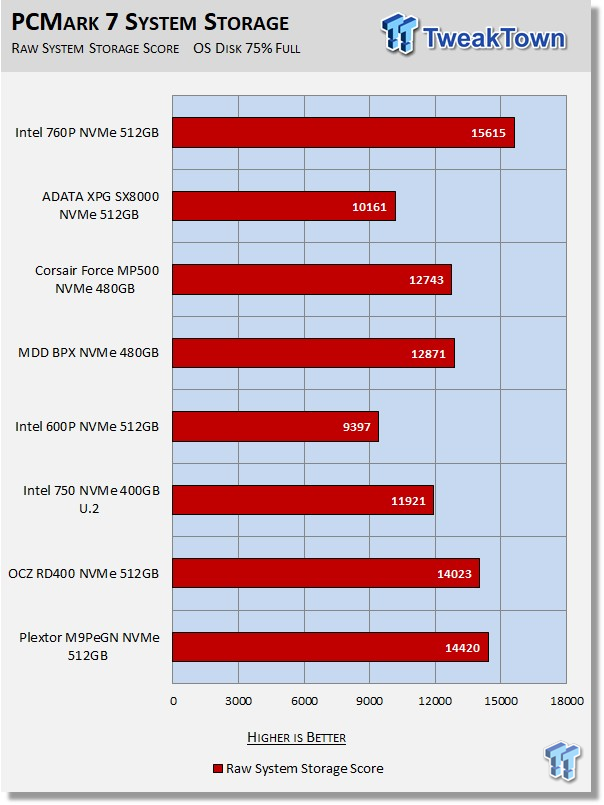
For reasons unknown, the 760p likes this test best when data is on the drive. With data on the drive, the 760p delivers roughly a 1000-point better score than when empty. We like better performance when data is on the drive, so we will take that any day. Looking at our chart, we see the 760p again dominating the drive's in our test pool. This performance is again the third best we've seen to date, behind only the 1TB M9PeY and the 2TB 960 Pro, both of which have a huge capacity advantage.
PCMark 8
Version and / or Patch Used: 2.4.304
We use PCMark 8 Storage benchmark to test the performance of SSDs, HDDs, and hybrid drives with traces recorded from Adobe Creative Suite, Microsoft Office, and a selection of popular games. You can test the system drive or any other recognized storage device, including local external drives. Unlike synthetic storage tests, the PCMark 8 Storage benchmark highlights real-world performance differences between storage devices. We focus on the total score first and then storage bandwidth when evaluating PCMark 8 results.
OS Volume 75% Full - Lightly Used
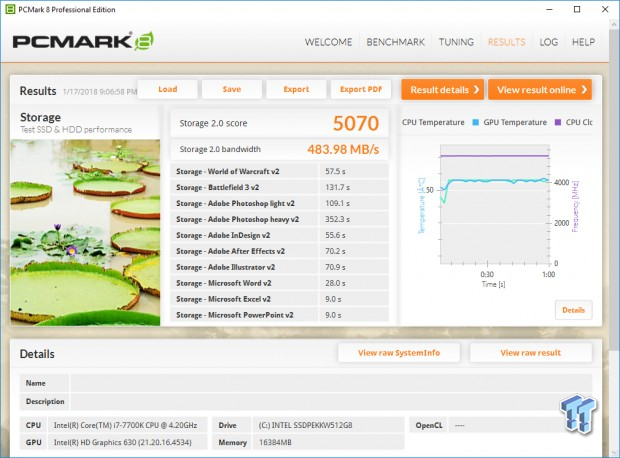

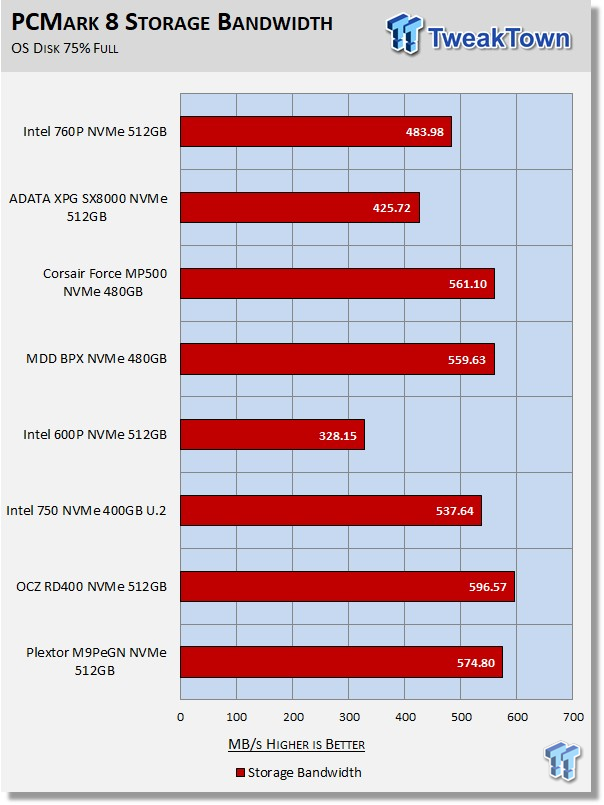
PCMark 8 is the most intensive moderate workload simulation we run. With respect to moderate consumer type workloads, this test is what we consider the best indicator of a drive's sustained performance. This is a long test that writes a lot of data, so the 760p's relatively small SLC cache doesn't have much of an impact on overall performance because it doesn't get a chance to flush often, so scoring is severely impacted. We would like to see some improvement here. Plextor's 64-layer BiCS 3 TLC powered M9Pe does significantly better than the 760p so we assume it is possible for some improvement here via firmware.
BAPCo SYSmark 2014 SE Application Performance
Version and / or Patch Used: 2.0.0.70
SYSmark 2014 SE is considered the gold standard for testing system performance because it is an application based benchmark. This test gives us the ultimate in real-world results because it utilizes actual applications running on the system, instead of playing back recorded traces. If you want to know what kind of impact a particular SSD will have on your system's overall performance; this test will show you.
Our systems are much more powerful than the calibration system (1000-point baseline) used by BAPCo, so we ran an OCZ TL100 120GB SATA III SSD to establish a comparison point relative to our test systems. We will be running this test going forward and we will add drives to our chart as we test them.
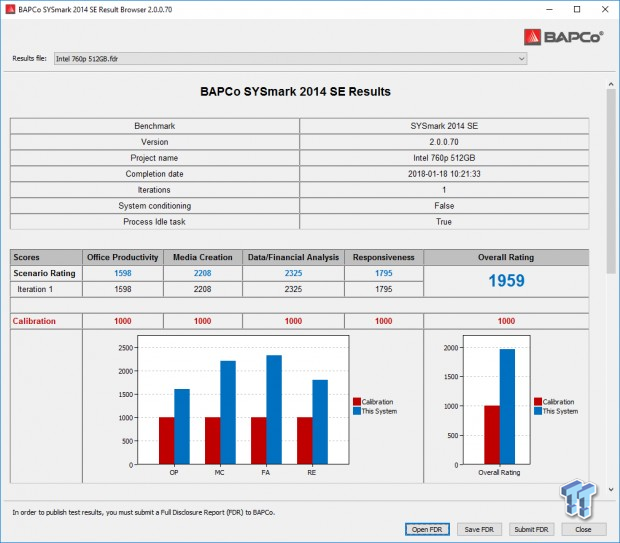
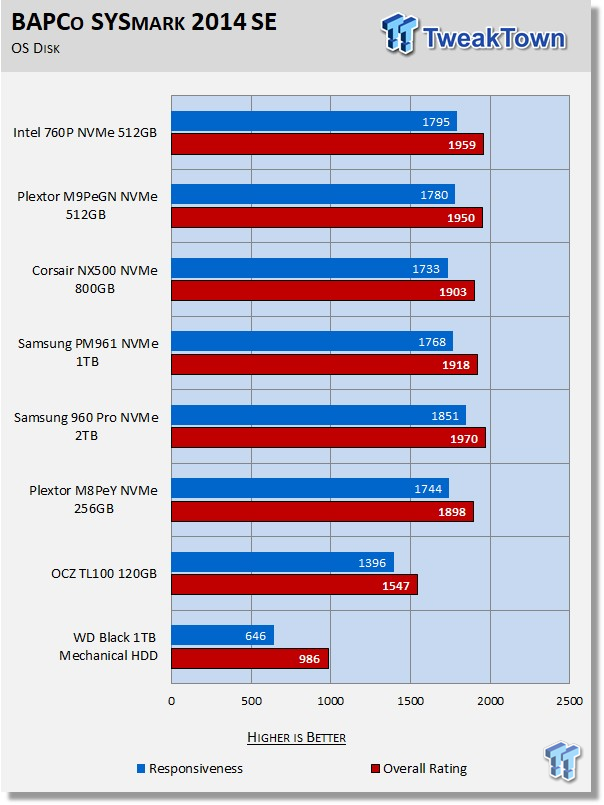
With this test we are back into burst mode, and we find the 760p delivering the goods in a big way. As a system disk, you can't do much better than the 760p when running normal consumer workloads. Here we find the 760p outperforming the Plextor M9Pe which is the opposite of what we saw with PCMark 8. In terms of realistic consumer workloads SYSmark is the only test that runs actual applications, so it at least in theory carries the most weight when evaluating expected consumer workload performance.
Benchmarks (Secondary) - IOPS, Response & Transfer Rate
Iometer - Maximum IOPS
Version and / or Patch Used: Iometer 2014
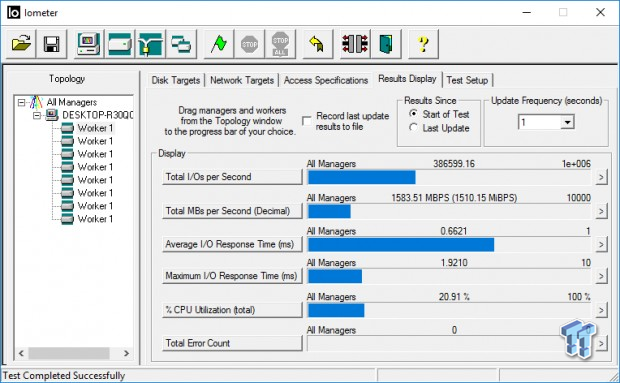
We use Iometer to measure high queue depth performance. (No Partition)
Max IOPS Read
Max IOPS Write
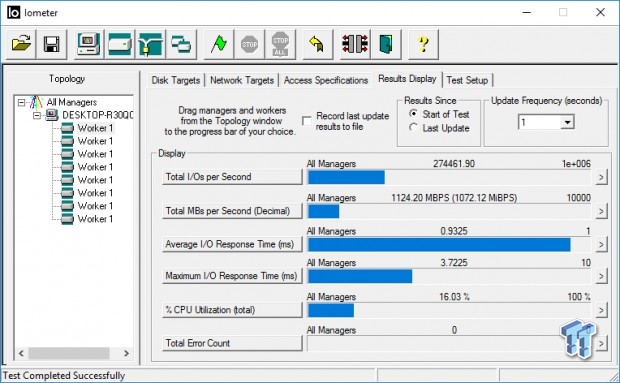
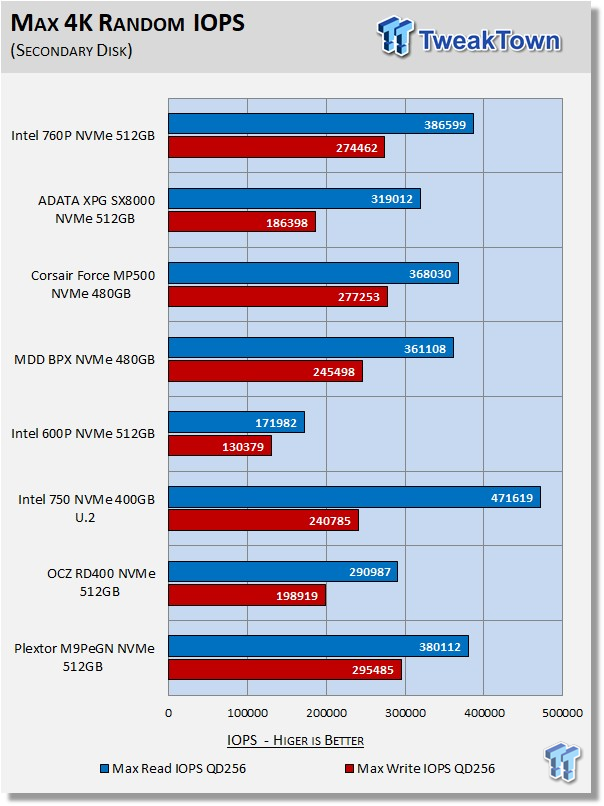
We test NVMe SSDs using eight threads at QD32, or QD256. We do this because we want to see what the drive can generate at its maximum attainable queue depth.
Iometer - Disk Response
Version and / or Patch Used: Iometer 2014
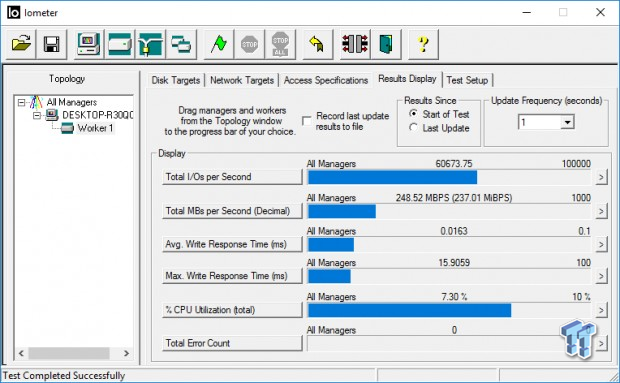
We use Iometer to measure disk response times. Disk response times are measured at an industry accepted standard of 4K QD1 for both write and read. Each test runs twice for 30 seconds consecutively, with a 5-second ramp-up before each test. We partition the drive/array as a secondary device for this testing.
Avg. Write Response
Avg. Read Response
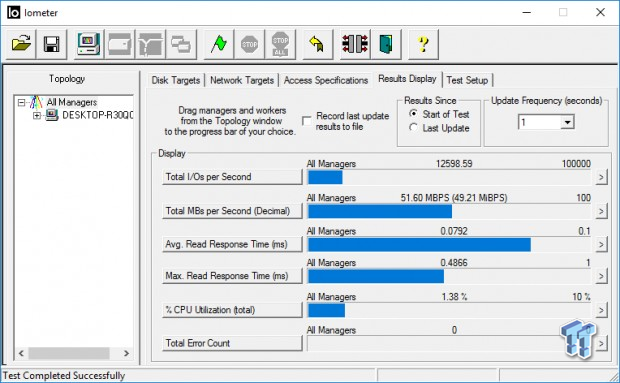
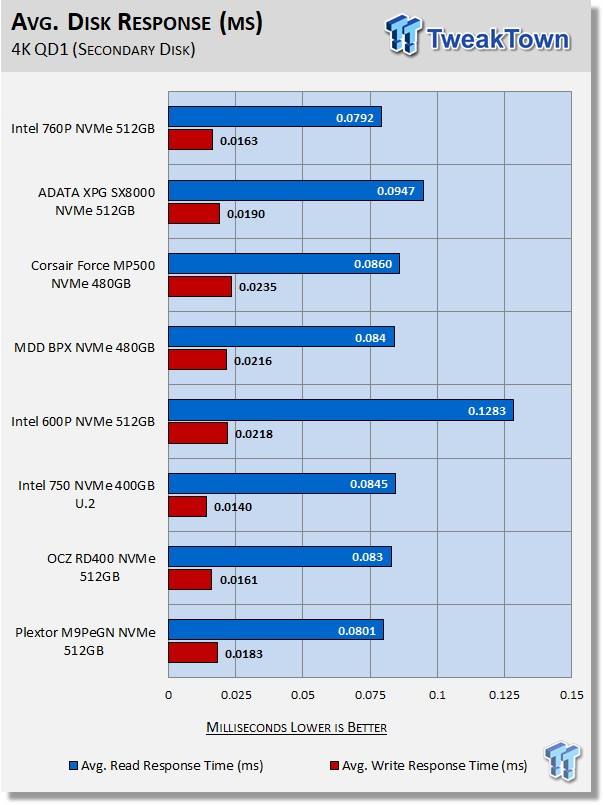
The 760p delivers the best-read response we've seen from any TLC-based SSD to date. And this is its native performance outside of the drives SLC cache. The only SSDs that can beat it are both Samsung and both MLC powered.
DiskBench - Transfer Rate
Version and / or Patch Used: 2.6.2.0
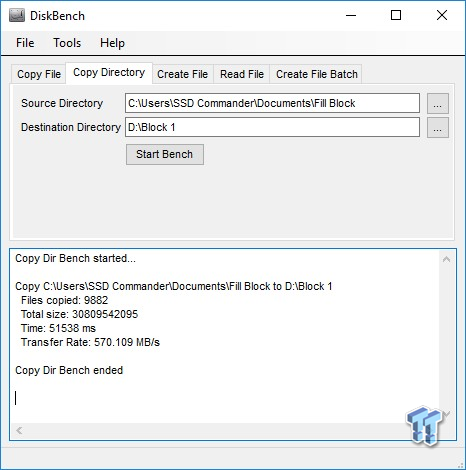
We use DiskBench to time a 28.6GB block (9,882 files in 1,247 folders) composed primarily of incompressible sequential and random data as it's transferred from our Toshiba RD400 1TB NVME SSD to our test drive. We then read from a 6GB zip file that's part of our 28.6GB data block to determine the test drive's read transfer rate. Our system is restarted prior to the read test to clear any cached data, ensuring an accurate test result.
Write Transfer Rate
Read Transfer Rate
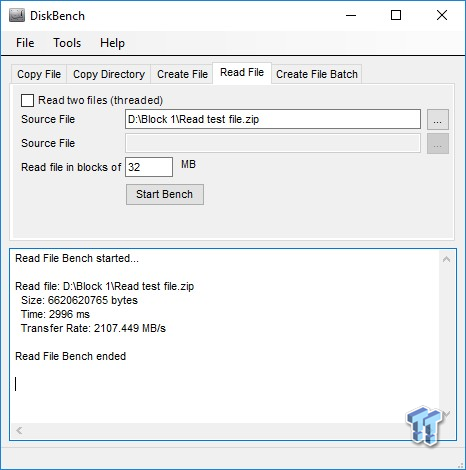
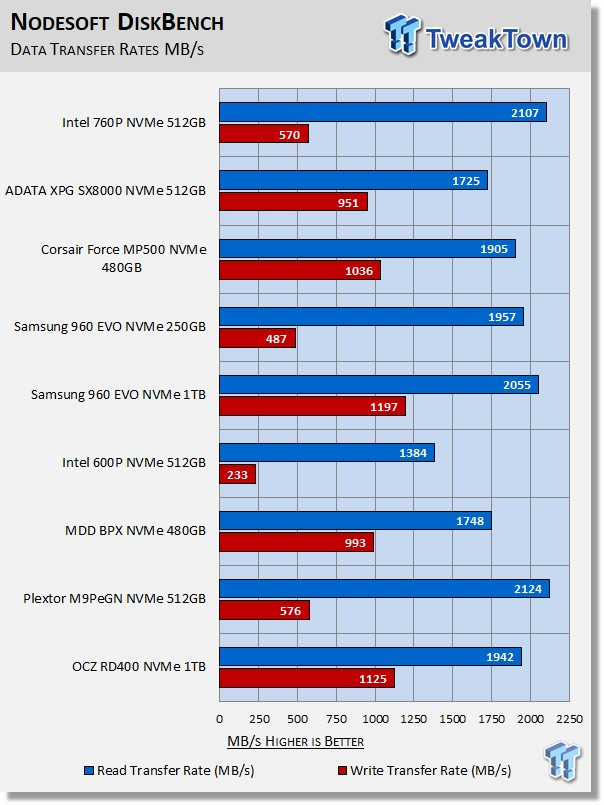
We recently upgraded our test system to Windows 10 build 14393. With that upgrade, write transfer rates almost doubled. The reason for this, as far as we know, is that CPU power switching modes have been relaxed on the latest version of Windows 10. We included the NVMe drives we've tested to date on this build of Windows 10. If you needed a good reason to upgrade to a newer version of Windows 10; this is a good reason.
This plays out exactly as we expected to see. Awesome read performance and average write performance. The 760p has a small SLC cache which has little if any impact on the drives sustained write performance. However, sustained write performance is good enough to keep most people happy. Read performance is outstanding, even better than we are getting from our $1000 960 Pro.
Benchmarks – 70/30 Mixed Workload & Sustained Sequential Write
70/30 Mixed Workload Test (Sledgehammer)
Version and / or Patch Used: Iometer 2014
Heavy Workload Model
This test hammers a drive so hard we've dubbed it "Sledgehammer". Our 70/30 Mixed Workload test is designed to simulate a heavy-duty enthusiast/workstation steady-state environment. We feel that a mix of 70% read/30% write, full random 4K transfers best represents this type of user environment. Our test allows us to see the drive enter into and reach a steady state as the test progresses.
Phase one of the test preconditions the drive for 1 hour with 128K sequential writes at QD32. Phase two of the test runs a 70% read/30% write at QD32, full random 4K transfer workload on the drive for 1 hour. We log and chart (phase two) IOPS data at 5-second intervals for 1 hour (720 data points). 60 data points = 5 minutes.
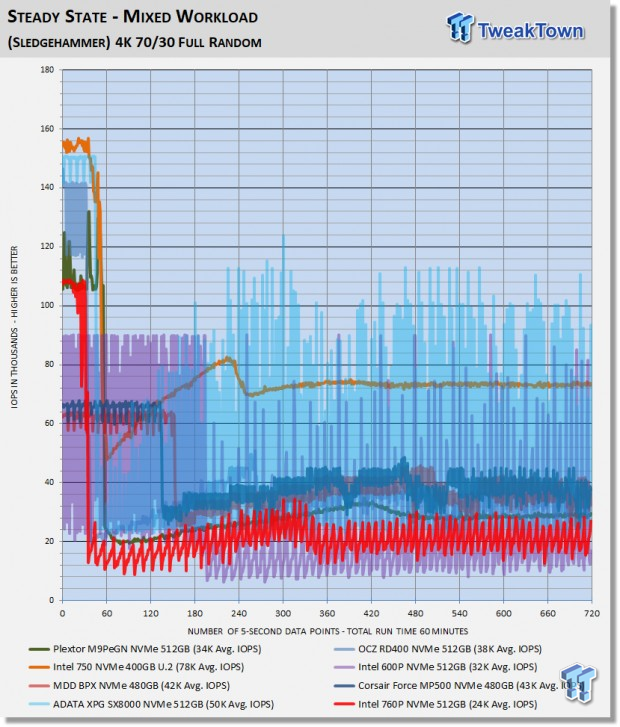
What we like about this test is that it reflects reality. Everything lines up, as it should. Consumer drives don't outperform Enterprise-Class SSDs that were designed for enterprise workloads. Consumer drives based on old technology are not outperforming modern Performance-Class SSDs, etc.
Sustained heavy workloads of this nature are very rare in the consumer space and that's a good thing for the 760p because it falls on its face when running this test. Even the lowly 600p manages to deliver better-sustained performance than the 760p. This is because the 600p does have some OP due to its odd die capacity.
Sustained Sequential Write
Version and / or Patch Used: Iometer 2014
Heavy Workload Model
We write to the drive for 1 hour with 128K sequential writes at QD32. We log and chart megabytes per second data at 5-second intervals for 1 hour (720 data points). 60 data points = 5 minutes.
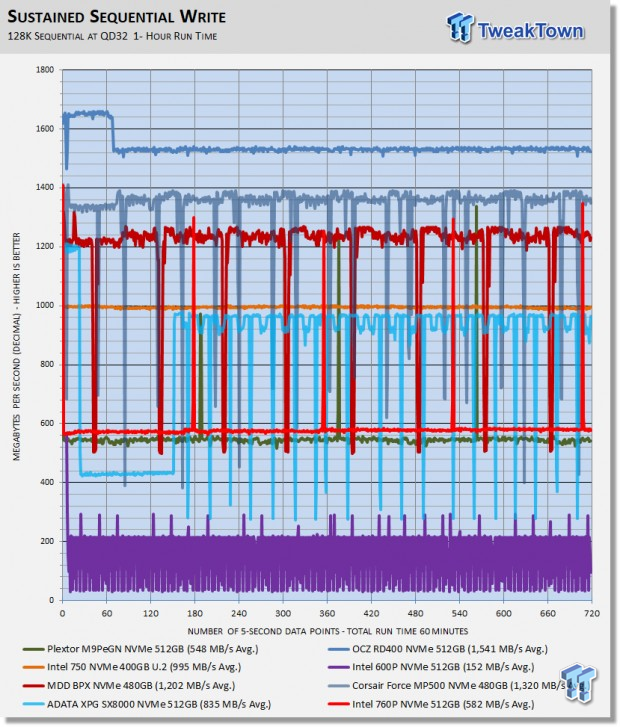
Like our transfer test, this test unmasks the sequential write performance of TLC flash arrays. The 512GB 760p sustains writes at an average of 582 MB/s which surprisingly is better than we are getting from Plextor's M9Pe 512GB. We can see that the drive's SLC cache only lasts for about 5 seconds at a time. Comparing the 760p to the 600p we find the 760p delivering 3.8x the sustained write performance.
Maxed-Out Performance (MOP)
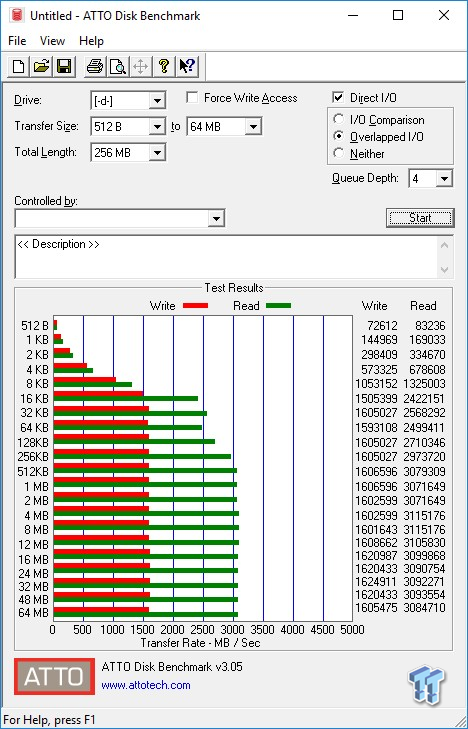
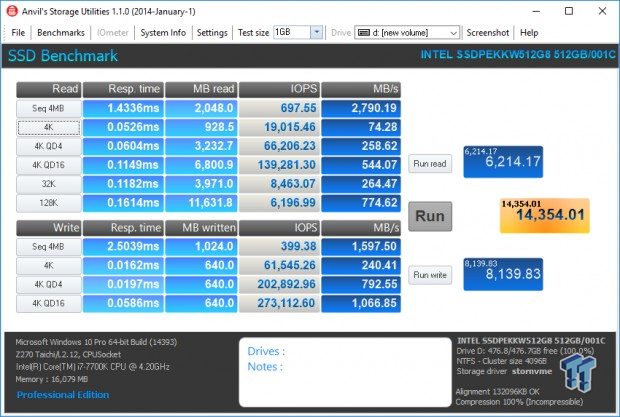
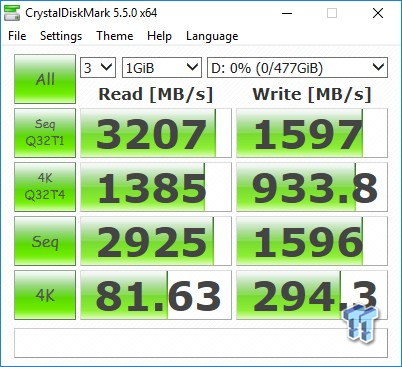
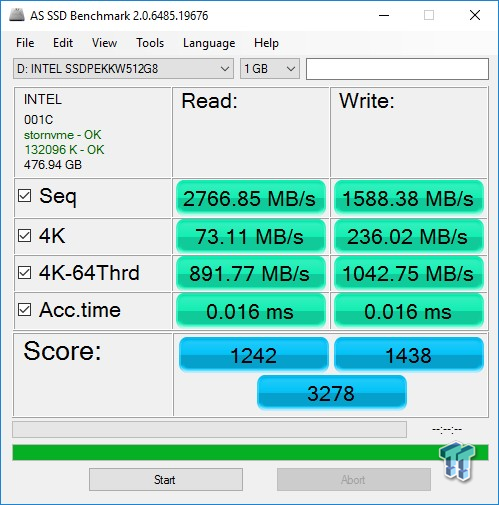
This testing is just to see what the drive is capable of in an FOB (Fresh Out of Box) state under optimal conditions. We are utilizing empty volumes of Windows 10 and Windows Server 2008 R2 64-bit for this testing.
Windows 10 MOP
Intel 760P 512GB M.2 PCIe NVMe SSD
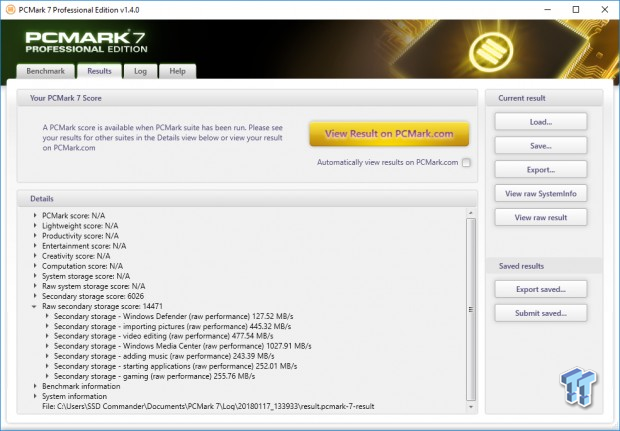
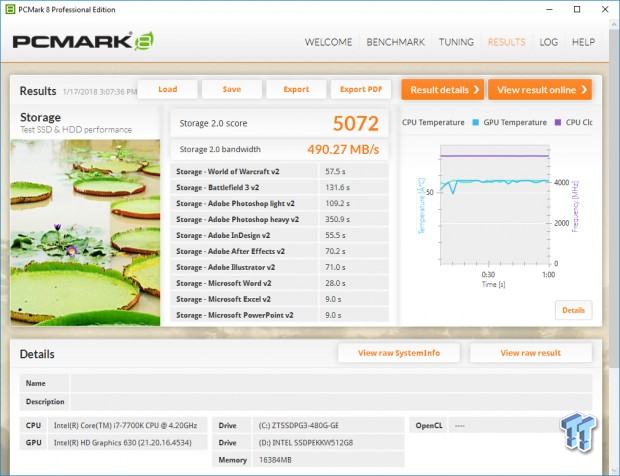
Windows 10 MOP Alternate NVMe Driver
Intel 760P 512GB M.2 PCIe NVMe SSD
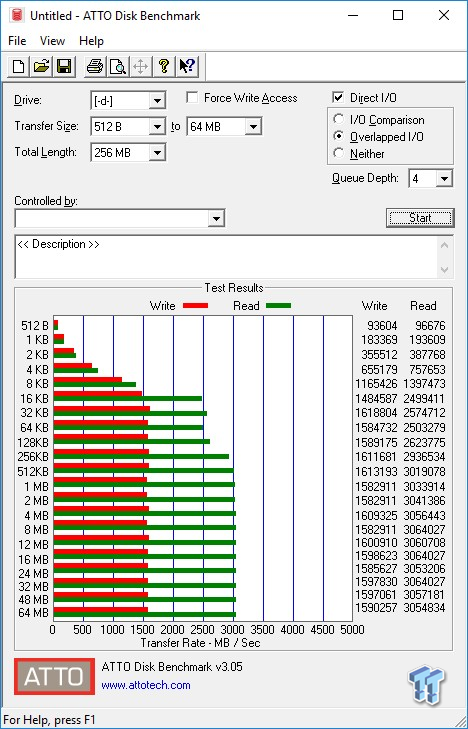
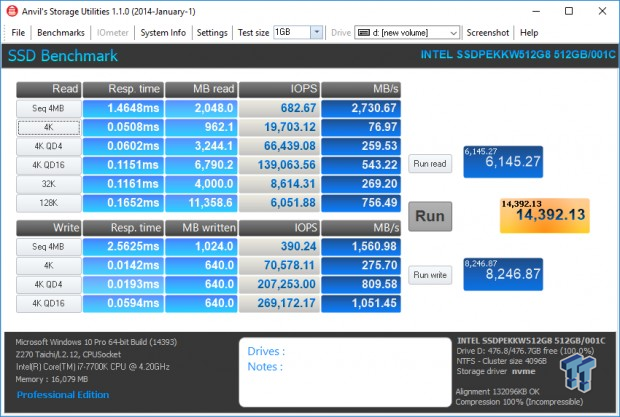
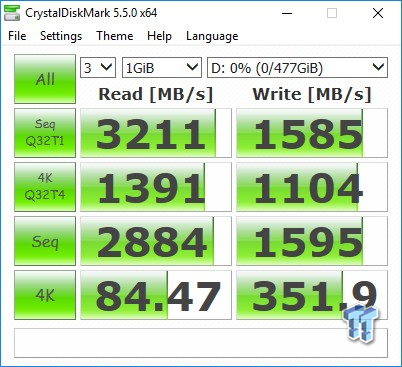
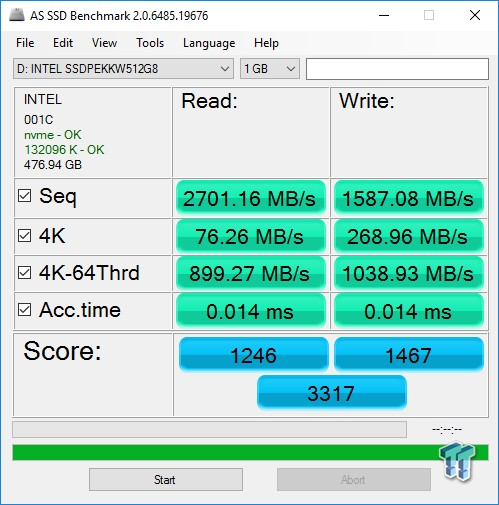
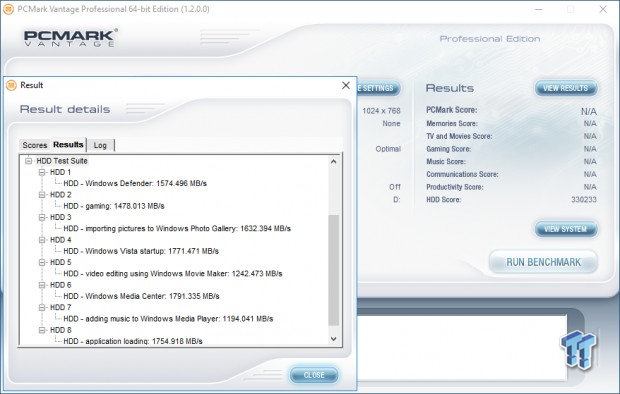
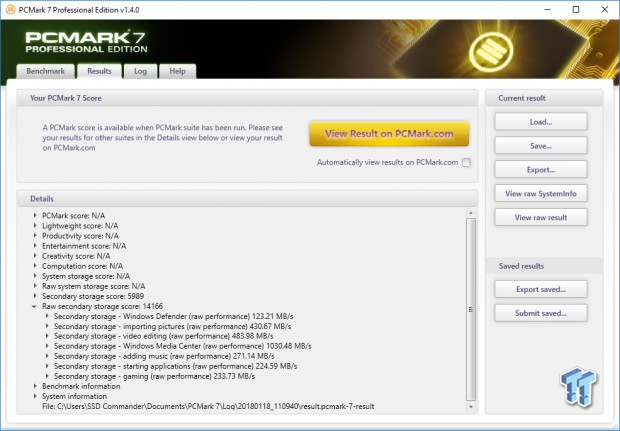
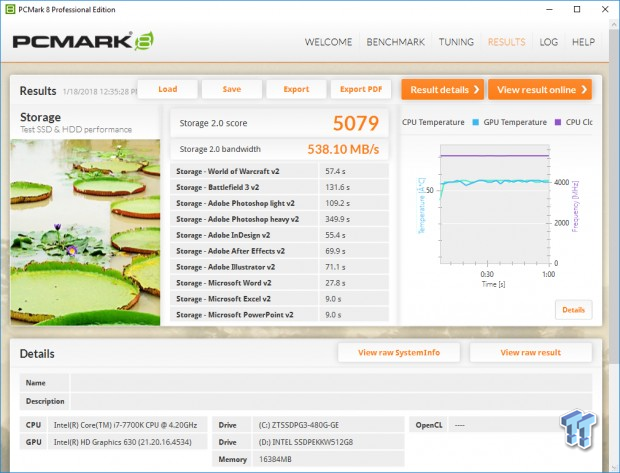
Notice the huge increase in random performance when we use an alternate NVMe driver. This results in a significant increase in workload performance as evidenced by our PCMark 8 workload test. We would like to see a proprietary NVMe driver offered by either Intel or SMI for the 760p.
Windows Server 2008 R2 MOP
Intel 760P 512GB M.2 PCIe NVMe SSD Alternate NVMe Driver
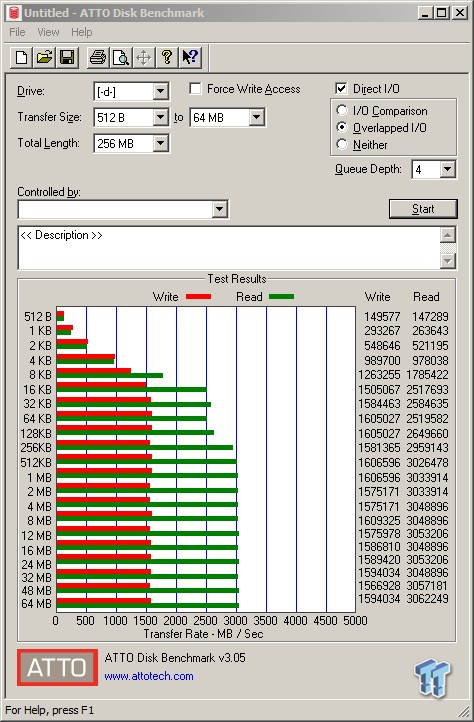
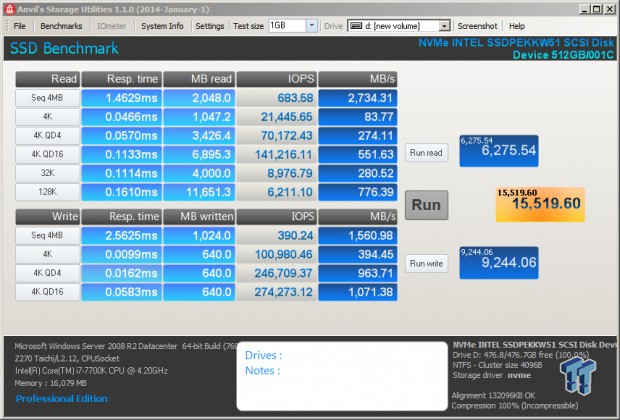
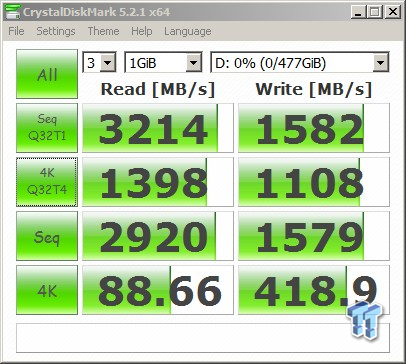
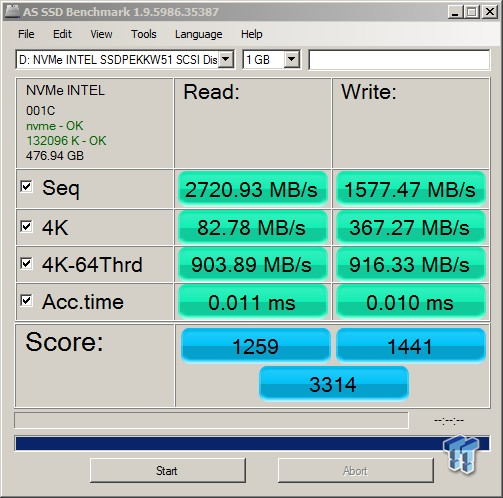
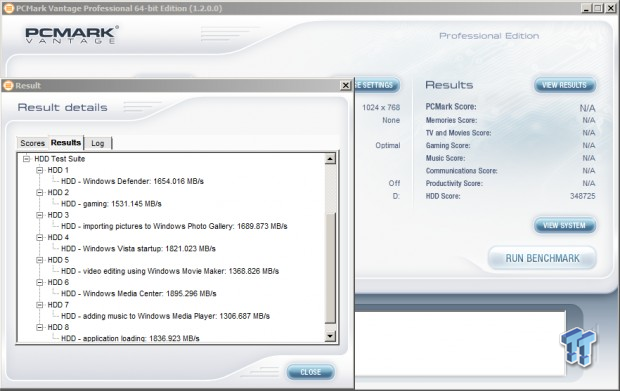
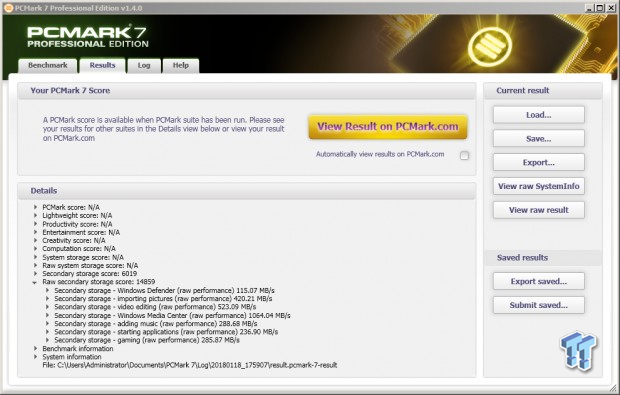
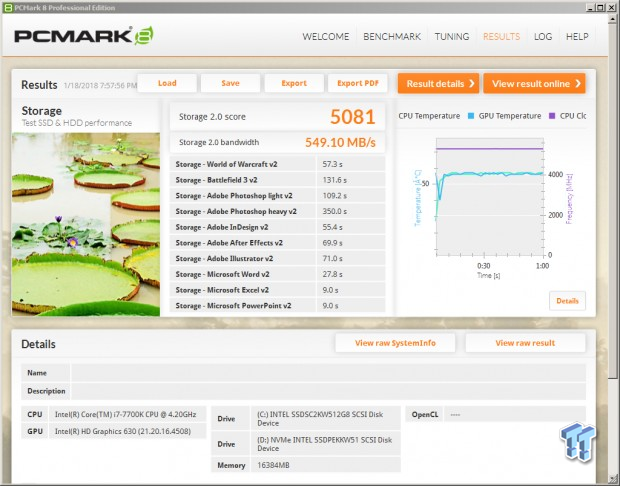
Low queue depth random performance is the best we've seen from any flash-based SSD when running these tests under the same conditions, using the same alternative NVMe driver.
Final Thoughts
Looking back at our benchmarks, Intel's 760p emerges as a new force to be reckoned with. It trades blows with Plextor's next-gen M9Pe for TLC supremacy. Overall though, the 760p is probably the best performing TLC SSD for consumer use we've seen to date. We are glad to see SMI has made a massive leap forward in NVMe controller technology with the SM2262. That bad taste in our mouths left by the SM2260 is all but forgotten.
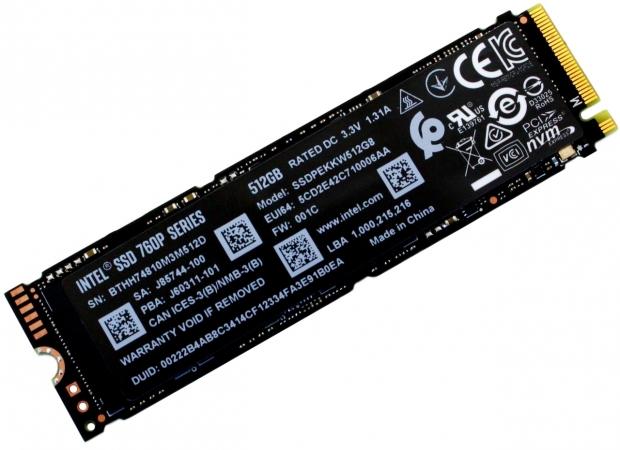
As with the 600p, the 760p is designed with the intention of delivering NVMe goodness to the masses with a price tag that is at or near the cost of SATA. The 600p hit the mark with pricing, but missed the mark badly in the performance department, because for the most part, a typical SATA SSD offers better system performance.
With the 760p the opposite has come to fruition. The 760P delivers the best random read performance of any flash-based SSD we've tested to date when reading from the drive's SLC cache. This translates directly to incredibly good consumer workload performance as evidenced by Vantage, PCMark 7 and most importantly SYSmark. We did expect the 760p would do better with PCMark 8 storage testing, but that's really the lone disappointment we have with the 760p.
As we mentioned in the review and demonstrated on our Maxed-Out-Performance page, we would like to see a proprietary NVMe driver be offered for the 760p because random performance can be significantly increased. The better the random performance, the better your system performs as a whole.
Pairing Silicon Motion's 2262 controller with Intel 64-layer TLC is a match made in heaven. The price is right, and the performance is spot on. Additionally, the Intel 760p is super power efficient, maybe the most power efficient 8-channel NVMe SSD on the market. This makes the 760p probably the best choice for a powerful notebook NVMe SSD.
The 760p is a very powerful SSD with extremely low power consumption, which is a rare combination indeed. In terms of overall performance when running moderate workloads, you can expect the 760p to deliver moderate workload performance that is better than Samsung's popular 960 EVO at similar capacity points. Running the 760p as our system disk turned out to be pure excellence. Lightning quick boots, instantaneous system response, killer multitasking performance and stunning aesthetics are all part of the Intel 760p SSD experience.
With these things in mind, Intel's 760p is TweakTown recommended and Editors Choice awarded.
Pros:
- Overall Performance
- Sleek Design
- Low Price Point
Cons:
- No Proprietary NVMe Driver

