

Our Verdict
Introduction, Drive Specifications, Pricing and Availability
The Phison PS3110-S10 controller, or S10 controller as we will refer to it going forward, is a controller that we have seen a few times in the past. First, we saw it implemented on the Corsair Neutron XT. Next came Kingston's HyperX Savage. Shortly after, we saw this potent controller make an appearance on the Patriot Ignite, and lastly we got a taste of the S10 powered OCZ TRION 100. The Neutron XT features the S10 and Toshiba A19nm flash in BGA packages. The HyperX Savage features the S10 and A19nm Toshiba MLC flash in TSOP packages. The Ignite features the S10 and 16nm Micron asynchronous MLC flash in BGA packages. The TRION 100 features the S10 and A19nm Toshiba TLC flash in BGA packages. The Ignite performs well, the TRION 100 just the opposite, the Neutron XT and HyperX Savage both deliver top-level performance. The exceptional performance of the Neutron XT and HyperX Savage opened our eyes to the potential of the Phison S10 controller.
Zotac is a company mostly known for exceptional graphics solutions. Looking to broaden their portfolio, Zotac has expanded their offerings to include a new line of Solid State Drives. The drive we have on the bench today is Zotac's newly launched 240GB Premium SSD. This new SSD immediately piqued our interest, because it's powered by Phison's S10 controller, and premium Toshiba A19nm MLC flash; a known potent combination. Not only that, Zotac's entry into the SSD ring is priced right. Zotac's newly launched Premium SSD is currently selling for $80 for the 240GB model and $170 for the 480GB model, which is far less than both the Neutron XT and the HyperX Savage. More importantly, Zotac's Premium SSD is priced lower at launch than Samsung's 850 EVO typically sells for.
When we tested the Neutron XT and the HyperX Savage, we were particularly impressed with the sequential performance of both of these drives. Sequential performance and write transfer rates of these drives are unparalleled in the SATA arena. However, random 4K read performance at QD1 remains one of the few spots where we are hoping to see some improvement. In our opinion, a drive that can deliver 4K QD1 read performance of 10K IOPS is something that separates elite SSDs from the rest. We have heard rumors that Phison is working on firmware that will increase performance in this area, whether or not this rumor is factual or not we really don't know for sure. With that said, we do notice that Zotac's Premium series SSD are loaded with firmware that is a different revision than what we've previously seen. To be clear, all we have to go on is a rumor, and this firmware may be just a minor revision. We tend to believe this new firmware is a minor revision because it is still one series firmware.
We don't know a lot about Zotac's new SSD's except that they are Phison S10 controlled and that they are utilizing MLC flash arrays. Zotac didn't do a formal launch of the product, just an announcement and the drives showed up on Newegg. We didn't get any inside information like we usually do, but we managed to get our hands on a Zotac Premium 240GB SSD, so let's see what Zotac's first SSD can deliver.
Specifications: Zotac Premium 240GB SATA III SSD
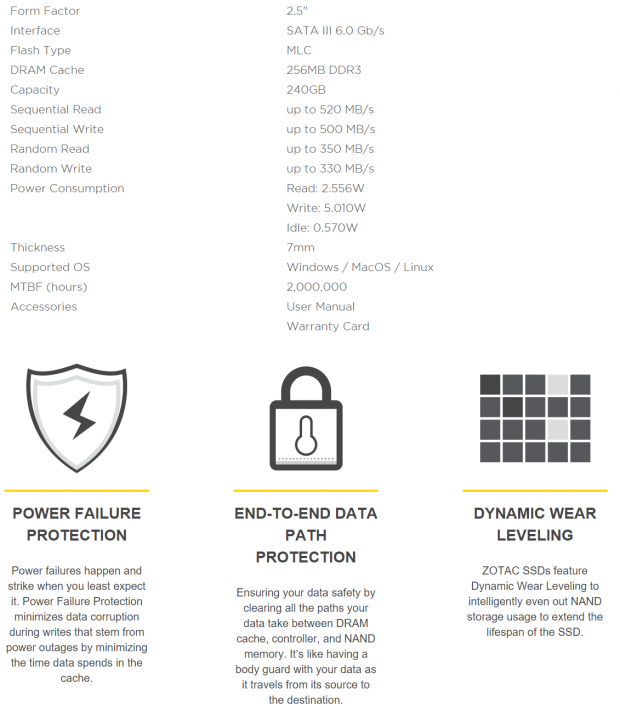
The Zotac Premium SATA III 2.5" x 7mm FF SSD is available in two capacities: 240GB and 480GB. Sequential read performance for the 240GB model is listed as up to 520 MB/s. Sequential write performance is listed as up to 500 MB/s. Random 4K read performance is listed at up to 350 MB/s.
Random 4K write performance is listed as up to 330 MB/s. MTBF comes in at 2 million hours. Zotac backs their Premium series with an industry standard 3-year warranty. No TBW is given.
Our Latest SSD Review Coverage
- Micron 3610 2TB SSD Review - DRAMless QLC at 11,000 MB/s
- SK hynix Platinum P51 2TB SSD Review - A Powerful Gen5 Alternative
- Biwin Black Opal X570 Pro 8TB SSD Review - Massive Capacity with Elite Performance
- Samsung 9100 PRO 1TB SSD Review - Lab Champion at 1TB
- Biwin Black Opal X570 Pro 2TB SSD Review - Powerful and efficient single-sided goodness
Drive Details
Zotac Premium 240GB SATA III SSD
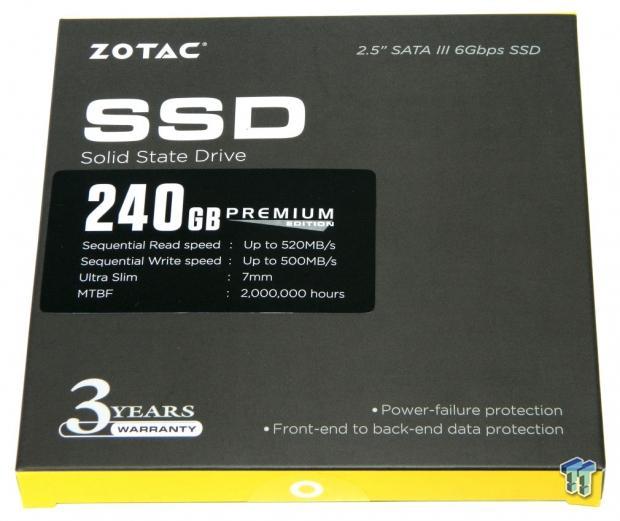
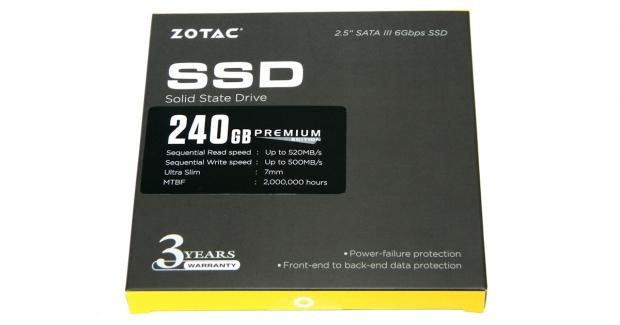
Zotac's Premium Edition SSD retails in a small square gray box with yellow trim. The front of the box advertises the drive's capacity, sequential performance, warranty and data protection features.
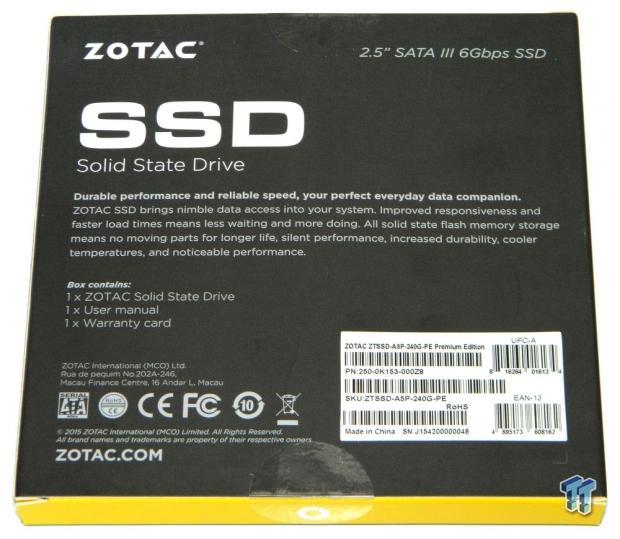
The rear of the packaging lists the contents and lists some benefits common to SSDs.
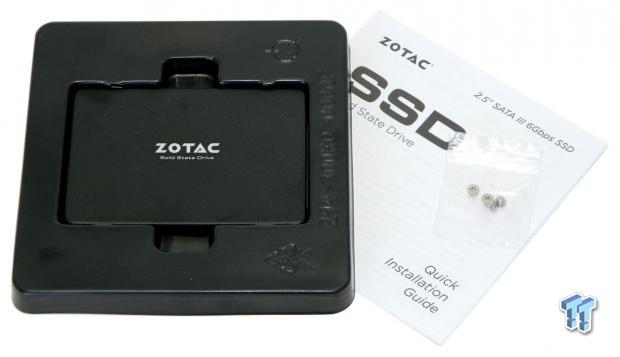
Inside the box, we find the drive itself nestled in a black plastic tray. Also included is a paper quick start guide and four mounting screws.
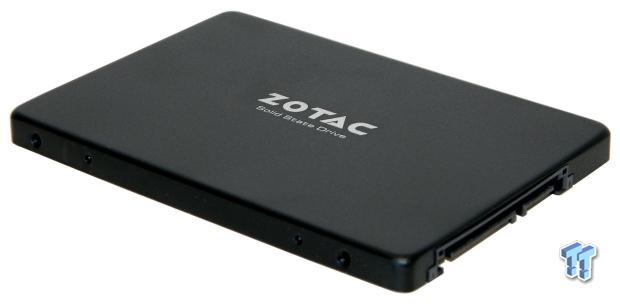
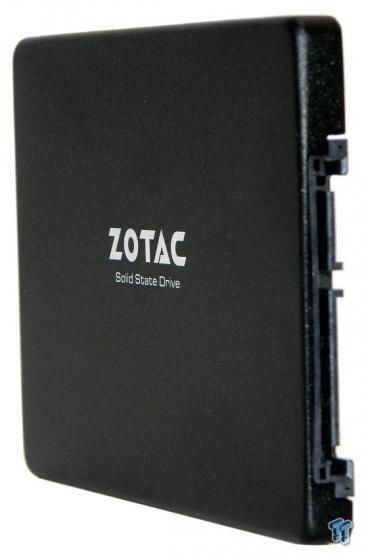
The front of the drive's black colored aluminum enclosure is simplistic and attractive.
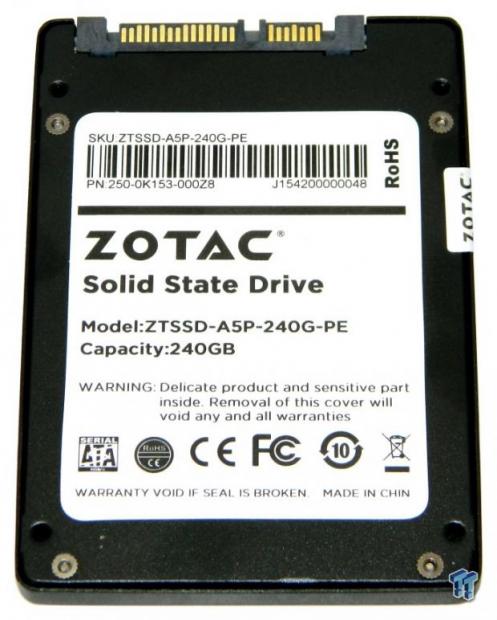
The back half of the drive's aluminum enclosure has a manufacturer's label that lists the drive's model number, capacity, serial number and other relevant information.
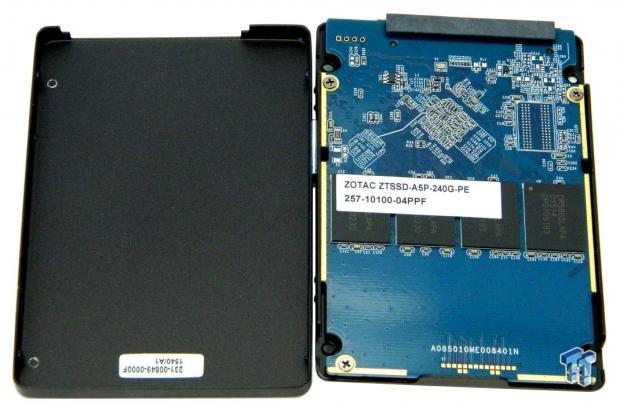
The drive's full-length PCB is attached to the bottom of the drive's aluminum enclosure with four screws.
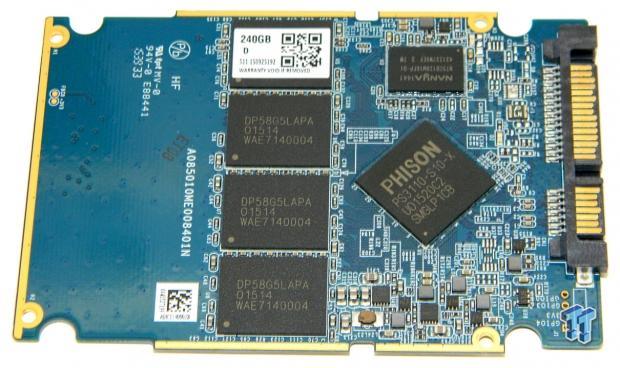
The drive's S10 controller, half of its flash packages and DRAM cache package are located on this side of the full-length PCB.
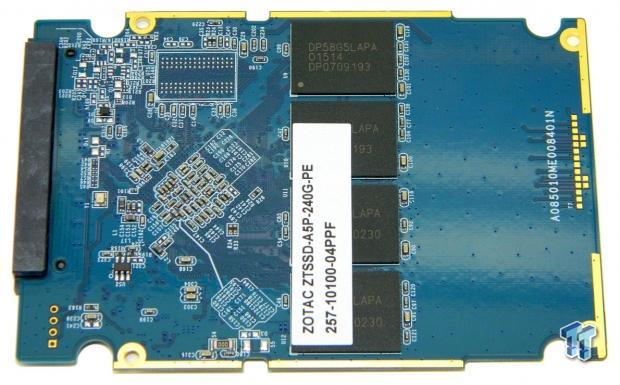
This side of the PCB houses the remaining half of the drive's flash packages, along with various surface mounted components.
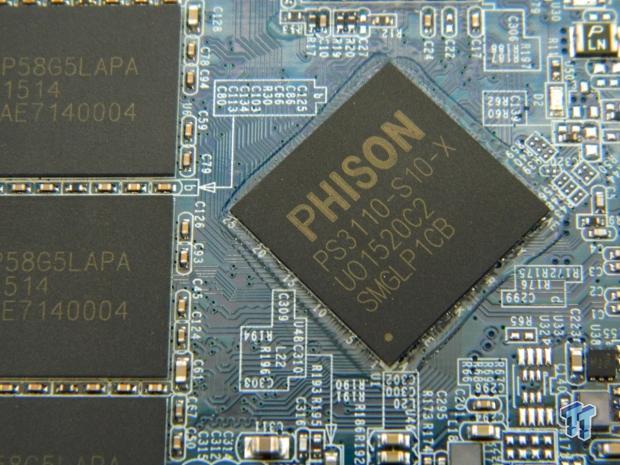
A close-in view of the Phison S10 controller that powers the Zotac Premium SSD.
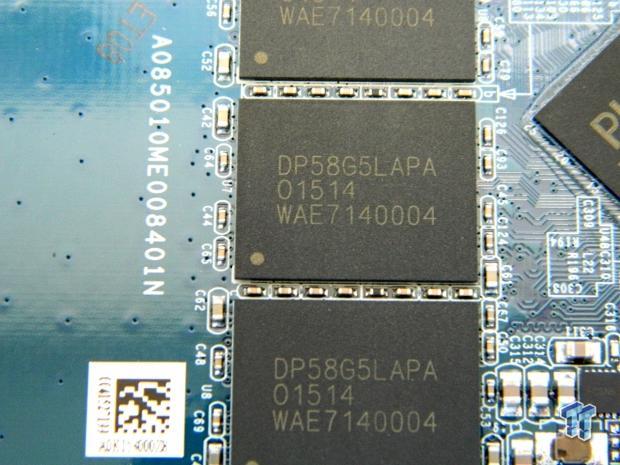
A close-in view of one the drive's eight 19nm Toshiba MLC Toggle Mode BGA flash packages.
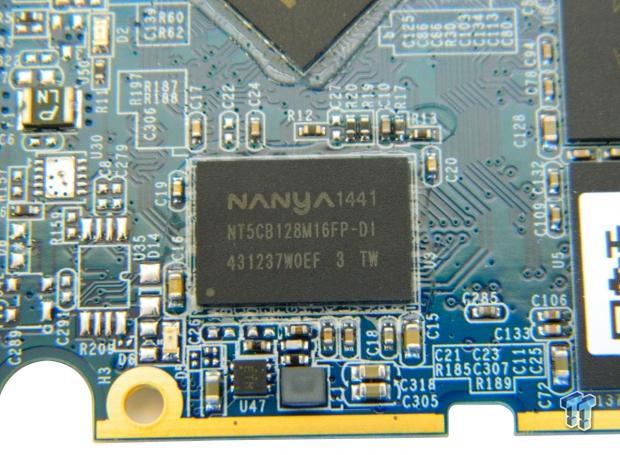
Finally, a close-in view of the drive's 256MB Nanya DDR3 DRAM package.
Test System Setup and Properties
Jon's Consumer SSD Review Test System Specifications
- Motherboard: ASRock Extreme9 Z97 - Buy from Amazon
- CPU: Intel Core i7 4790K @ 4.8GHz - Buy from Amazon / Read our review
- Cooler: Swiftech H2O-320 Edge - Buy from Amazon / Read our review
- Memory: Corsair Dominator DDR3 32GB 2400MHz - Buy from Amazon
- Video Card: Onboard Video
- Case: IN WIN X-Frame - Buy from Amazon / Read our review
- Power Supply: Seasonic Platinum 1000 Watt Modular - Buy from Amazon / Read our review
- OS: Microsoft Windows 10 Professional 64-bit - Buy from Amazon
- Drivers: Intel RAID option ROM version 13.0.0.2075 and Intel RST driver version 13.6.0.1002
We would like to thank ASRock, Crucial, Intel, Corsair, RamCity, IN WIN, and Seasonic for making our test system possible.
Drive Properties
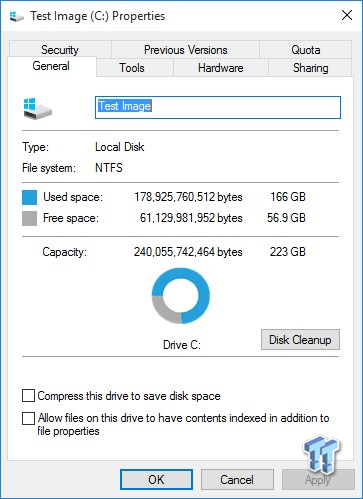
The majority of our testing is performed with our test drive as our boot volume. Our boot volume is 75% full for all OS Disk "C" drive testing to replicate a typical consumer OS volume implementation. We feel that most of you will be utilizing your SSD's for your boot volume and that presenting you with results from an OS volume is more relevant than presenting you with empty secondary volume results.
System settings: Cstates and Speed stepping are both disabled in our systems BIOS. Windows High-Performance power plan is enabled. Windows write caching is enabled, and Windows buffer flushing is disabled. We are utilizing Windows 10 Pro 64-bit OS for all of our testing except for our MOP (Maxed-Out Performance) benchmarks where we switch to Windows Server 2008 R2 64-bit.
Synthetic Benchmarks - ATTO & Anvil Storage Utilities
ATTO
Version and / or Patch Used: 2.47
ATTO is a timeless benchmark used to provide manufacturers with data used for marketing storage products.
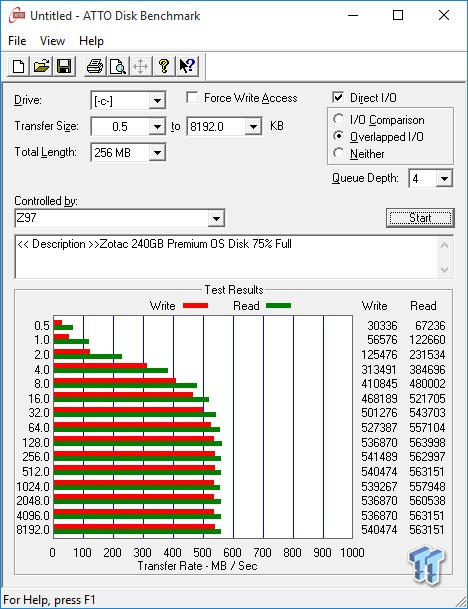
Sequential read/write transfers max out at 563/541 MB/s. Keep in mind this is our OS volume 75% full. Sequential performance is much better than Zotac's specifications.
Sequential Write
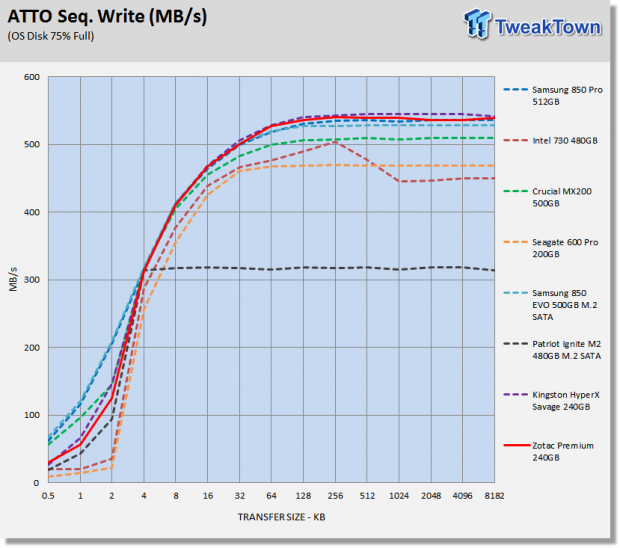
The HyperX Savage edges the Zotac Premium for the best sequential performance.
Sequential Read
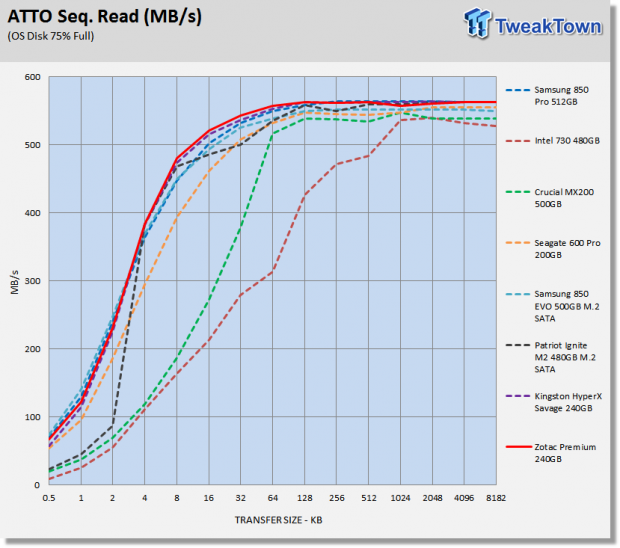
The Zotac Premium outperforms all the drives in our test pool at transfer sizes of 4KB - 128KB. This is our first indication that the Zotac Premium may have better read performance than the HyperX Savage. If so, this would seem to indicate that the Zotac Premium may be benefiting from the minor firmware revision we noticed.
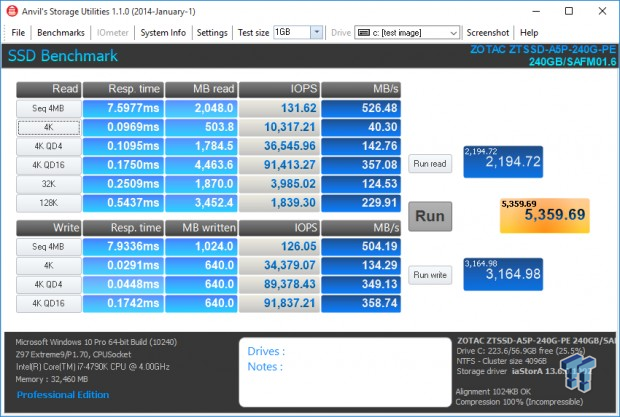
Anvil Storage Utilities
Version and / or Patch Used: 1.1.0
Anvil's Storage Utilities is a storage benchmark designed to measure the storage performance of SSD's. The Standard Storage Benchmark performs a series of tests; you can run a full test or just the read or write test, or you can run a single test, i.e. 4k QD16.
Scoring
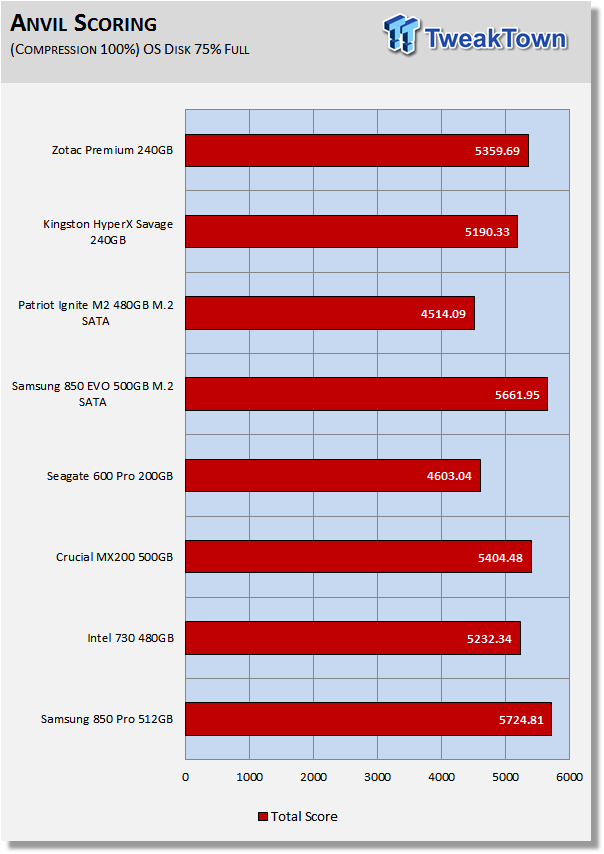
Anvil's scoring gives a good indication of a drive's overall performance. The Zotac Premium is delivering superior read performance in comparison to the HyperX Savage. What we were hoping to see is happening, over 10K 4K QD1 read performance. The Samsung's still deliver better performance, but the gap is closing.
(Anvil) Read IOPS through Queue Depth Scale
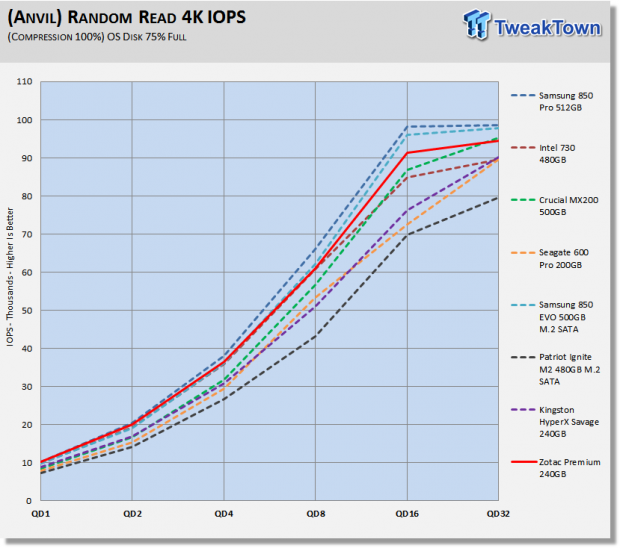
We can clearly see that the Zotac Premium has far superior read performance to the HyperX Savage. At QD1-2, the Zotac Premium is performing equivalently to the Samsung drives. This may be a minor firmware revision, but it's making a notable difference in read performance.
(Anvil) Write IOPS through Queue Scale
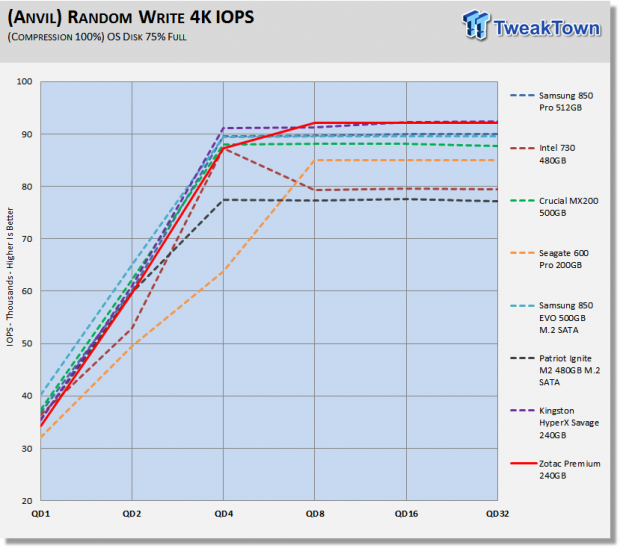
Write performance of the Zotac Premium is a little lower than the HyperX Savage. Based on this result, we believe that firmware revision on the Zotac Premium is trading a little write performance for far better read performance.
Synthetic Benchmarks - CrystalDiskMark & AS SSD
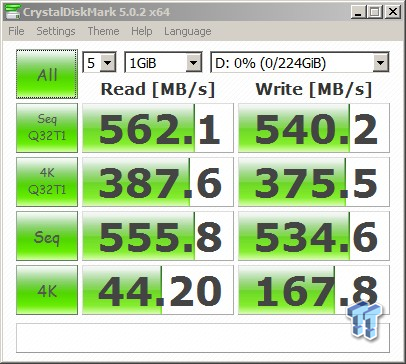
CrystalDiskMark
Version and / or Patch Used: 3.0 Technical Preview
CrystalDiskMark is disk benchmark software that allows us to benchmark 4k and 4k queue depths with accuracy. Note: Crystal Disk Mark 3.0 Technical Preview was used for these tests since it offers the ability to measure native command queuing at QD4.
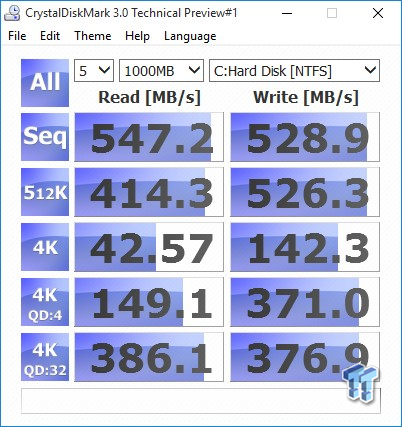
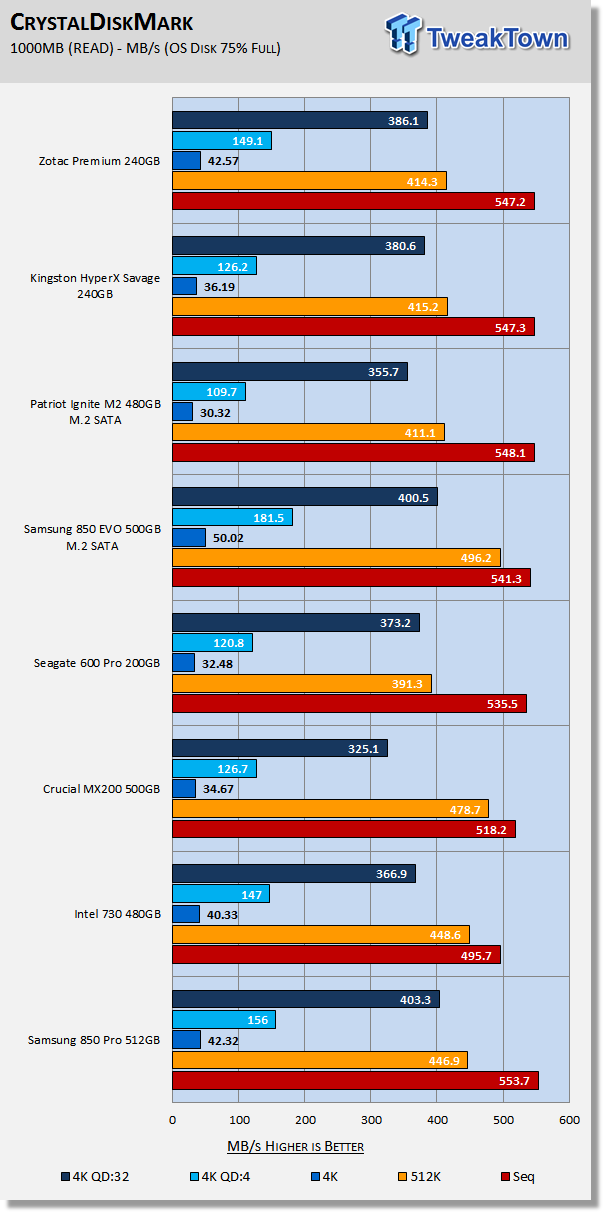
Let's focus on 4K and 4K QD4 performance. Look at how much better the Zotac drive performs than the HyperX Savage. The Zotac Premium is outperforming the 850 Pro at 4K QD1. The 850 Pro pulls ahead at QD4, but it's not by much. Zotac's Premium SSD is a very powerful SSD capable of delivering elite performance.
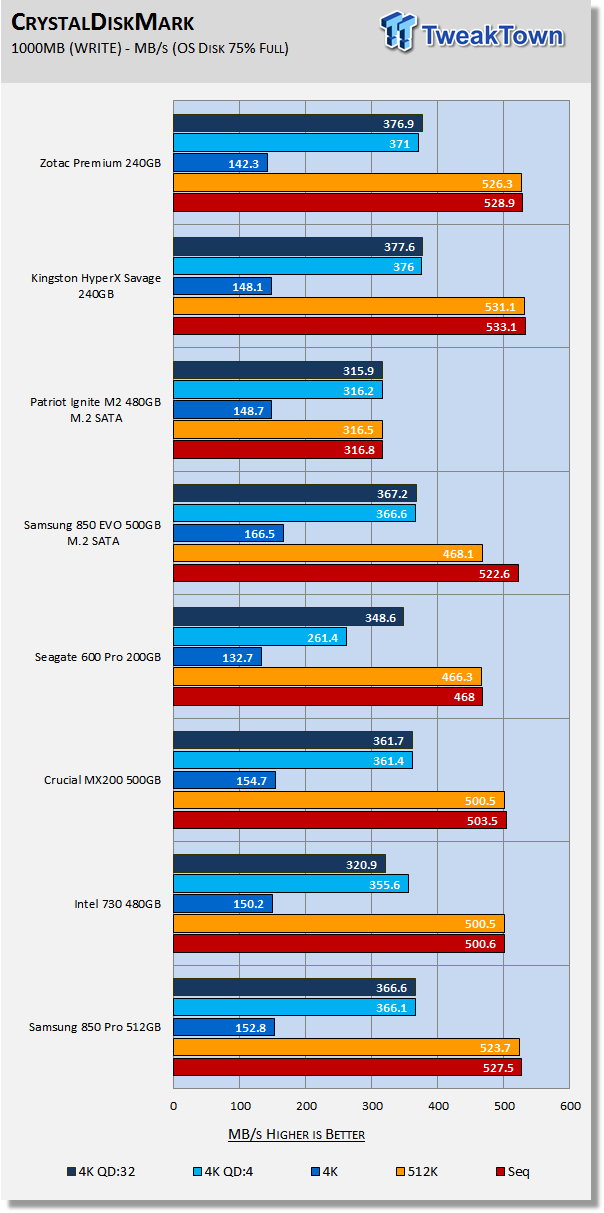
As our Anvil testing indicated, the HyperX Savage has slightly better write performance than the Zotac Premium. Both the Zotac Premium and the HyperX Savage have higher QD4 and QD32 performance than the Samsung's.
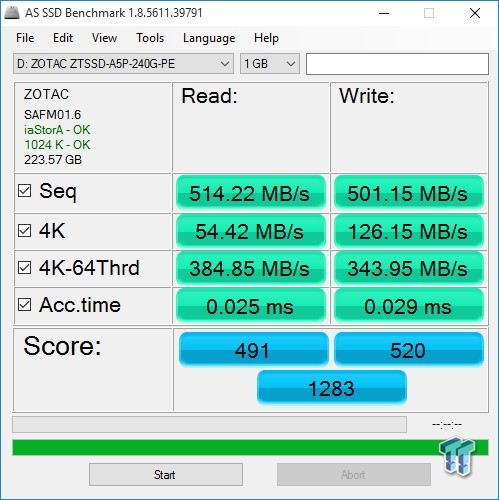
AS SSD
Version and / or Patch Used: 1.7.4739.38088
AS SSD determines the performance of Solid-State Drives (SSD). The tool contains four synthetic as well as three practice tests. The synthetic tests are to determine the sequential and random read and write performance of the SSD.

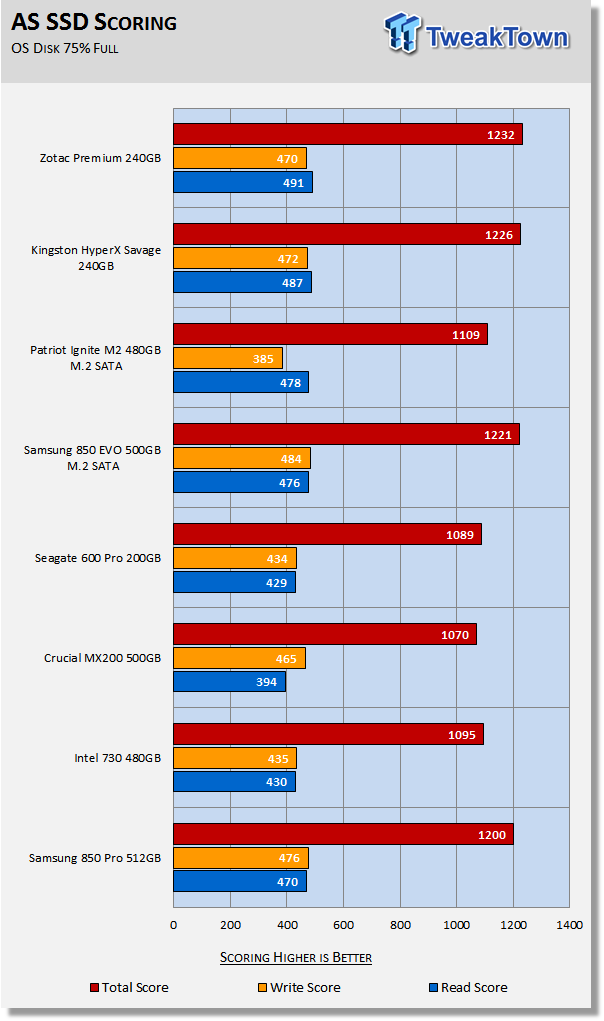
The Zotac Premium sets a new lab record for a single SATA SSD with a massive score of 1,232. Keep in mind that this is our OS Disk, and it's 75% full, which makes a big difference in scoring. An empty drive always gives a much better score as you will see later in this review.
Benchmarks (Trace Based OS Volume) - PCMark Vantage, PCMark 7 & PCMark 8
Moderate Workload Model
We categorize these tests as indicative of a moderate workload environment.
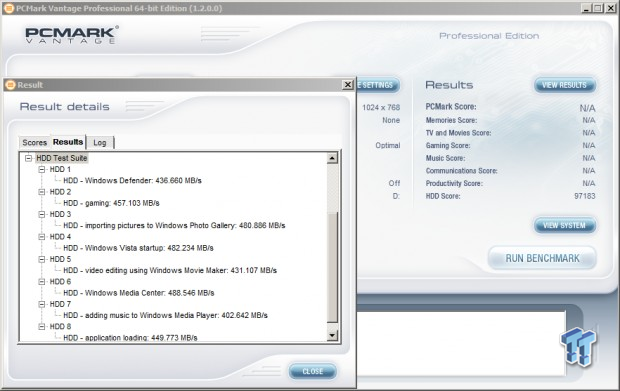
PCMark Vantage - Hard Disk Tests
Version and / or Patch Used: 1.2.0.0
The reason we like PCMark Vantage is because the recorded traces are played back without system stops. What we see is the raw performance of the drive. This allows us to see a marked difference between scoring that other trace-based benchmarks do not exhibit. An example of a marked difference in scoring on the same drive would be empty vs. filled vs. steady state.
We run Vantage three ways. The first run is with the OS drive 75% full to simulate a lightly used OS volume filled with data to an amount we feel is common for most users. The second run is with the OS volume written into a "Steady State" utilizing SNIA's guidelines. Steady state testing simulates a drives performance similar to that of a drive that been subjected to consumer workloads for extensive amounts of time. The third run is a Vantage HDD test with the test drive attached as an empty, lightly used secondary device.
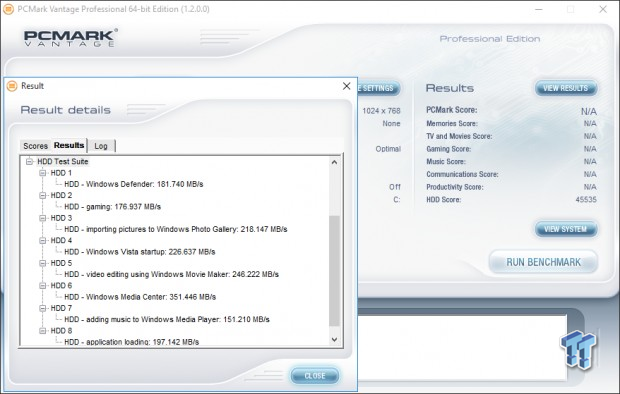
OS Volume 75% Full - Lightly Used
OS Volume 75% Full - Steady State

Secondary Volume Empty - FOB
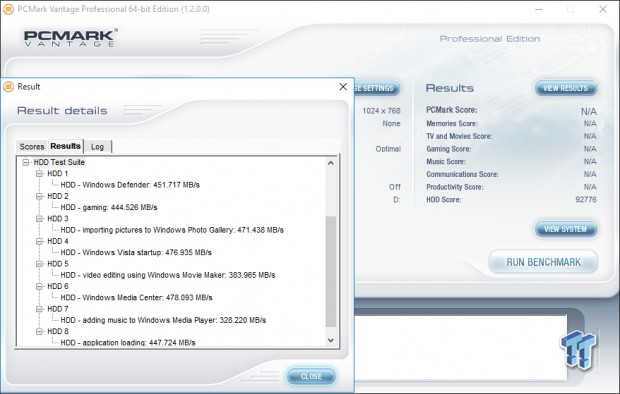
There's a big difference between an empty drive, one that's 75% full/used, and one that's in a steady state.
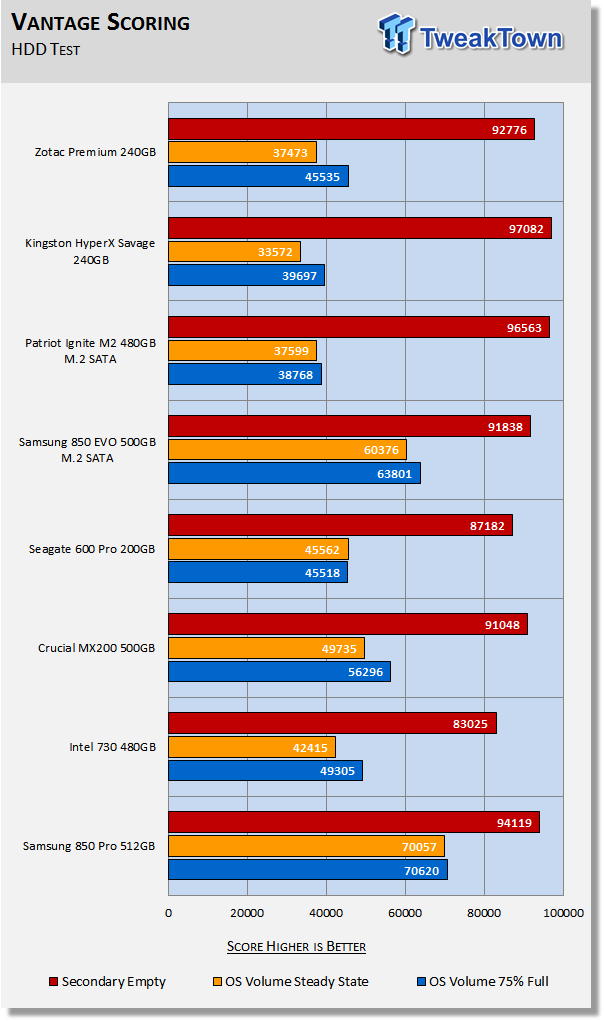
The important scores to pay attention to are "OS Volume Steady State" and "OS Volume 75% full." These two categories are most important because they are indicative of typical of consumer user states. When a drive is in a steady state, it means garbage collection is running at the same time it's reading/writing. This is exactly why we focus on steady state performance.
Moderate workload testing is where the S10 has never fared very well. We would like to see improvement in this area, and we believe we will through future firmware updates. Although the Zotac Premium gets outperformed by the non-S10 controlled drives, we can certainly see a marked improvement over the HyperX Savage.
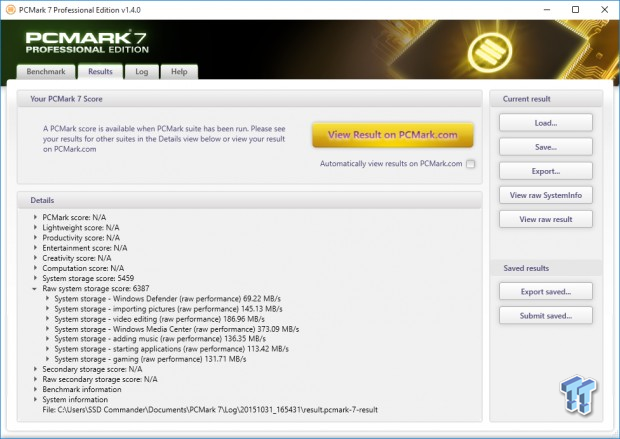
PCMark 7 - System Storage
Version and / or Patch Used: 1.4.0
We will look to Raw System Storage scoring for evaluation because it's done without system stops and, therefore, allows us to see significant scoring differences between drives.
OS Volume 75% Full - Lightly Used
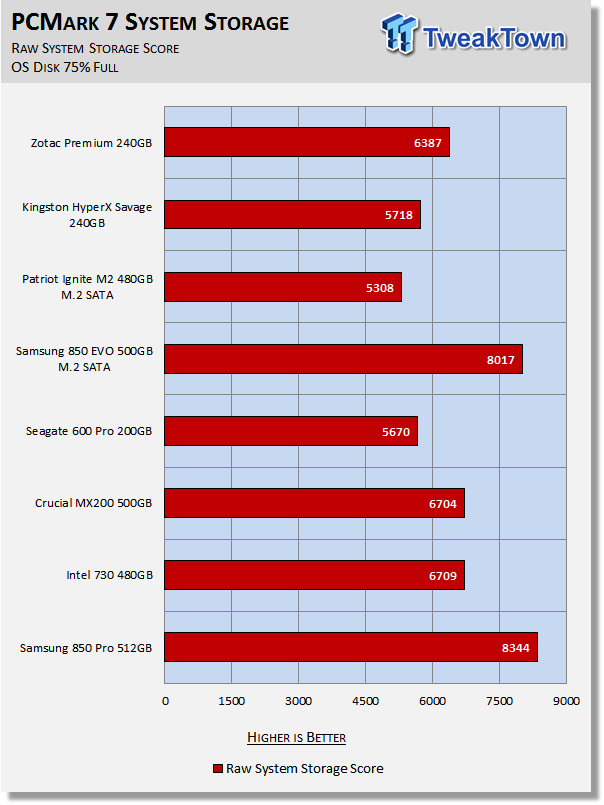
Again, not the best performance on our charts, but a nice improvement over the HyperX Savage.
PCMark 8 - Storage Bandwidth
Version and / or Patch Used: 2.4.304
We use PCMark 8 Storage benchmark to test the performance of SSDs, HDDs, and hybrid drives with traces recorded from Adobe Creative Suite, Microsoft Office, and a selection of popular games. You can test the system drive or any other recognized storage device, including local external drives. Unlike synthetic storage tests, the PCMark 8 Storage benchmark highlights real-world performance differences between storage devices.
OS Volume 75% Full - Lightly Used
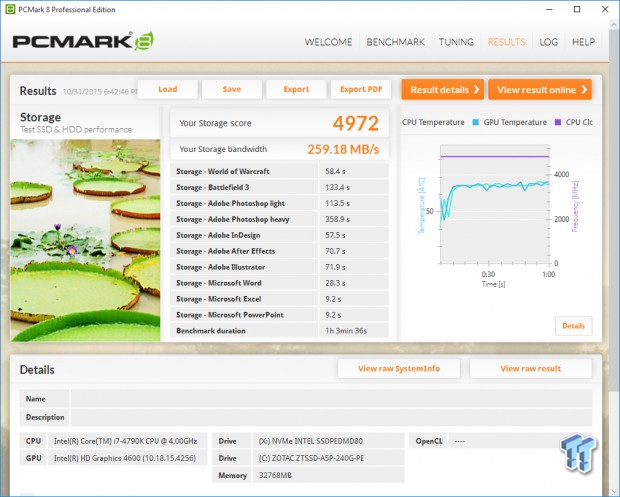
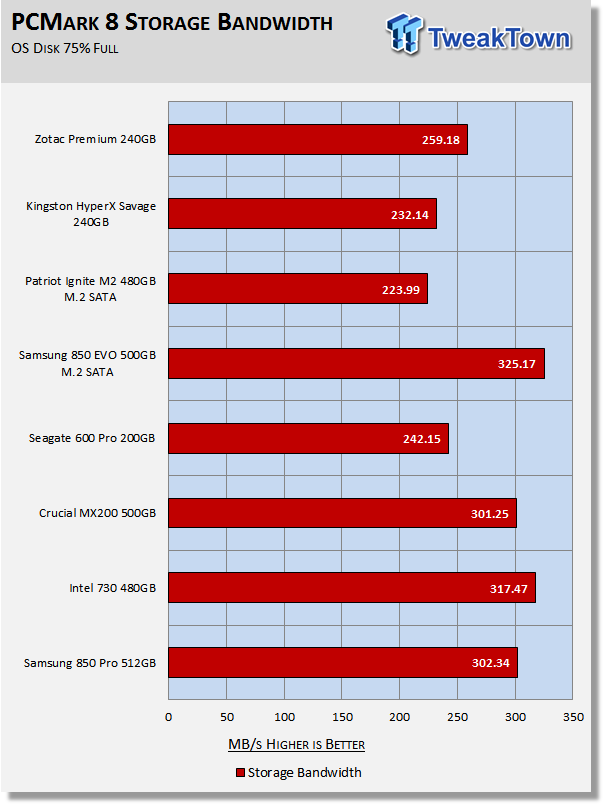
PCMark 8 is the most intensive moderate workload simulation we run. On moderate workloads, this test is what we consider the best indicator of a drive's performance. Same story here as well. The Samsung, Intel and Crucial drives all outperform the Zotac Premium, but the Zotac Premium delivers performance that is 11.6% better than the HyperX Savage, which again shows that there is a performance benefit from this minor firmware revision.
Benchmarks (Secondary Volume) - Max IOPS, Disk Response & Transfer Rates
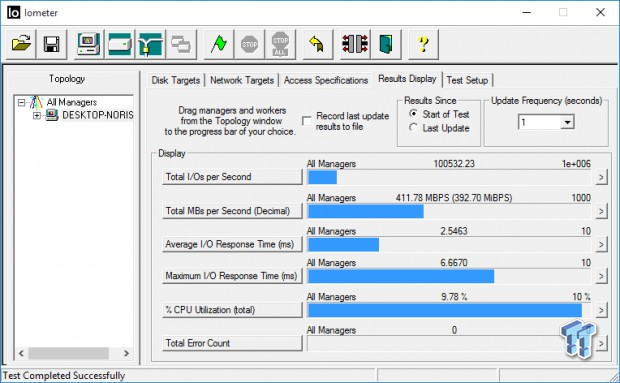
Iometer - Maximum IOPS
Version and / or Patch Used: Iometer 2014
We use Iometer to measure high queue depth performance. (No Partition)
Max IOPS Read
Max IOPS Write
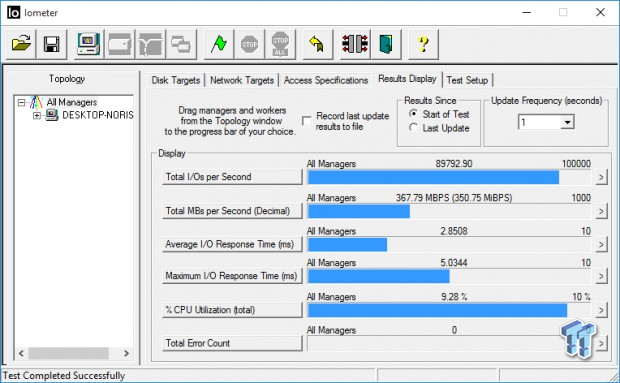
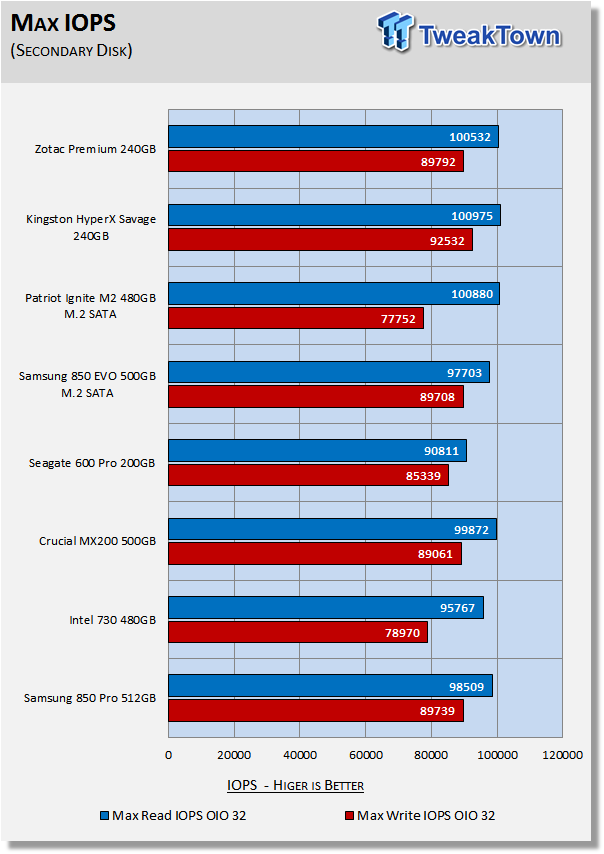
Kingston's HyperX Savage just edges out the Zotac Premium for the highest IOPS. The Zotac drive can hit higher maximum IOPS than the non-S10 drives in our test pool.
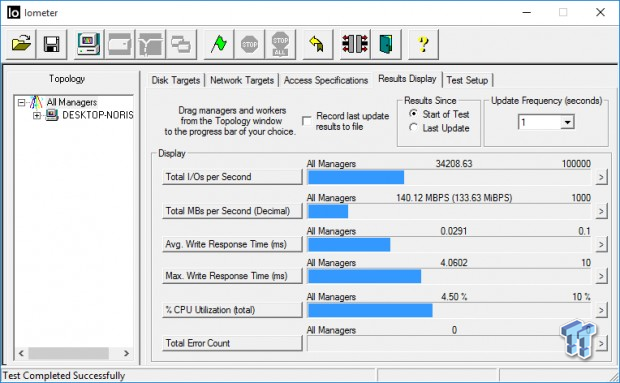
Iometer - Disk Response
Version and / or Patch Used: Iometer 2014
We use Iometer to measure disk response times. Disk response times are measured at an industry accepted standard of 4K QD1 for both write and read. Each test runs twice for 30 seconds consecutively, with a 5-second ramp-up before each test. We partition the drive/array as a secondary device for this testing.
Avg. Write Response
Avg. Read Response
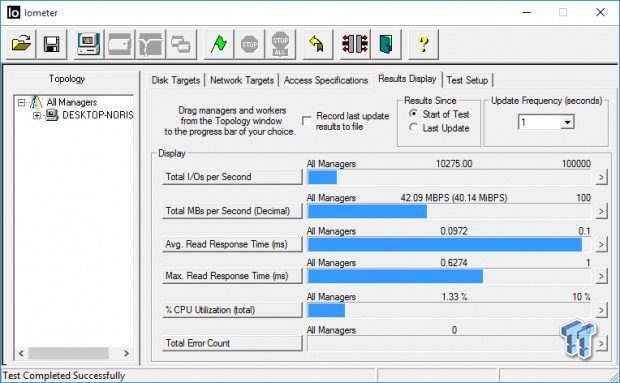
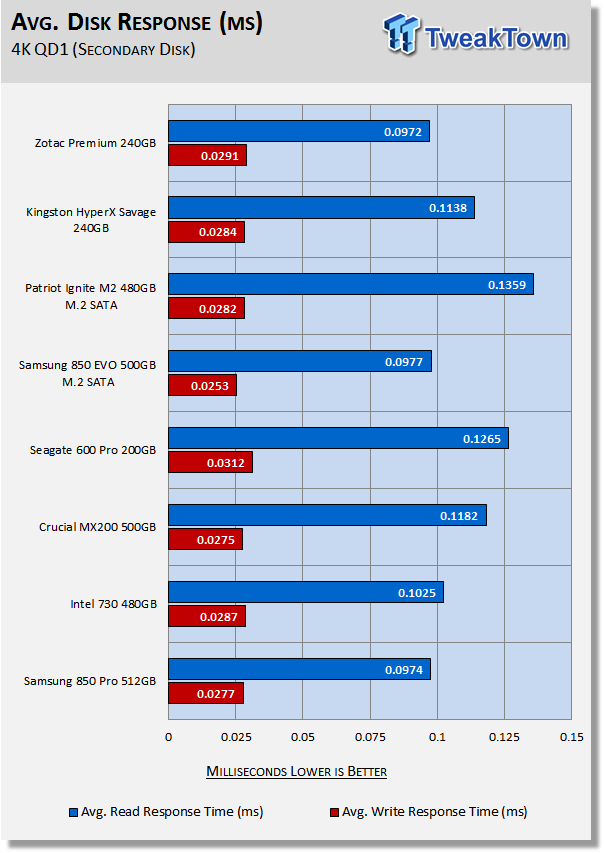
With a partition on the drives, the superior 4K QD1 read performance of the Zotac Premium is quite apparent. It's much better than the other S10 powered SSD's. The Zotac Premium sets a new lab record for lowest read response times for a SATA SSD.
DiskBench - Directory Copy
Version and / or Patch Used: 2.6.2.0
We use DiskBench to time a 28.6GB block (9,882 files in 1,247 folders) composed primarily of incompressible sequential and random data as it's transferred from our DC P3700 PCIe NVME SSD to our test drive. We then read from a 6GB zip file that's part of our 28.6GB data block to determine the test drives read transfer rate. Our system is restarted before the read test to clear any cached data, ensuring an accurate test result.
Write Transfer Rate
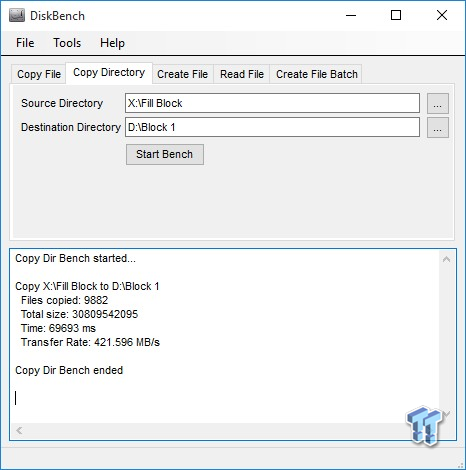
Read Transfer Rate
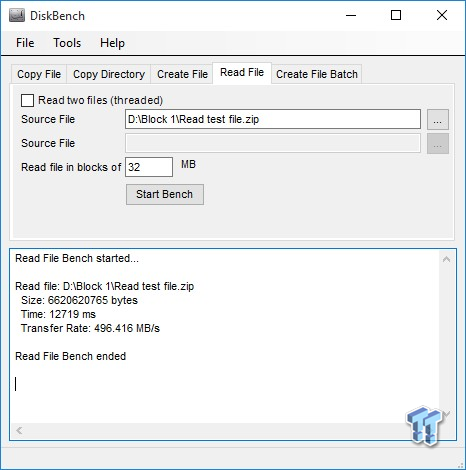
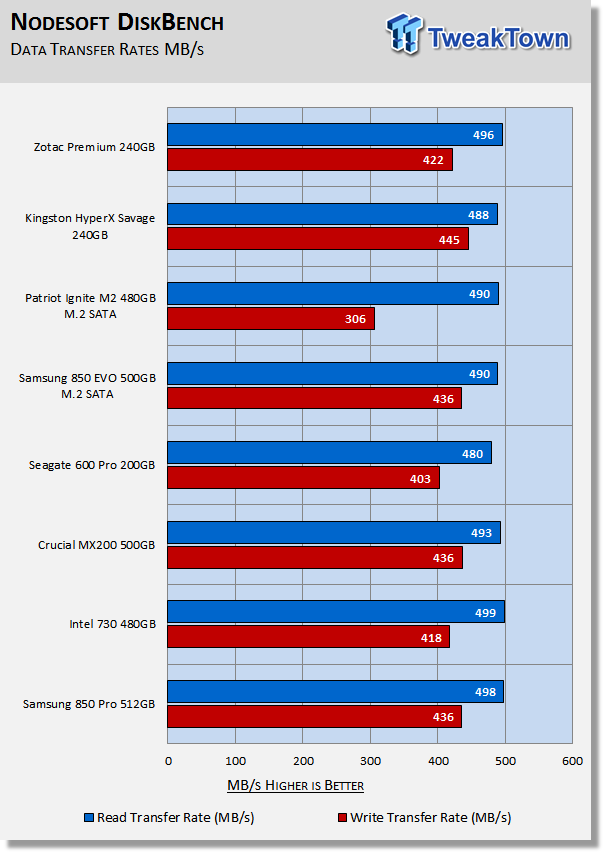
Just as we've seen throughout our testing, the Zotac Premium has better read performance than the HyperX Savage, and the HyperX Savage outperforms the Zotac Premium when writing data.
Benchmarks (Secondary Volume) - PCMark 8 Extended
Futuremark PCMark 8 Extended
Heavy Workload Model
PCMark 8's consistency test simulates an extended duration heavy workload environment. PCMark 8 has built-in, command line executed storage testing. The PCMark 8 Consistency test measures the performance consistency and the degradation tendency of a storage system.
The Storage test workloads are repeated. Between each repetition, the storage system is bombarded with a usage that causes degraded drive performance. In the first part of the test, the cycle continues until a steady degraded level of performance has been reached. (Steady State)
In the second part, the recovery of the system is tested by allowing the system to idle and measuring the performance after 5-minute long intervals. (Internal drive maintenance: Garbage Collection (GC)) The test reports the performance level at the start, the degraded steady-state, and the recovered state, as well as the number of iterations required to reach the degraded state and the recovered state.
We feel Futuremark's Consistency Test is the best test ever devised to show the true performance of solid-state storage in an extended duration heavy workload environment. This test takes on average 13 to 17 hours to complete and writes somewhere between 450GB and 14,000GB of test data depending on the drive. If you want to know what an SSD's steady state performance is going to look like during a heavy workload, this test will show you.
Here's a breakdown of Futuremark's Consistency Test:
Precondition phase:
1. Write to the drive sequentially through up to the reported capacity with random data.
2. Write the drive through a second time (to take care of overprovisioning).
Degradation phase:
1. Run writes of random size between 8*512 and 2048*512 bytes on random offsets for 10 minutes.
2. Run performance test (one pass only).
3. Repeat 1 and 2 for 8 times, and on each pass increase the duration of random writes by 5 minutes.
Steady state phase:
1. Run writes of random size between 8*512 and 2048*512 bytes on random offsets for 50 minutes.
2. Run performance test (one pass only).
3. Repeat 1 and 2 for 5 times.
Recovery phase:
1. Idle for 5 minutes.
2. Run performance test (one pass only).
3. Repeat 1 and 2 for 5 times.
Storage Bandwidth
PCMark 8's Consistency test provides a ton of data output that we use to judge a drive's performance.
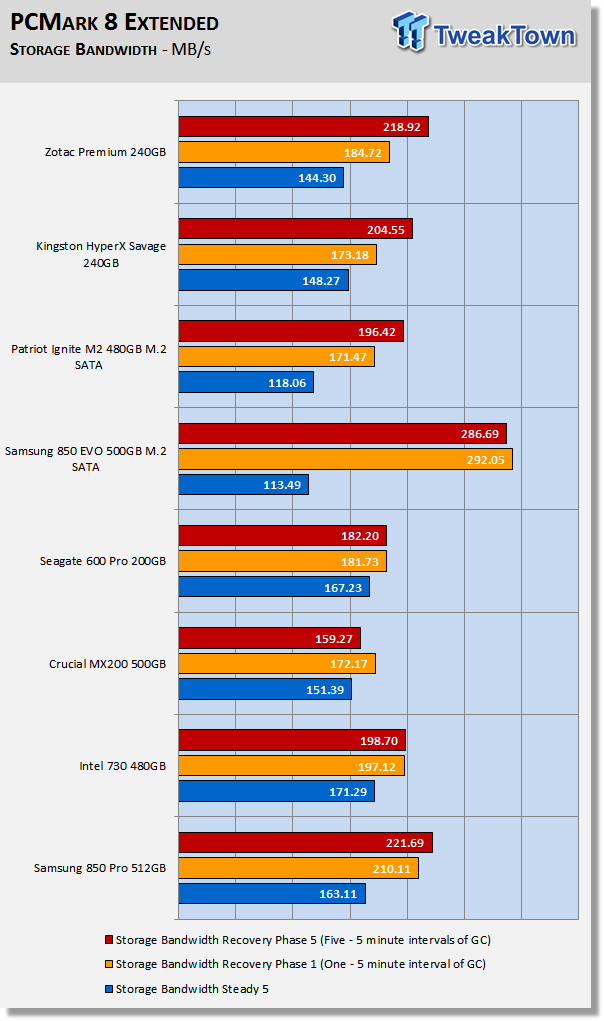
We consider steady state bandwidth (the blue bar) our test that carries the most weight in ranking a drive/arrays heavy workload performance. Performance after Garbage Collection (GC) (the orange and red bars) is what we consider the second most important consideration when ranking a drives performance. Trace-based steady state testing is where true high performing SSDs are separated from the rest of the pack.
S10 powered SSDs perform better with heavy workloads than they do with moderate workloads. We would categorize this test as a write centric test. Drives with the best sustained random write performance tend to outperform others in a steady state, which is why the 850 EVO performs so poorly in a steady state. This is also the reason the HyperX Savage outperforms the Zotac Premium in a steady state. After one five minute recovery interval, the Zotac Premium is able to outperform the HyperX Savage. After five 5 minute recovery intervals, the Zotac Premium outperforms the rest of the drives in our test pool with the exception of the 850 EVO and Pro.
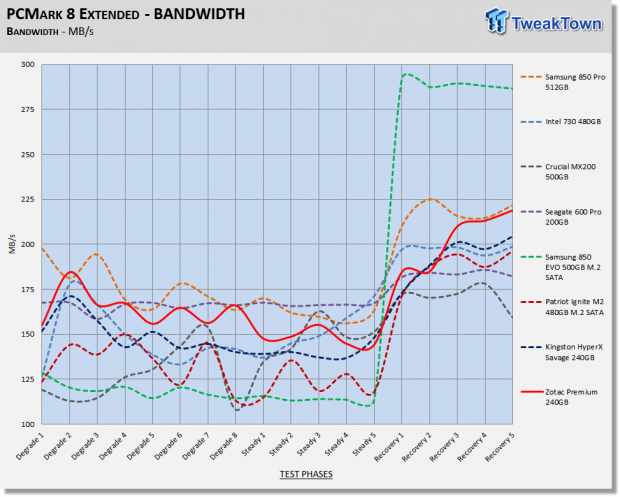
We chart our test subject's storage bandwidth as reported at each of the test's 18 trace iterations. This gives us a good visual perspective of how our test subjects perform as testing progresses. For a majority of the tests, the Zotac Premium outperforms the drives on our chart except for the 850 Pro and Seagate's 600 Pro enterprise SSD.
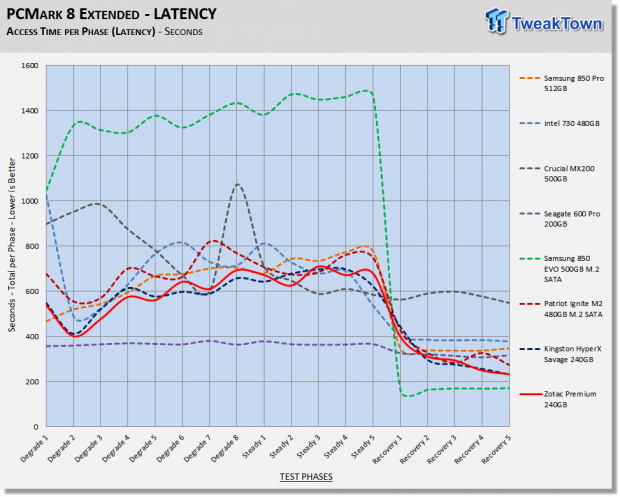
Total Access Time (Latency)
We chart the total time the disk is accessed as reported at each of the test's 18 trace iterations.
Disk Busy Time
Disk Busy Time is how long the disk is busy working. We chart the total time the disk is working as reported at each of the tests 18 trace iterations.
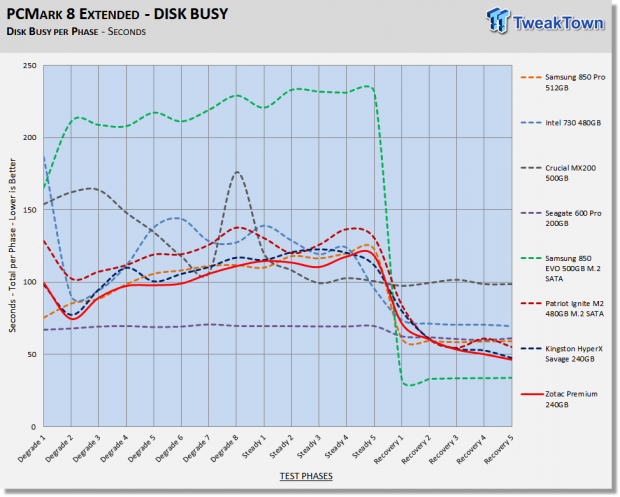
When latency is low, disk busy time is low as well.
Data Written
We measure the total amount of random data that our test drive/array is capable of writing during the degradation phases of the consistency test. Pre-conditioning data is not included in the total. The total combined time that degradation data is written to the drive/array is 470 minutes. This can be very telling. The better a drive/array can process a continuous stream of random data, the more data will be written.
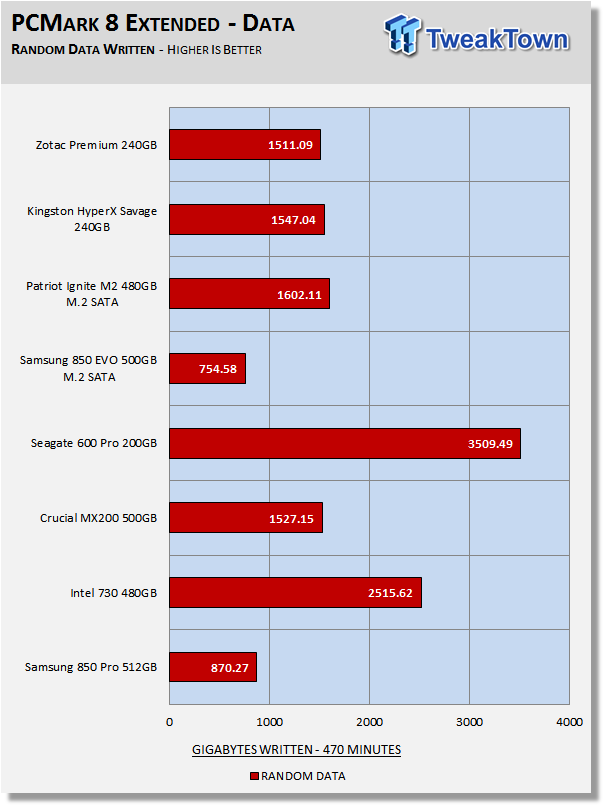
Combined read/write latency, capacity and overprovisioning are the biggest factors that determine the outcome of this portion of the test. The Zotac Premium has lower latency across this test than the 850 Pro and EVO which is the reason it can write much more random data in the same amount of time. The HyperX Savage just edges the Zotac Premium because it has slightly lower write latency. The Ignite is benefiting from capacity in this instance, and that is the only reason it can write more data than the HyperX Savage and the Zotac Premium. The Seagate 600 Pro has much lower latency across the test, and as such can write far more data.
Benchmarks (Secondary Volume) - 70/30 Mixed Workload
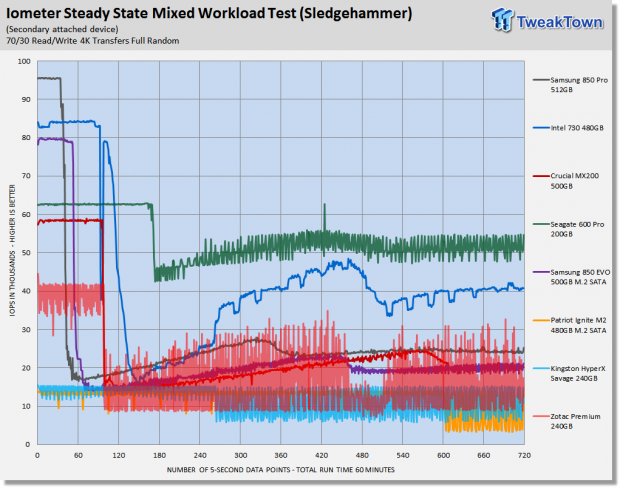
70/30 Mixed Workload Test (Sledgehammer)
Version and / or Patch Used: Iometer 2014
Heavy Workload Model
This test hammers a drive so hard we've dubbed it "Sledgehammer". Our 70/30 Mixed Workload test is designed to simulate a heavy-duty enthusiast/workstation steady-state environment. We feel that a mix of 70% read/30% write, full random 4K transfers best represents this type of user environment. Our test allows us to see the drive enter into and reach a steady state as the test progresses.
Phase one of the test preconditions the drive for 1 hour with 128K sequential writes. Phase two of the test runs a 70% read/30% write, full random 4K transfer workload on the drive for 1 hour. We log and chart (phase two) IOPS data at 5-second intervals for 1 hour (720 data points). 60 data points = 5 minutes.
What we like about this test is that it reflects reality. Everything lines up, as it should. Consumer drives don't outperform Enterprise-Class SSD's that were designed for enterprise workloads. Consumer drives based on old technology are not outperforming modern Performance-Class SSD's, etc.
This test is read centric, and the superior read performance of the Zotac drive shows in comparison to the HyperX Savage. The Zotac Premium displays more performance variability than the HyperX Savage, but overall much better performance. The S10 powered drives are all outperformed by the rest of the drives in our test pool.
Maxed-Out Performance (MOP)
This testing is just to see what the drive is capable of in an FOB (Fresh Out of Box) state under optimal conditions. We are utilizing Windows Server 2008 R2 64-bit for this testing. Same Hardware, just an OS change.
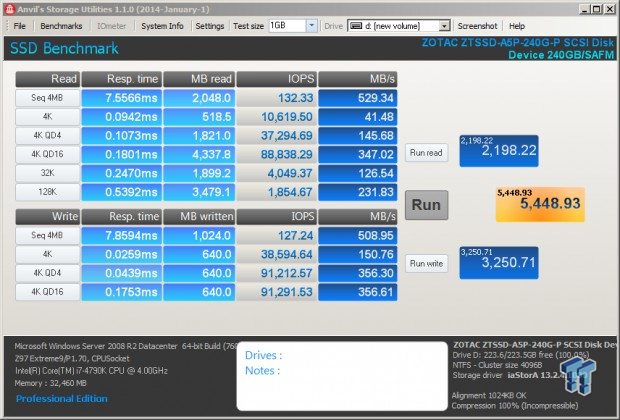
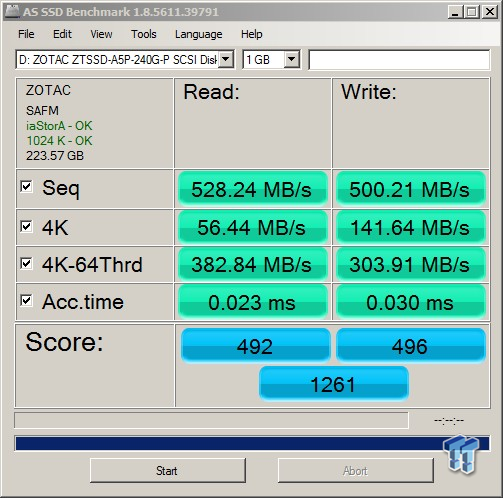
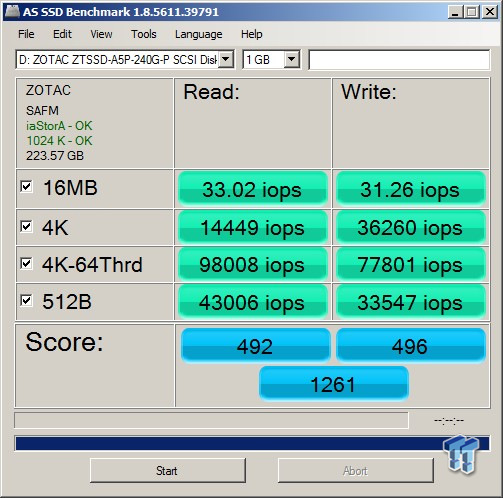
The S10 loves AS SSD. 4K QD1 Read of 14.4K IOPS is the same as we are getting from a 950 Pro NVMe SSD.
We decided to run a quick empty Win 10 AS SSD because we knew it would score even higher.
A higher score for Windows 10 over Server 2008 will only happen with AS SSD because of higher 64 Thread write performance. We wanted to show this score because it's the highest score we've seen for a single SATA SSD.
A 97,000 plus score is about as high as it gets for a SATA SSD.
Final Thoughts
The Zotac Premium SSD is one of the few drives that can compete with the 850 EVO. Not so much from the standpoint of all-around performance, but definitely from a pricing perspective. As of late we've seen a lot of drives that are vastly inferior to the 850 EVO priced the same or even higher than the EVO. This is not the case with Zotac's Premium SSD. Zotac's drive is priced lower than the 850 EVO and at the same time, isn't too far behind in overall performance.
In our opinion, this makes the Zotac Premium SSD an excellent choice, preferable to both the HyperX Savage and the Corsair Neutron XT. The Zotac Premium SSD outperforms both the Neutron XT and the HyperX Savage and does so with far better pricing.
We feel that the Zotac Premium SSD is an ideal low-cost, high-performance drive for gamers where sequential performance is king. Zotac is a big name in video cards, and now making a splash with their new lineup of SSDs. What better than a Zotac SSD to compliment your Zotac video card?
Zotac's Premium SSD delivers an excellent SSD experience, end to end data path protection, 4K QD1 read performance of 10K IOPS, and second to none sequential performance. Zotac's first SSD is TweakTown recommended.
Pros:
- Best Performing S10 Powered SSD to Date
- 10K IOPS 4K Read
- Excellent Price Point
- Quality MLC Flash
Cons:
- No accessories
- Low Moderate Workload Performance
 ASUSTOR Lockerstor 2 Gen2+ AS6702T v2 NAS Review - Fast Performance
 TERRAMASTER D1 SSD Pro Thunderbolt/USB Portable Enclosure Review - Incredible Potential
 Orico K20 Mini 2TB Magnetic Portable SSD Review - Ultra-Thin MagSafe Drive
 TERRAMASTER D4 SSD 4-Bay NVMe DAS Enclosure Review - Superior Portable DAS
 Micron 3610 2TB SSD Review - DRAMless QLC at 11,000 MB/s
 YouTube is making its AI Deepfake detection tool available to all creators over the age of 18
 You can finally change the size and position of the taskbar in Windows 11
 Arc Raiders hits 16 million sales, helps drive record revenue and profits for Nexon
 PC beats console as Capcom's top sales platform for the past three years in a row
 Intel Panther Lake R spotted in a Linux patch, intended for 'harsh environments'
 Intel Core i9-14900KF breaches 9.2 GHz, breaking the previous CPU frequency world record
 ASUS ROG NUC 16 is a $4,500 gaming mini PC smaller than a PS5 with an RTX 5080 and Intel Core Ultra 9
 Capcom sets new profit records for 9th consecutive year thanks to winning strategy
 ASUS celebrates 20 years of ROG with the Crosshair 2006, a retro-styled X870E motherboard
 PS5 is getting Steam Charts-style weekly player counts, giving console gamers what PC players have had for years
 PCCooler CPS RZ620M X CPU Cooler Review
 Memblaze PBlaze 7 7A40 Ocean 61.44TB Enterprise SSD Review - Oceans of QLC at 3.3 million IOPS
 MOZA SGP Sequential Sim Racing Shifter Review
 COLORFUL iGame GeForce RTX 5070 Ultra OC Review - When Style and Performance Meet
 GIGABYTE Z890 AORUS Elite WiFi7 Plus Motherboard Review - Right in the sweet spot
 PNY GeForce RTX 5080 Slim OC Review - A Compact 4K Powerhouse
 HP OmniBook 7 (Panther Lake) 16" Laptop Review
 ASUS ROG Strix X870E-E Gaming WiFi7 NEO - A Crosshair by any other name
 Cooler Master Cosmos Alpha Full-Tower Chassis Review
 Thrustmaster T598 Direct Axial Drive Force Feedback Racing Wheel Bundle Review
 The Snipping Tool quietly became the only screenshot app I keep installed on Windows 11
 How to Set Up a Windows Computer for a Senior User
 Bluetooth Toggle Missing in Windows? Try These Fixes
 GPU Overclocking Basics in Windows 11: Safe Performance Gains Without the Guesswork
 GIGABYTE's new Ultimate OLED Gaming Monitor Bundle includes Xbox Game Pass
 I automated 5 annoying Windows maintenance tasks, and my PC basically runs itself
 How to Fix Windows 11 Black Screen on Boot or After Login
 The first 8 settings I disable on every fresh Windows 11 install in 2026
 Is Your Ethernet Performance Slower Than Wi-Fi? Here's How to Fix It
 MSI's Project Zero Delivers a Stunning Cable-Free Look to More Gamers