


Our Verdict
Introduction & Specifications, Pricing, and Availability
This past June, Samsung introduced the world to the first consumer 3D 2-bit cell structure NAND flash memory. The new flash was released to the market in the Samsung 850 Pro, a high-end consumer / prosumer SSD designed for long product life, and industry leading performance. Today, Samsung is following the flagship 850 Pro with a mainstream variant that uses 3-bit per cell 3D NAND.
The new 850 EVO model is designed to address some of the shortcomings in the company's popular 840 EVO product line, while still offering consumers excellent value at all capacity points. While the 840 EVO products were certainly not slow, more demanding users found the sustained write performance (the performance after filling the SLC buffer) lower than expected. The 850 EVO increases the throughput performance, post SLC buffer.
Specifications, Pricing, and Availability
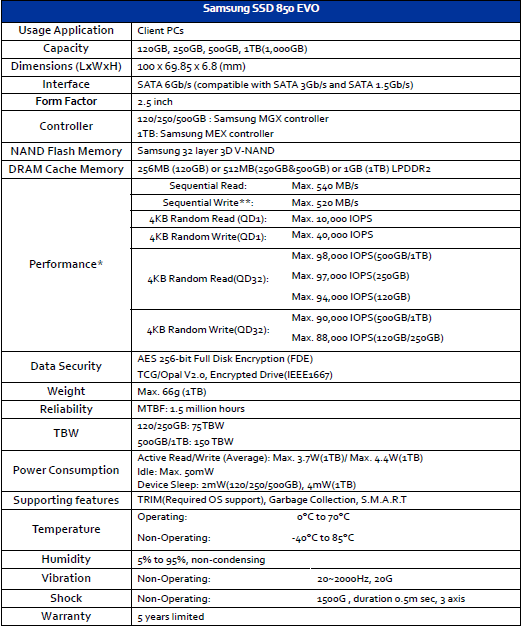
The Samsung 850 EVO ships in four capacities, 120GB, 250GB, 500GB, and a large 1TB model. Many expected, or at the very least hoped, that Samsung would take this series up to 2TB, but that didn't play out in this round. The largest capacity 850 EVO still uses the Samsung MEX controller - the same controller used on the 840 EVO, and the 850 Pro. The 120GB, 250GB, and 500GB 850 EVO products ship with a new controller that Samsung calls MGX.
In this review, we'll mainly focus on the 850 EVO 1TB model. Later today, we'll publish a review of the Samsung 850 EVO 250GB as well. The 1TB model has a sequential read speed of up to 540 MB/s, and a sequential write speed of up to 520 MB/s. We'll talk about the difference between Turbo Write (SLC), and 3-bit (TLC) write speeds in the next paragraph. The 4K random read performance tops 98K IOPS on both the 500GB and 1TB models. The 4K random write performance is a blistering 90K IOPS.
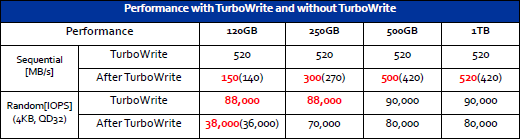
Samsung's TurboWrite technology adds a SLC buffer layer to the flash. This takes place in the flash translation layer, which is a map of where data is stored on the SSD. The FTL can allocate data, telling a TLC cell to hold only 1-bit instead of three to increase the write transaction speed. Writing 1-bit is faster than writing three. The performance difference comes into play once all of the designated SLC-like area is full. At that point, the data needs to write to the drive in TLC mode, which is slower than SLC mode. The 850 EVO 1TB model writes sequential data at 520 MB/s in SLC mode, and 420 MB/s in TLC mode. It should be noted that this is the fastest write speed we've ever come across in TLC mode.
The 1TB model doesn't show a difference in random write performance. The random reads are 90K IOPS, and the random writes are 80K IOPS.
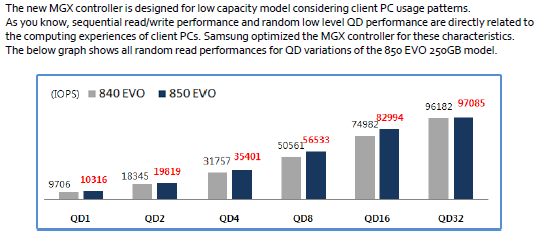
The Samsung media guide for the 850 EVO shows us that Samsung is in line with our testing and evaluative thoughts on what makes a good consumer SSD. Samsung isn't afraid to publish low queue depth random performance, even though the market still likes to highlight high queue depth performance. The new MGX controller found on the 120GB, 250GB, and 500GB models is designed to deliver performance where most mainstream users need it, sequential and low queue depth random workloads.
Our Latest SSD Review Coverage
- Samsung 990 2TB SSD Review - Ninth Gen QLC at PCIe Gen4 Speeds
- Phison E37T SSD Controller Exclusive Preview - The Fastest DRAMless SSD Platform Yet
- Seagate FireCuda X1070 4TB SSD Review - A New Mainstream Contender
- Micron 3610 2TB SSD Review - DRAMless QLC at 11,000 MB/s
- SK hynix Platinum P51 2TB SSD Review - A Powerful Gen5 Alternative
All 850 EVO capacities support AES 256-bit full disk encryption, and work with eDrive, Waves, and other SED software suites. The 850 EVO also supports DEVSLP, a technology that lowers power consumption when the drive is idle, and increases notebook battery life. RAPID Mode also gets an update, and Samsung tells us to look for a near 2x performance increase in Windows start up, and application loading. Magician will update to version 4.5. You can see an overview of Magician 4.4 here. Samsung also includes Data Migration software that allows users to clone an existing drive to a Samsung SSD easily and quickly.
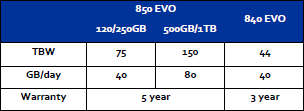
The 850 EVO 500GB and 1TB models match the endurance ratings of the 850 Pro. When we wrote about the Samsung 850 Pro a few months ago, we speculated that even though the 850 Pro had the industry's highest TBW rating for a consumer SSD, the rating was conservative. With the 3-bit per cell 850 EVO 500GB and 1TB models claiming the same 150 TBW rating, we can look back and say we were correct with that assumption. The high endurance allows Samsung to include a full five-year warranty with the new 850 EVO; Samsung's five-year warranty is higher than any other company's warranty on a mainstream SSD.
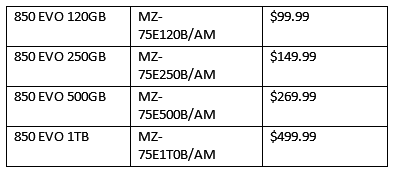
Prior to Black Friday, Fry's Electronics (a brick and mortar store in the U.S.) had a presale for 850 EVO 500GB models. We were never told if this was an error or not, but the 500GB model price was set to $499. At that price, we were very concerned since the 850 Pro 512GB sells well shy of $499. Just prior to launch, Samsung sent over the 850 EVO MSRP model, and it looks even better than we expected. The 1TB drive we will test in this review will sell for just $499.99 at launch. That price is comparable with value class drives offering less performance, less endurance, and a shorter warranty than the 850 EVO.
Samsung 850 EVO 1TB SSD
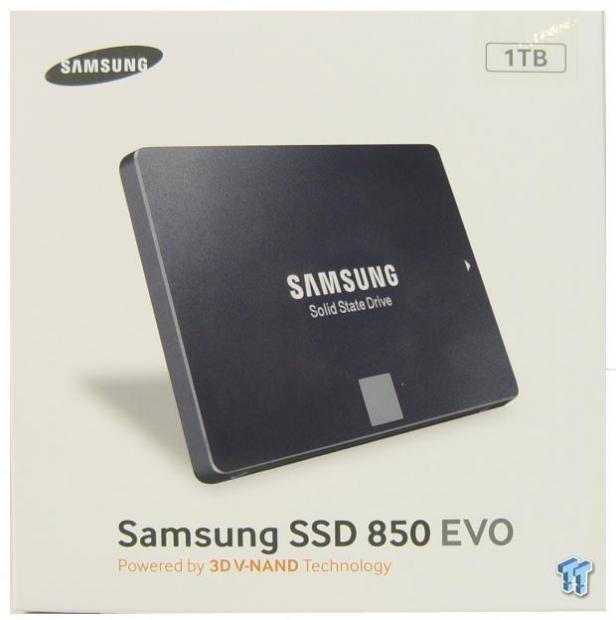
Samsung abandoned the black packaging with the 850 EVO. The minimal retail package design keeps it simple on the front, but does highlight the 3D V-NAND technology.
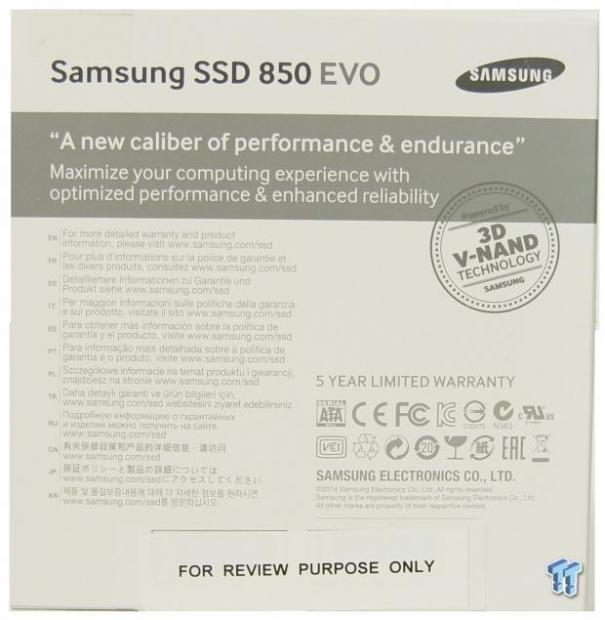
The rear of the retail package gives us some basic information about the 850 EVO, shows the five-year warranty, and has a massive list of regulatory symbols.
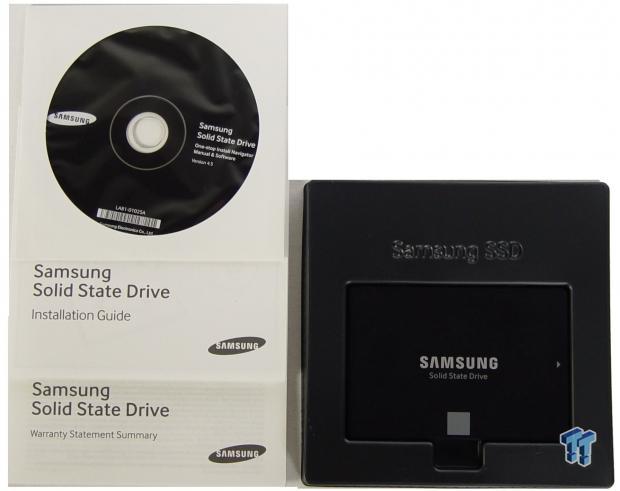
Inside of the package, we found the 850 EVO SSD, a software disk with Magician and Data Migration, and two paper manuals.
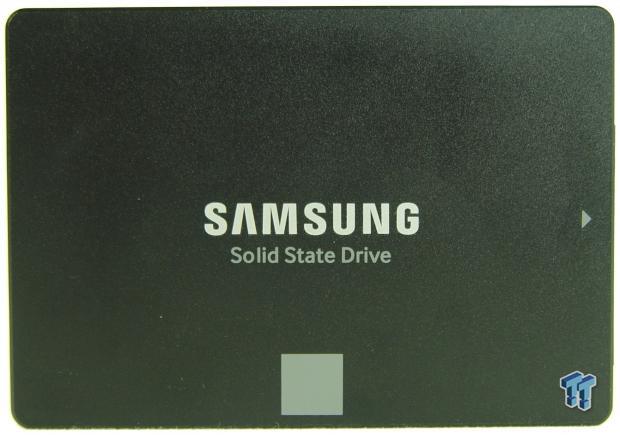
This is the first Samsung SSD to abandon the red / orange square at the bottom of the drive. This image almost looks like a black and white picture, but it's not.
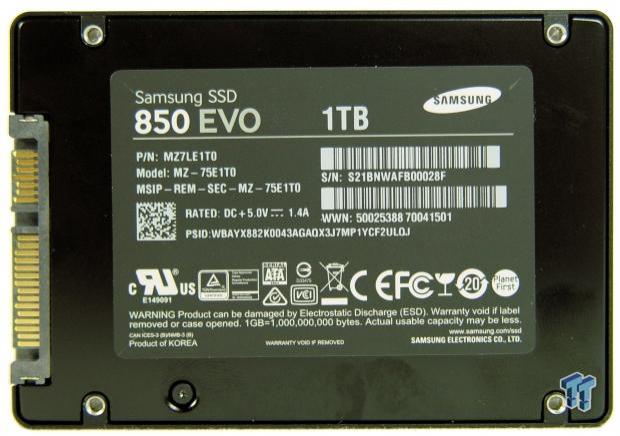
The back of the drive gives us the model number, serial number, and PSID for encryption.
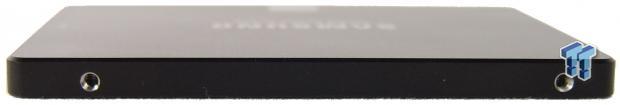
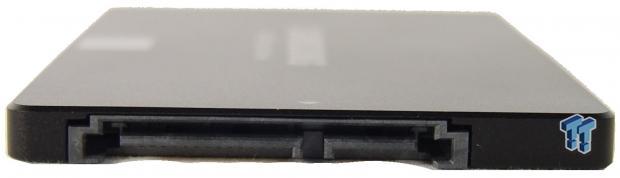
The 850 EVO uses a 7mm case design, so it will work in notebooks that require the smaller z-height.
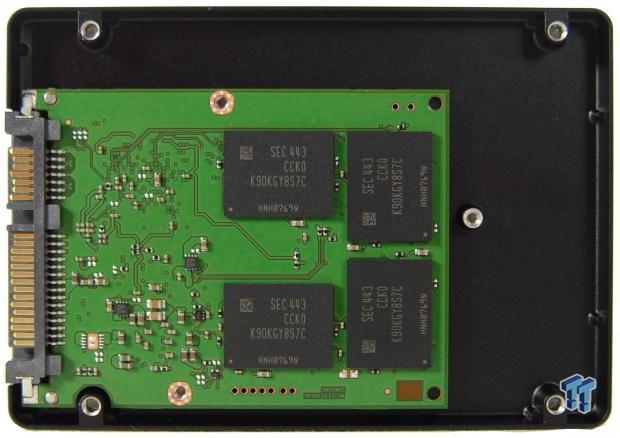
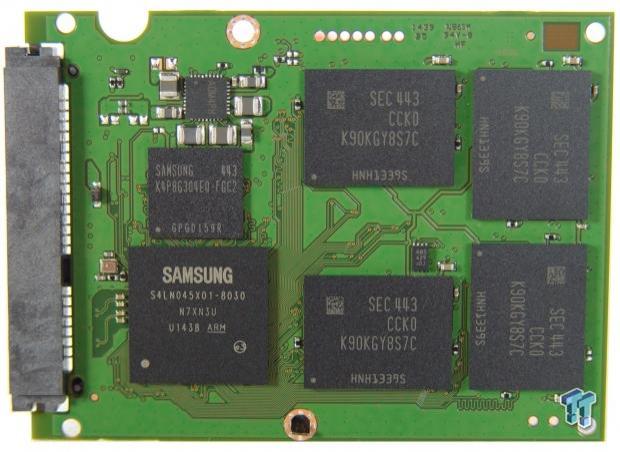
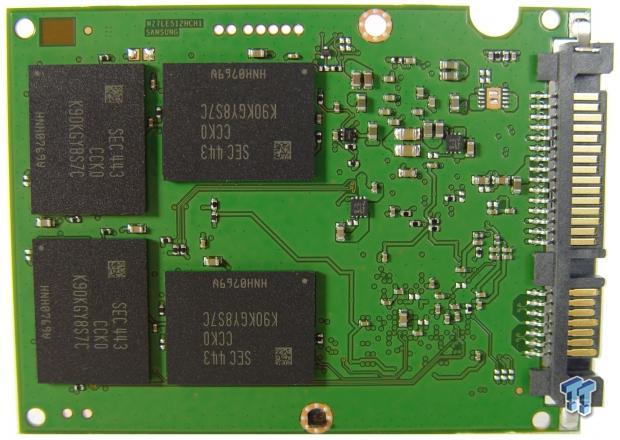
Inside, we found a small PCB with eight NAND flash packages, a controller, and DRAM package. All of the major components are designed and built by Samsung.
The low amount of components needed for the 850 EVO almost amazes me.
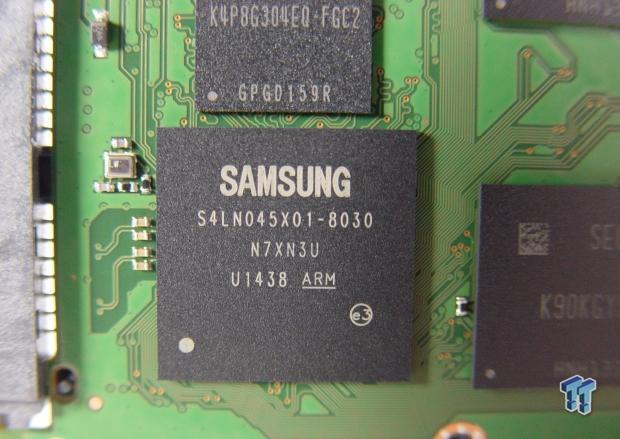
The Samsung MEX controller used on the 1TB 850 EVO was also used on the 850 Pro, and 840 EVO products. This is an eight-channel design that is very powerful, but consumes very little power.
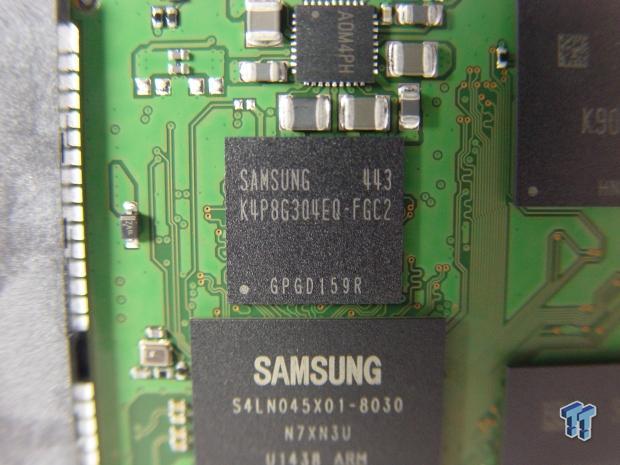
The 850 EVO only has one DRAM package to buffer data.
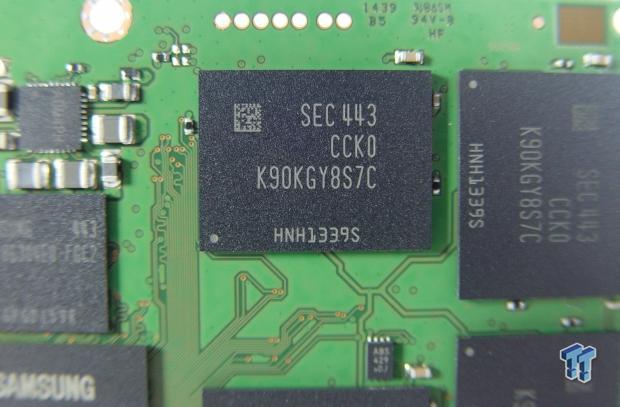
This is our first look at Samsung's new 32-layer, 3-bit per cell 3D V-NAND.
Test System Setup and Initial Performance
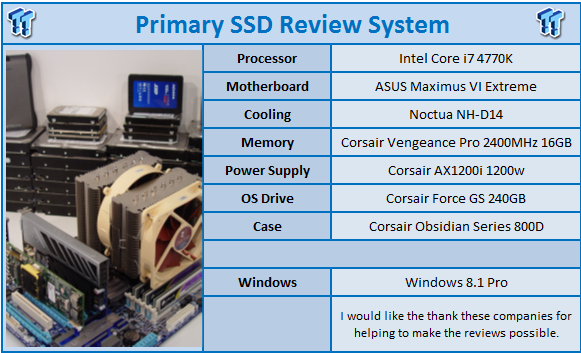
Desktop Test System
Lenovo T440 - Notebook Power Testing with DEVSLP and Windows 8.1 Pro
Nearly all of the performance tests run on the desktop system, but we use a Lenovo T440 to run the power tests. The T440 is the latest addition to our client SSD test lab, and allows us to test the notebook battery life offered by a SSD with advanced features like DEVSLP enabled.
Initial Performance Evaluation - 4-Corner, and then Some Tests
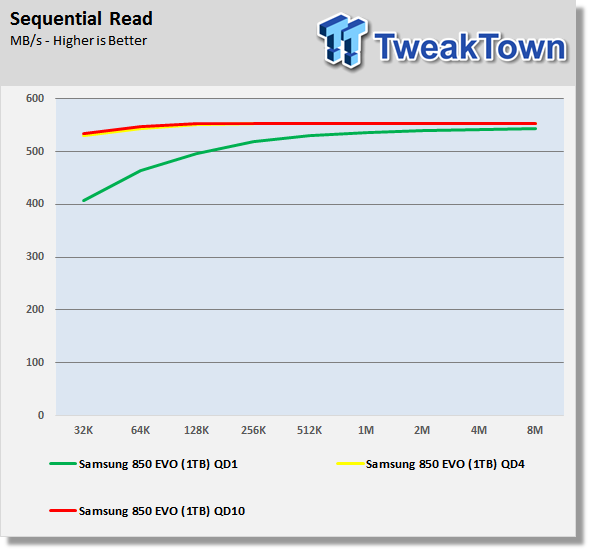
Sequential Read
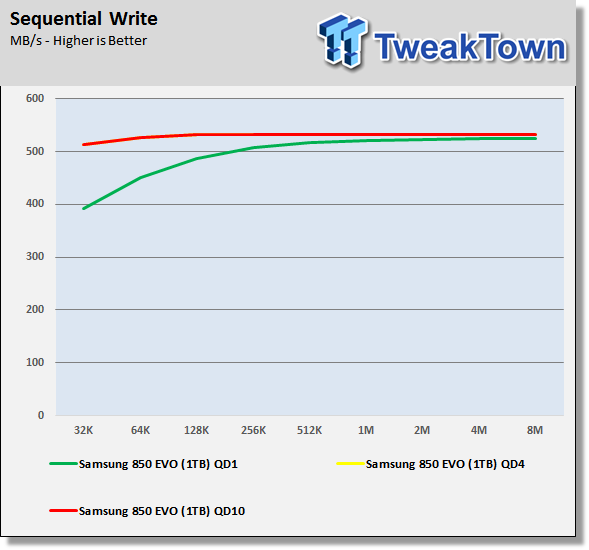
Sequential Write
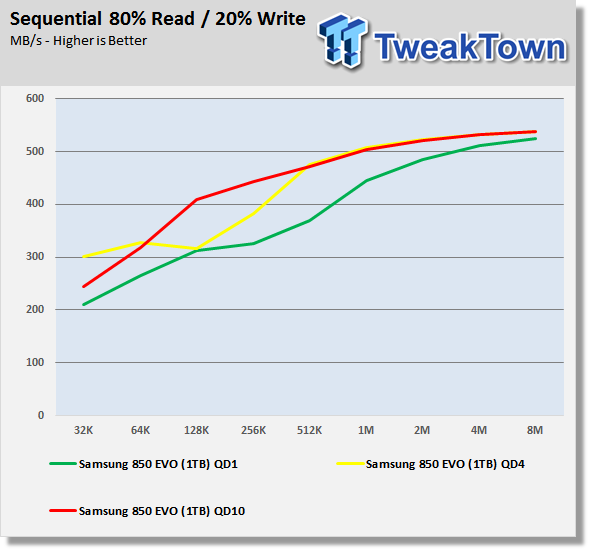
Sequential 80% Read 20% Write
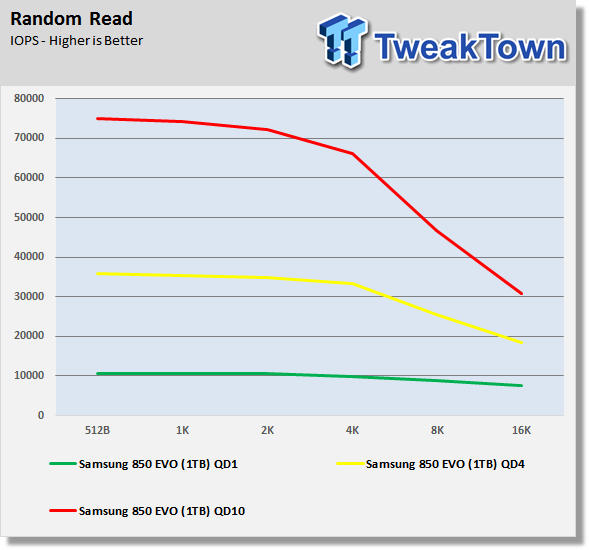
Random Read
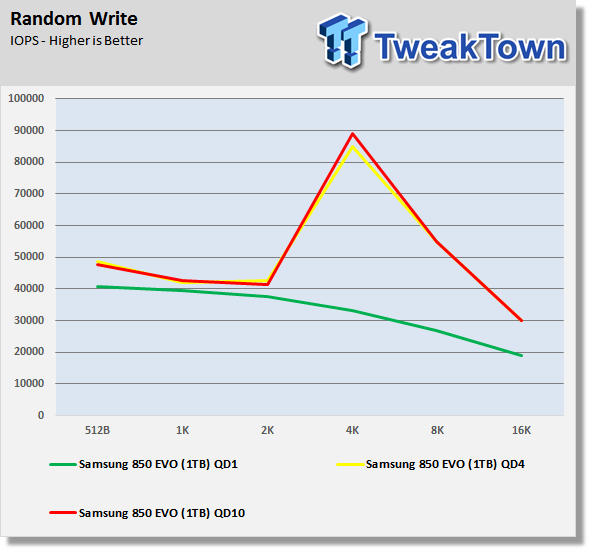
Random Write
Random 80% Read 20% Write
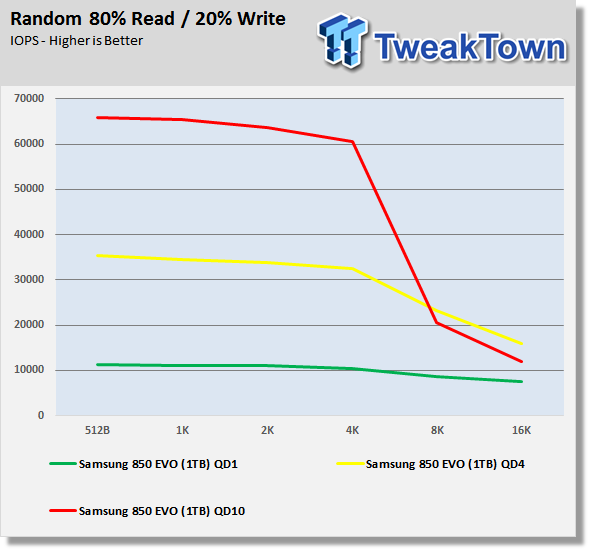
Our new replacement for ATTO shows us 4-corner performance, and some mixed workload results as well. We run the test long enough, and in a particular order to get a reasonable level of consumer preconditioning on the drive. In the tests, we show QD1 (green), QD4 (yellow), and QD10 (red). The stop light colors are present for a reason.
Benchmarks - Sequential Performance
HD Tune Pro - Sequential Performance
Version and / or Patch Used: 5.50
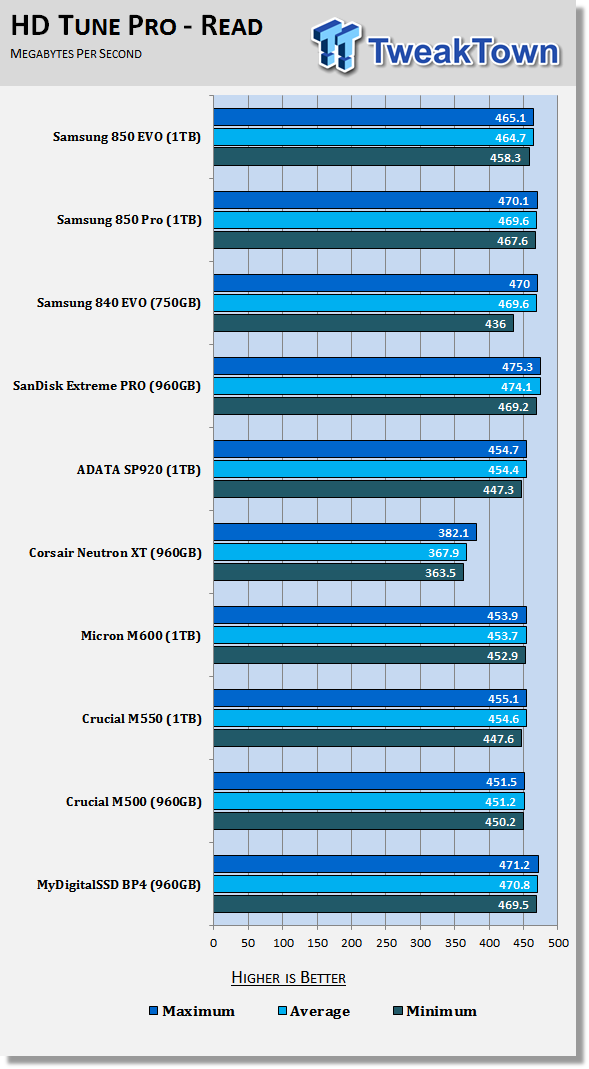
After measuring sequential read performance with a 64KB block size, we see that the 850 EVO is right on the heels of the 850 Pro 1TB model. Most of the drives perform really well in the large block size sequential test; the Corsair Neutron XT is the exception, but performs much better with 128KB blocks.
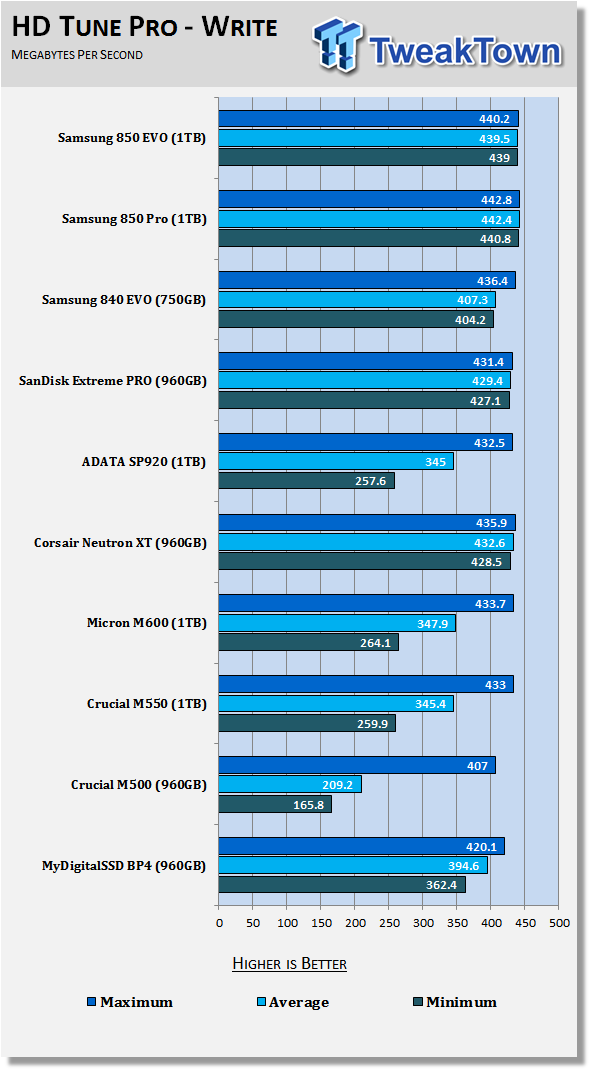
Write performance separates mainstream SSDs from the top performers. At the 1TB capacity, most drives manage to deliver very high sequential write performance thanks to the increased parallelization writing to more than one NAND die at a time. Again, the 850 EVO is right on the heels of the 850 Pro, and is faster than the 840 EVO.
HD Tach - Sequential Write Performance after Random Writes
Version and / or Patch Used: 3.0.4.0
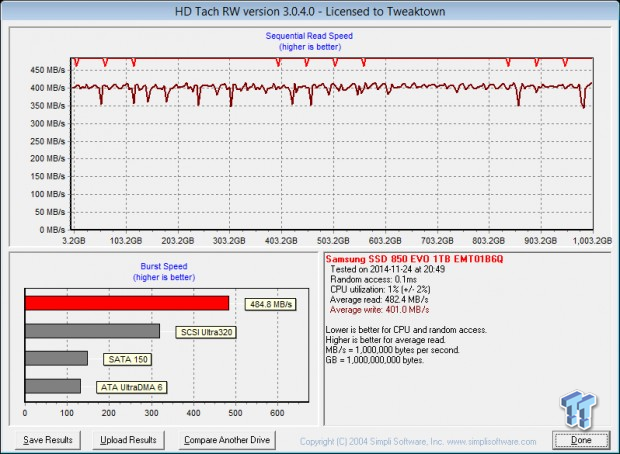
Here we see sequential reads and writes at the 128KB block size after a reasonable number of sequential and random writes to the 850 EVO 1TB SSD. The write performance doesn't take any large dips in write performance like we see with some products.
Benchmarks - Anvil Storage Utilities
Anvil Storage Utilities
Version and / or Patch Used: RC6
So, what is Anvil Storage Utilities? Well, it's a storage benchmark for SSDs and HDDs where you can check and monitor your performance. The Standard Storage Benchmark performs a series of tests; you can run a full test, or just the read or the write test, or you can run a single test, i.e. 4k QD16.
Anvil Storage Utilities is not officially available yet, but we've been playing with the beta for several months now. The author, Anvil, has been updating the software steadily on several international forums, and is adding new features every couple of months.
We can use Anvil several different ways to show different aspects for each drive. We've chosen to use this software to show the performance of a drive with two different data sets. The first is with compressible data, and the second data set is incompressible data. Several users have requested this data in our SSD reviews.
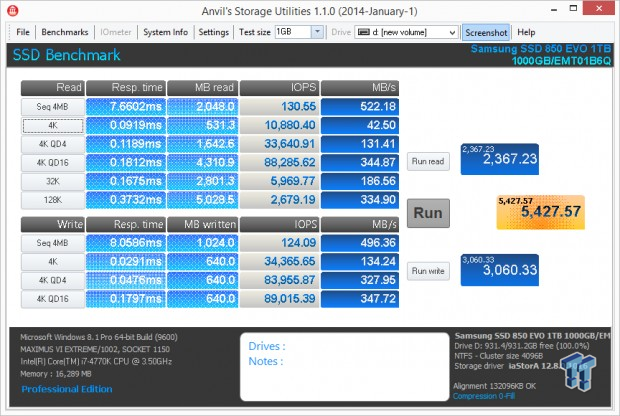
0-Fill Compressible Data
Incompressible Data
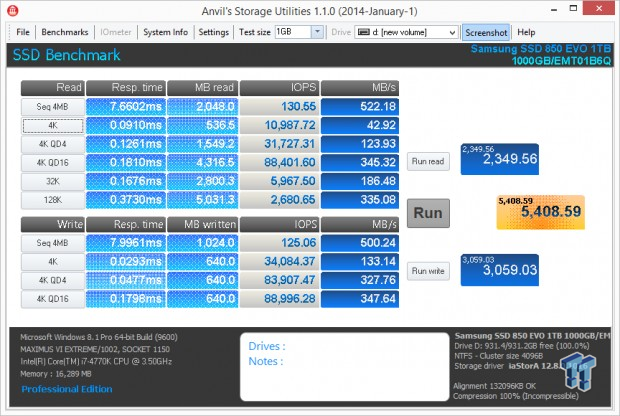
The Samsung 850 EVO 1TB doesn't perform any differently when working with incompressible data. The read and write performance is the same with incompressible and compressible data.
Low Queue Depth Read IOPS
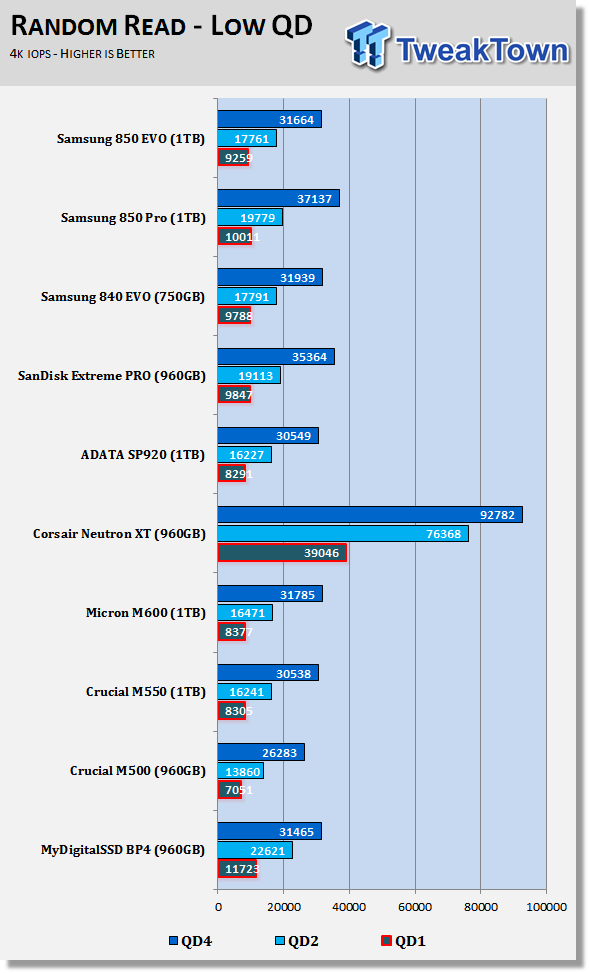
We didn't quite get to 10K random read IOPS with the 850 EVO 1TB SSD. We did break 10K IOPS at QD1 with the 250GB 850 EVO.
High Queue Depth Read IOPS
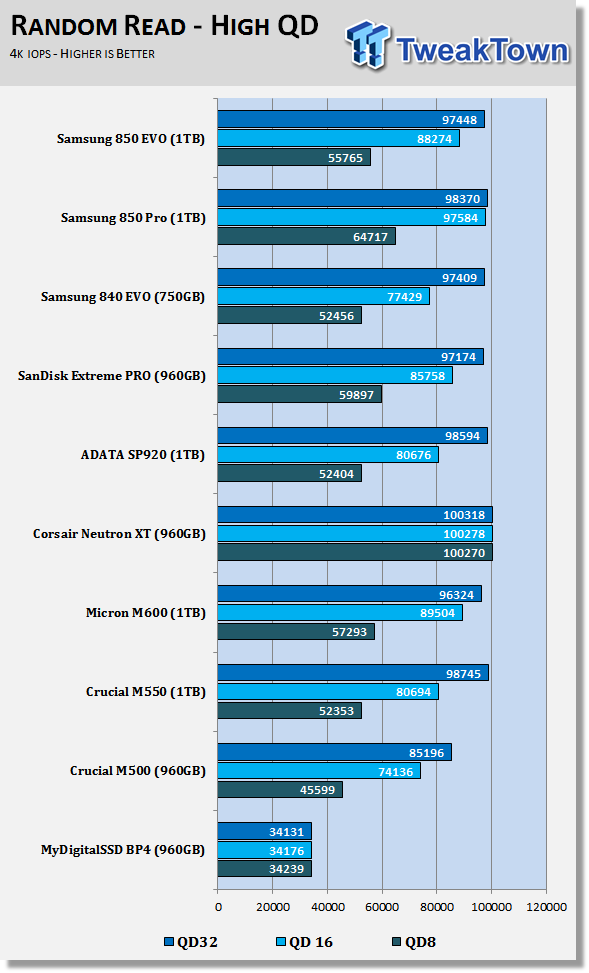
The 850 EVO scales very well, all the way to 97K IOPS in our test with 1GB of data written to each drive for each queue depth.
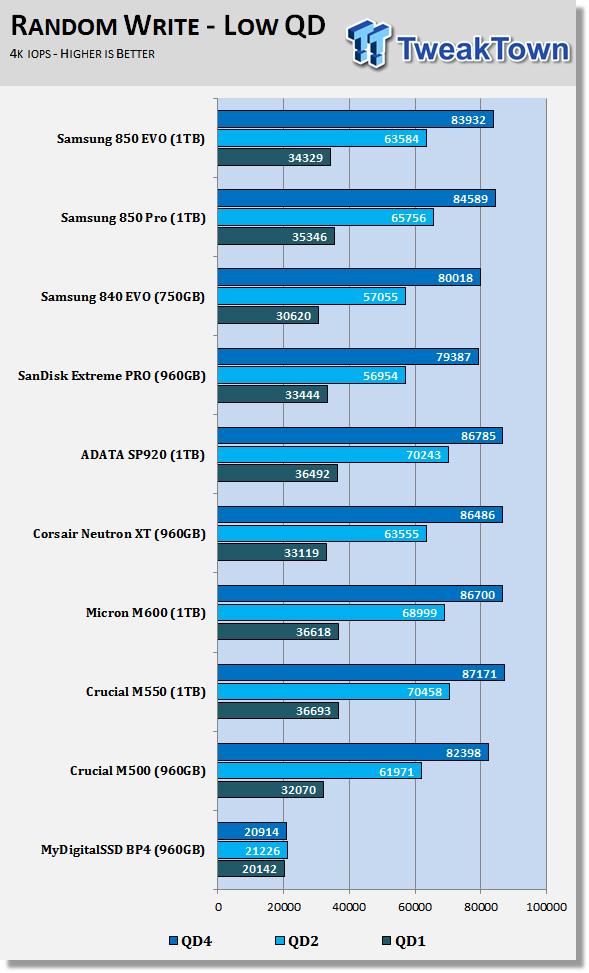
Low Queue Depth Write IOPS
High Queue Depth Write IOPS
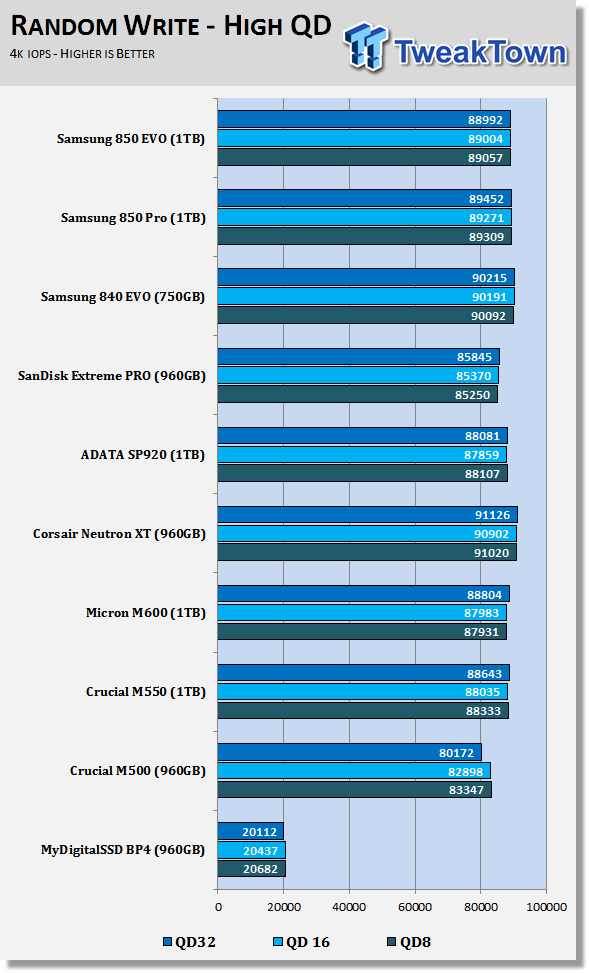
The write performance for the 850 EVO 1TB is also very high. We measured nearly 84K IOPS at QD4, and across all random write tests, the 850 EVO nearly mimicked the 850 Pro step for step.
Benchmarks - Mixed Read / Write Workloads
Sequential Mixed Read / Write Workloads
In this series of tests, we measure mixed workload performance. We start with 100% read, and then add data writes to the mix in 10% increments until we get to 100% writes. We believe this will be the next major area SSD manufacturers will address, after performance consistency.
Sequential Mixed Workload Bandwidth
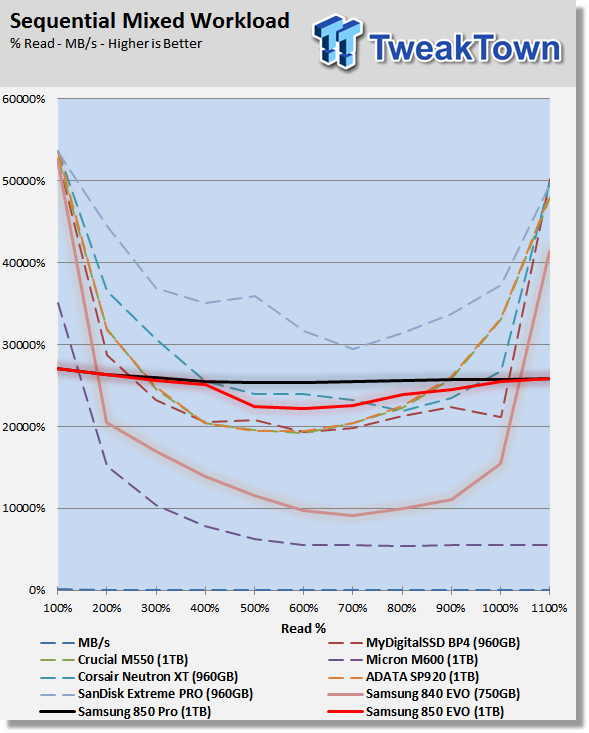
We have three drives highlighted in our sequential mixed workload chart, where all of the drives are tested in steady state. This mimics heavy sequential workloads with a lot of data, like editing very large videos. Samsung's SSDs usually do poorly here since the garbage collection scheme is aggressive. The 850 EVO doesn't drop off nearly as low as the previous generation mainstream Samsung SSD, the 840 EVO. There is some variation as the mix gets closer to 50% reads and 50% writes taking place at the same time, but the drop off is nothing like the 840 EVO.
Sequential 80% Read / 20% Write Bandwidth
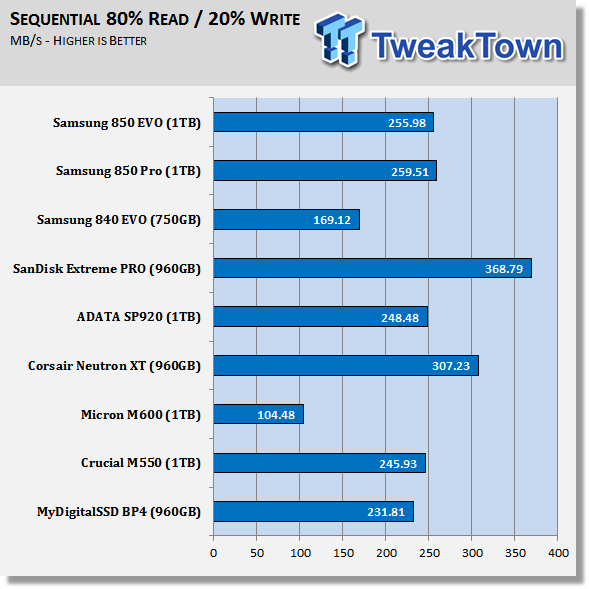
At the 80% read / 20% write mix, the 850 EVO is right with the 850 Pro. This is starting to sound like a theme; the 850 EVO is much closer to the performance of the flagship 850 Pro than the 840 EVO was to the 840 Pro.
Random Mixed Workload Response Time
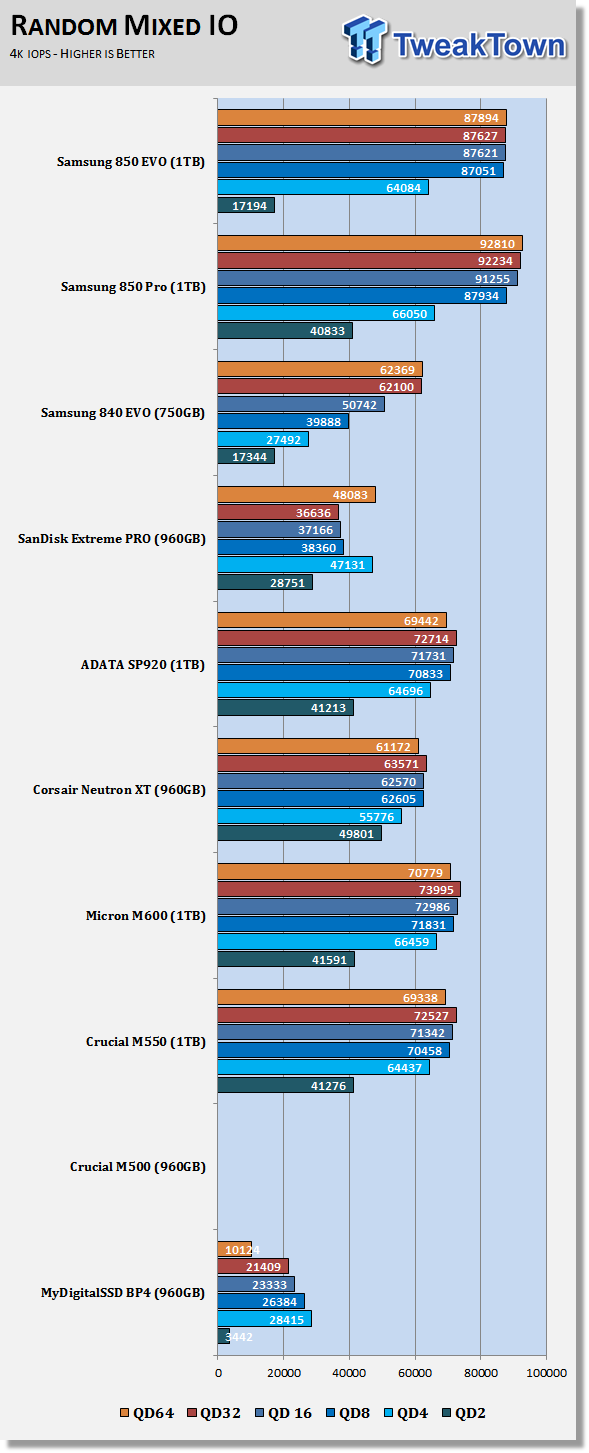
The random 4K 50% read / 50% write mixed IOPS performance again shows the 850 EVO performing almost identically to the 850 Pro in all but the lowest queue depth tested. At QD2 (because you can't have a read / write operation at QD1), the 850 EVO trails the Pro model, but at QD4, the performance really picks up.
PCMark 8 Consistency Test
Futuremark PCMark 8 Extended - Consistency Test
Version and / or Patch Used: 2.0.228
Heavy Usage Model:
Futuremark's PCMark 8 allows us to wear the test drive down to a reasonable consumer steady state, and then watch the drive recover on its own through garbage collection. To do that, the drive gets pushed down to steady state with random writes, and then idle time between a number of tests allows the drive to recover.
Precondition Phase:
1. Write to the drive sequentially through up to the reported capacity with random data.
2. Write the drive through a second time (to take care of overprovisioning).
Degradation Phase:
1. Run writes of random size between 8*512 and 2048*512 bytes on random offsets for ten minutes.
2. Run performance test (one pass only).
3. Repeat one and two, eight times, and on each pass, increase the duration of random writes by five minutes.
Steady state Phase:
1. Run writes of random size between 8*512 and 2048*512 bytes on random offsets for 50 minutes.
2. Run performance test (one pass only).
3. Repeat one and two, five times.
Recovery Phase:
1. Idle for five minutes.
2. Run performance test (one pass only).
3. Repeat one and two, five times.
PCMark 8's Consistency test provides a ton of data output that we use to judge a drive's performance. Here we see the three states of performance for the select SSDs, light use, consumer steady state, and worst case.
Storage Bandwidth - All Tests
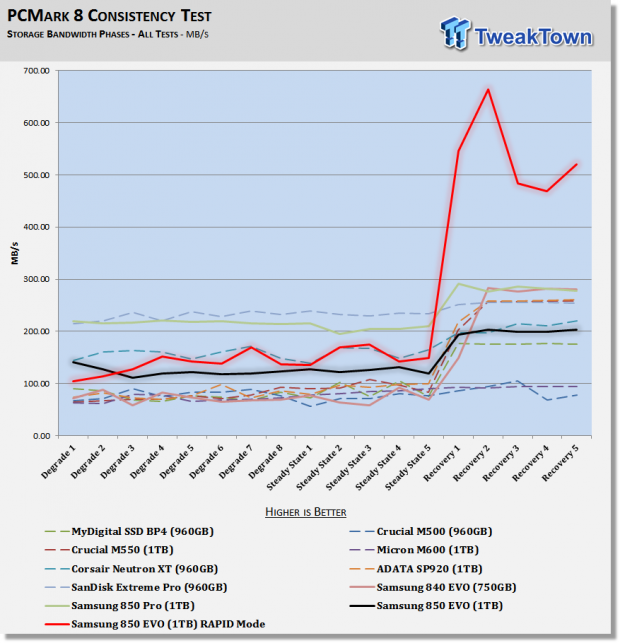
Without RAPID, the 850 EVO performs very well in comparison to other 1TB class SSDs on the market today. The Sandisk Extreme PRO and 850 Pro are both faster, and the Corsair Neutron XT is slightly faster under heavy workloads.
Storage Bandwidth - Heavy Load
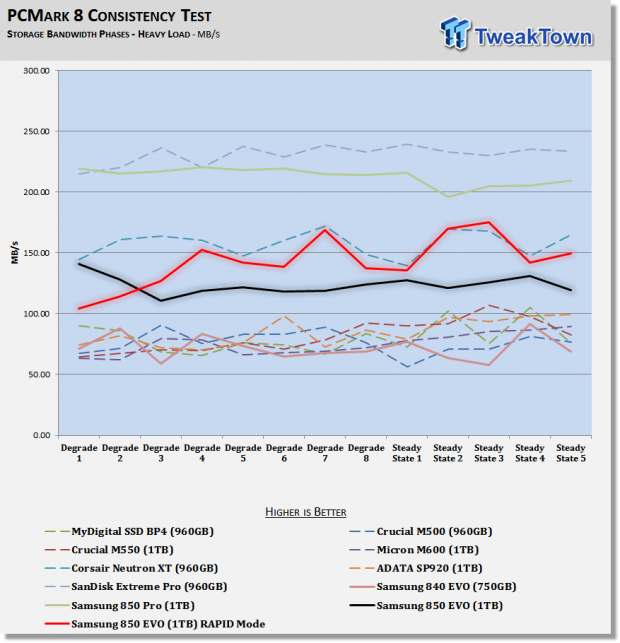
With RAPID enabled, the 850 EVO catches up to the Neutron XT under heavy workloads, but things get interesting under typical consumer workloads.
Storage Bandwidth - Typical Consumer Load
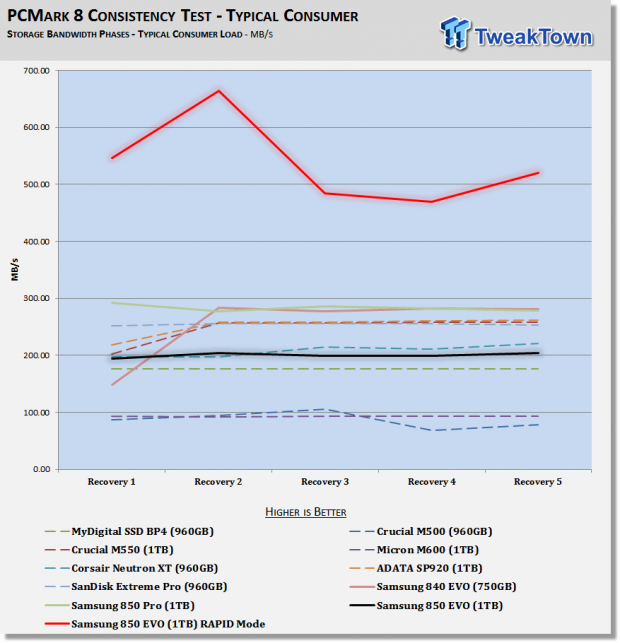
The 850 EVO with RAPID enabled dominates the performance chart in typical consumer workloads.
PCMark 8 Consistency Test - Continued
Total Access Time - All Tests
The access time test measures the total latency across all 18 tests. This is one of, if not the most important of all tests we run at this time for consumer SSDs. When your latency is low, your computer feels fast; it's just that simple.
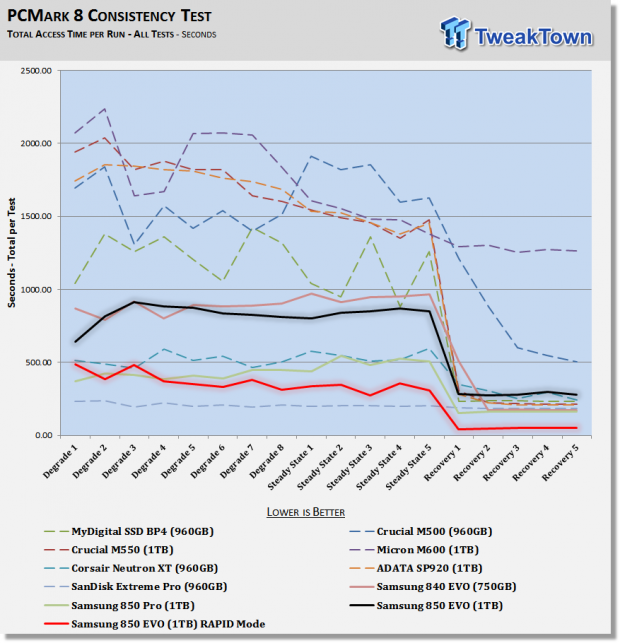
Total Access Time - Heavy Load

Total Access Time - Typical Consumer Load
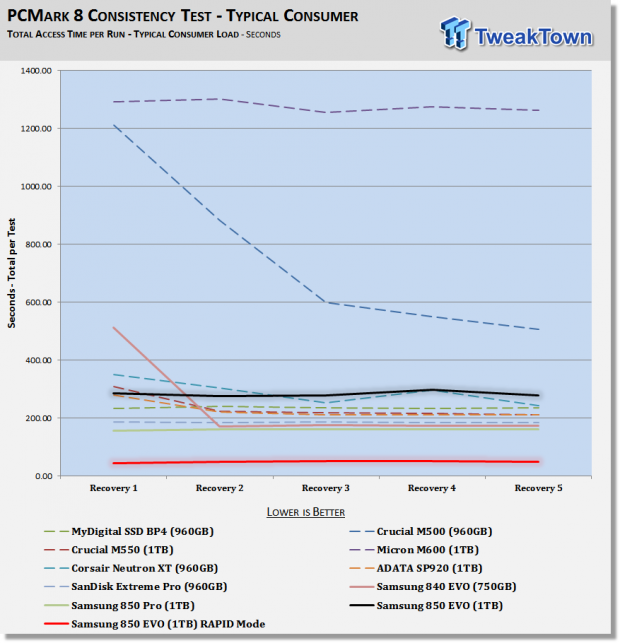
The latency charts show us the same results with the 850 EVO. Here you get a better look at the comparison between the 840 EVO, and the 850 EVO. The newer EVO model has less latency under heavy load, but in the typical consumer workload tests, the 840 EVO actually has a slight lead with lower latency.
Benchmarks - Power Testing
Bapco MobileMark 2012 1.5
Version and / or Patch Used: 2012 1.5
Developer Homepage: http://www.bapco.com
Test Homepage: http://www.bapco.com
MobileMark 2012 1.5 is an application-based benchmark that reflects usage patterns of business users in the areas of office productivity, media creation, and media consumption. Unlike benchmarks that only measure battery life, MobileMark 2012 measures battery life and performance simultaneously, showing how well a system design addresses the inherent tradeoffs between performance and power management.
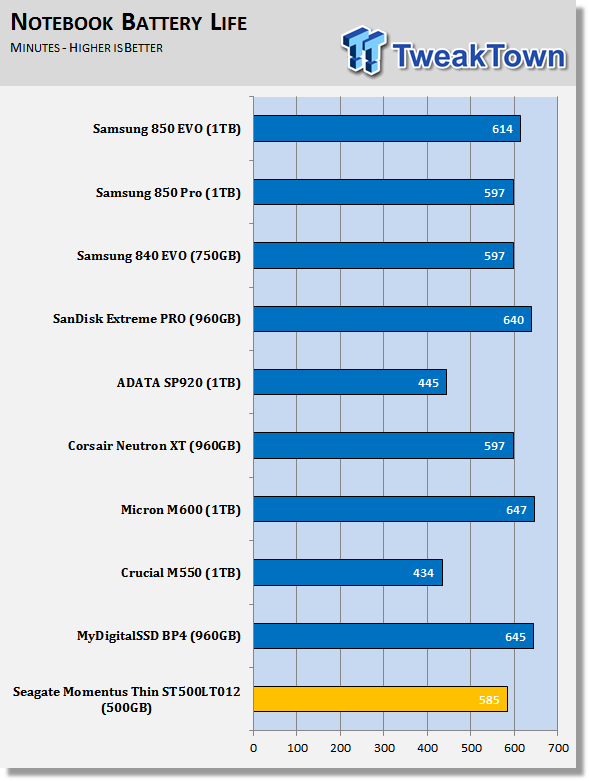
The Samsung 850 EVO 1TB does a bit better than the 850 Pro 1TB in the same capacity when it comes to notebook battery life. For this test, we don't have the drives beat down to where the advanced error correction is in play. One of these days, we'll take a handful of TLC drives, and wear the flash to the point where the advanced ECC has to kick in. This will allow us to see what happens to the power consumption when the drive has to read the same data from the TLC flash a few times. Given that the 850 EVO uses the next best flash right after SLC, I don't think this product will have any issues for a long time.
Power Limited Performance

The performance rating is a bit lower on the 850 EVO than the 850 Pro in a power-limited environment. Notebooks reduce the bus speeds to the CPU, PCIe, and SATA components to reduce power consumption. Some SSDs do slightly better than others in this reduced power state do. I doubt anyone would actually notice a difference from one drive to another since the latency increases on all drives.
Final Thoughts
Samsung's new 850 EVO has many highlights. At the MSRP, the 850 EVO is the new face of mainstream SSDs, and few companies will be able to compete. It's difficult to even call the new EVO a mainstream SSD since the performance, endurance, and warranty are in line with flagship products from other companies. Technologies like full disk encryption, and DEVSLP, the low-power state that boosts notebook battery life, also shouldn't be overlooked. While many other products on the market also offer these technologies, a few products that directly compete with the 850 EVO do not.
Looking closer at the pricing model, the 250GB costs a bit more than the slew of products currently selling for roughly $110 in the same capacity class. The 850 EVO exceeds the performance expectations of a 256GB mainstream SSD, brings a five-year warranty, and has a 75 TBW rating for endurance, all of which are specifications not previously found in the mainstream product class. Moving up to the 500GB and 1TB EVO 850 products, the TBW increases to 150, a rating shared with the 850 Pro. At this time, the 850 EVO and 850 Pro large capacity products stand on their own on the endurance scale.
The 850 EVO is more like a premium high performance SSD than it is like a mainstream SSD in other ways as well. Performance wise, without RAPID Mode, the 1TB model we tested today runs with the best drives on the market. Once you enable RAPID Mode, a free software DRAM cache for data storage, the performance shoots to levels only shared by other Samsung SSDs that can also use the same technology.
Samsung even increased performance where 3-bit per cell NAND is vulnerable to performance loss, writing large amounts of data to the drive in rapid succession. The 120GB model only received a small increase in performance over the 840 EVO, but the 500GB and 1TB models both saw significant improvements over the previous generation.
Samsung set the bar very high for the mainstream SSD market. There are products that cost a few dollars less, but I don't see a reason why anyone would not spend a little more to own one of the best performing SSDs on the market today.
 Samsung 990 2TB SSD Review - Ninth Gen QLC at PCIe Gen4 Speeds
 HighPoint Rocket 1604L Gen5 x16 NVMe Software RAID AIC Review: half the price with full 59 GB/s speed
 UGREEN NASync DXP4800 GT Review: powerful 4-bay NAS with AMD Ryzen and dual 10GbE ports
 Phison E37T SSD Controller Exclusive Preview - The Fastest DRAMless SSD Platform Yet
 Seagate FireCuda X1070 4TB SSD Review - A New Mainstream Contender
 Giveaway: Win an ASRock B850 Riptide WiFi and Phantom Gaming PG-850G PSU
 China's CXMT is on track to nearly match Micron's DRAM production capacity by the end of 2026
 NVIDIA's RTX 50 Super GPUs have reached board partners, but launch is on hold over 3GB GDDR7 pricing
 Amazon's God of War series is recasting Kratos after Ryan Hurst suffered an on-set injury
 Physical games don't matter to GameStop, CEO says
 GameStop CEO Ryan Cohen wants to buy eBay and build out an in-game digital marketplace
 KB5101650 Windows 11 update is causing some Dell PCs to shut down unexpectedly
 Bethesda on Elder Scrolls VI, Fallout 5 Xbox exclusivity: 'It's too early to comment'
 Assassin's Creed Black Flag Resynced makes in one day what Shadows took four days to earn
 Bethesda gives news on Elder Scrolls 6, confirms 4 Fallout projects, new Starfield content
 SteelSeries Arctis Nova 7 Wireless Gen 2 Headset Review - New and Improved, But Is It Enough?
 AMD Ryzen 7 7700X3D Review - Days of Future Past
 ASUS ExpertBook Ultra (Panther Lake) 14" Business Laptop Review
 ASUS ROG Raikiri II Xbox Wireless Controller Review - Ready to Take Control
 MOZA FMP18 Panel Bundle Review: authentic F/A-18 Hornet cockpit controls for flight sims
 Micron 6600 ION 245.76TB Enterprise SSD Review - Best in Class Programming Speeds
 MOZA MA3F EFCM Flight Control Module Review: authentic Airbus A320 autopilot panel for simulators
 Turtle Beach Stealth Pro II Wireless Gaming Headset Review - Premium Sound, Fantastic Features
 MOZA MGX1000 Instrument Panel Review: a realistic Garmin G1000 replica for immersive flight sims
 Hisense U6SF 65-inch MiniLED TV: High Performance Meets Leisurely Convenience
 I stopped digging through Windows menus after I set up this one folder
 Don't sell your Windows laptop until you do these things
 6 PC cleaning mistakes to avoid for safer hardware maintenance
 Phison and Intel Take Aim at Local AI's Memory Wall with aiDAPTIV
 How to Remap Keyboard Keys in Windows using Microsoft PowerToys
 7 tips to organize your Windows files for faster, easier access
 Intel Arc G3 Extreme first impressions with MSI's Claw 8 EX AI+ - Incredible power for an extreme price
 How to fix Wi-Fi Adapter Not Working on Windows laptops: troubleshooting tips
 Hisense U7SG 4K TV: Modern Entertainment for the New Age