Introduction
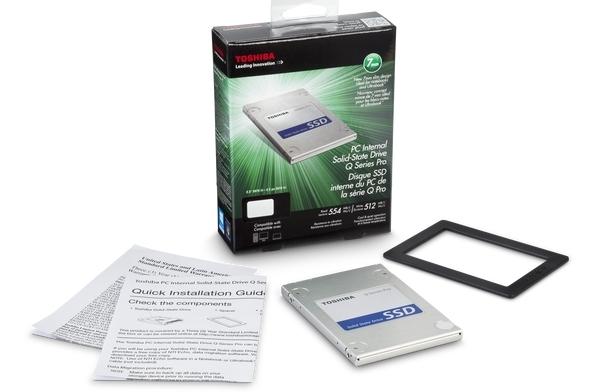
There is a lot to talk about today in this review, so we're going to get started. Around a year ago, we tested Toshiba's THNSNH drives and noticed quite a few things in the performance results that were unique to OCZ's Vertex 4 drives. Even though THNSNH (which was later introduced to the retail market as the Q-Series) used a different controller, we know firmware and programming are just as important as the hardware.
As everyone who follows the SSD market knows, OCZ ran into some issues, and Toshiba scooped the company up. Bringing OCZ into the Toshiba family brings competitiveness to the Toshiba SSD portfolio; we think Toshiba scooped up OCZ for technology they either purchased or used from OCZ. In the benchmarks today, we'll point out what we believe backs up our observations.
While Toshiba picked up a big name in the SSD market by signing on the dotted line with OCZ, the company already had some very good SSDs. We tested the original Q-Series drives when they were OEM only, and called only by a model name, THNSNH. The 128GB and 256GB drives were both very good, but not hyper-class at the time. The new Q Series Pro improves upon the THNSNH performance, and according to Jon Coulter in his RAID Report of the new Pro model we're testing today, "Toshiba's Q Series Pro is a bona fide Hyper-Class SSD, and if that wasn't enough, it's also one of the most cost-effective solid state solutions on the market."
We will look at the performance today, and see how the drive lands on the performance charts. Here in the introduction though, we will talk about the price because it's almost inconceivable. At just $158.85 at the time of writing, you might think we're talking about the 128GB model, but we're actually right in the middle of the capacity size line up with the 256GB.
With Jon talking about the Q Series Pro playing in the same league as the fastest drives on the market (in his RAID article), and me telling you this is one of the lowest priced 256GB class drives on the market, I know you want to read more.
Specifications, Pricing and Availability

Toshiba released the Q Series Pro in three capacity sizes, 128GB, 256GB, and 512GB. Today we're looking at the 256GB model in a 2.5" form factor, but later this month we'll publish the M.2 SATA form factor in 512GB.
The claimed performance over SATA III is 554 MB/s sequential read, and 512 MB/s sequential write speeds. Toshiba doesn't give random 4K IOPS numbers on the official product page, but we'll build that piece of the puzzle today.
The Q Series Pro uses a 7mm z-height for Ultrabooks, and includes a 7mm to 9.5mm adapter for use in drive sleds that require standard 2.5" HDD heights. The adapter is the only accessory in the package, but Toshiba does back the drive with a three-year warranty.
The price is just as important as the performance. At the time of writing, the Q Series Pro was available at Amazon in all three capacity sizes. The 128GB price was $98.99, 256GB was $158.85, and the 512GB was at $398.41. The largest capacity size doesn't have the same value as the two smaller drives, but its price is pretty good.
PRICING: You can find the Toshiba Q Series Pro SSD for sale below. The prices listed are valid at the time of writing, but can change at any time. Click the link to see the very latest pricing for the best deal.
United States: The Toshiba Q Series Pro 128GB SSD retails for $98.99 at Amazon, the Toshiba Q Series Pro 256GB SSD retails for $154.00 at Amazon, and theToshiba Q Series Pro 512GB SSD retails for $398.41 at Amazon.
Canada: The Toshiba Q Series Pro 128GB SSD retails for $134.54 at Amazon Canada, the Toshiba Q Series Pro 256GB SSD retails for $244.99 at Amazon Canada, and the Toshiba Q Series Pro 512GB SSD retails for $519.02 at Amazon Canada.
Toshiba Q Series Pro 256GB SSD
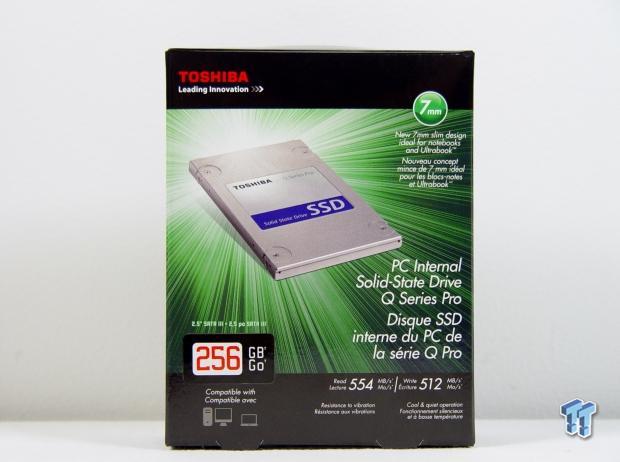
This is the first time we've tested a Toshiba SSD with a retail package, and all of the accessories. The Toshiba package gives us some information on the front, including performance data.


Inside, we found the drive in a bubble package, a quick install guide, and a 7mm to 9.5mm adapter plate.

The bubble pack adds a nice touch, and secures the drive in the box really well.
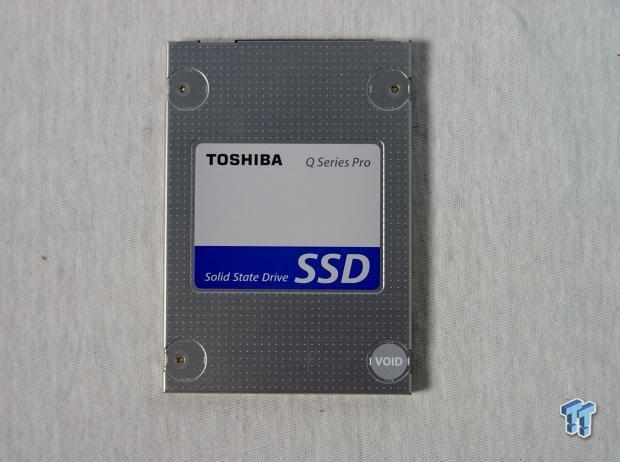
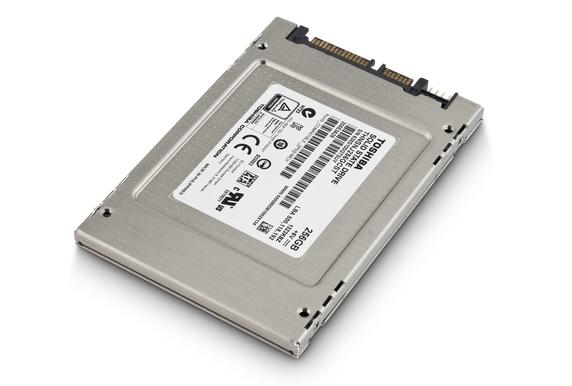
Here we get our first look at the Q Series Pro in 2.5" form factor. There really isn't much to the retail drive, at least not on the outside.
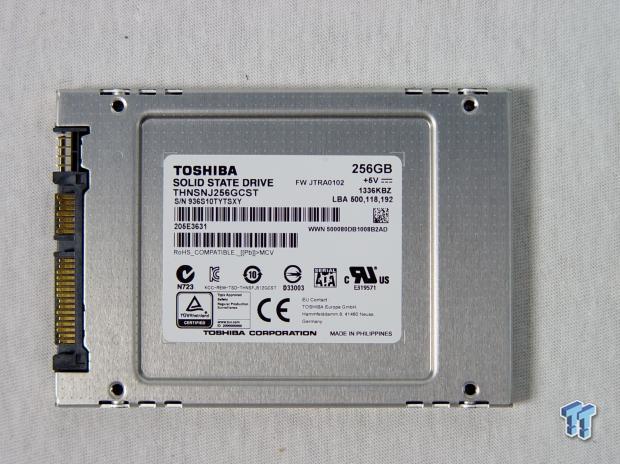
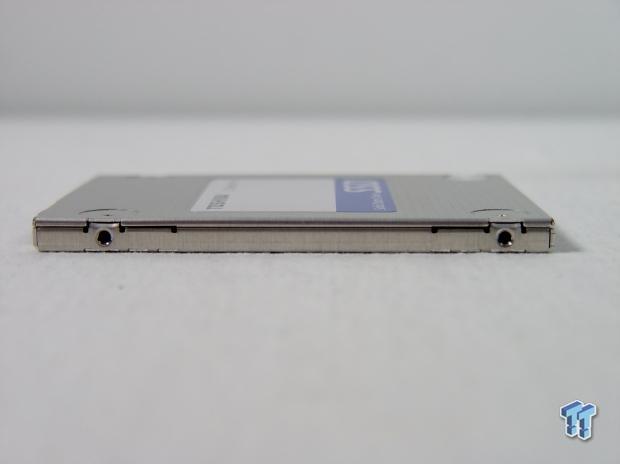

All of the mounting points and the SATA power and data connectors are where they should be.

Inside, we found a similar configuration to the THNSNH drive. Toshiba used a controller, and eight NAND flash packages. The controller and the flash all have thermal pads to push heat away from the package and into the drive's case. Note the lack of a DRAM buffer.

All of the surface mount components are on the primary side.

Here we get our first look at the Toshiba controller used in the Q Series Pro 256GB. The thermal pad makes it difficult to read all of the markings.
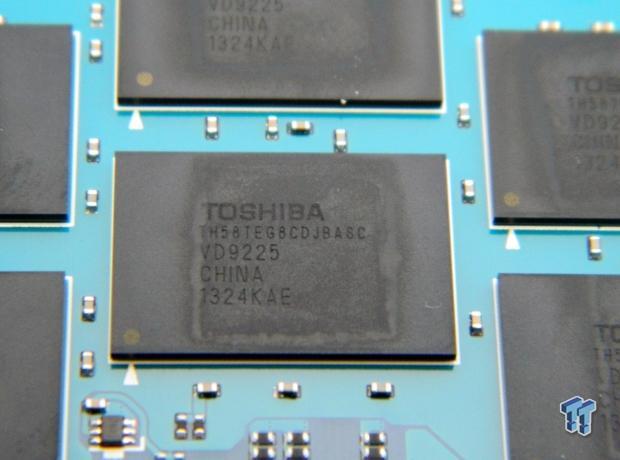
It shouldn't be a surprise to find Toshiba NAND flash on the drive. Toshiba used 19nm flash with four die per package.
Benchmarks - Test System Setup and ATTO Baseline Performance
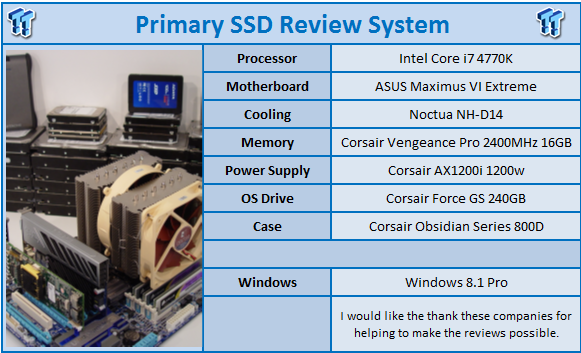
Desktop Test System
Lenovo W530 - Mobile Workstation
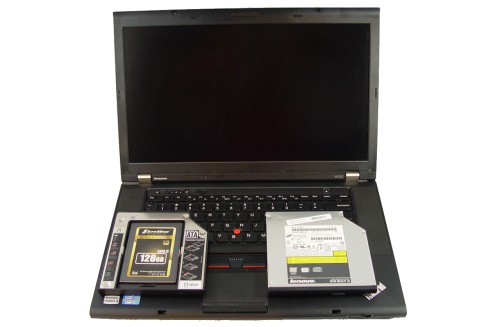
We use two systems for SSD testing. The desktop runs a majority of the tests, and the Lenovo W530 runs the notebook power tests, as well as the real-world file transfer benchmark.
ATTO Baseline Performance
Version and / or Patch Used: 2.34
ATTO is a timeless benchmark used to provide manufacturers with data used to market storage products.
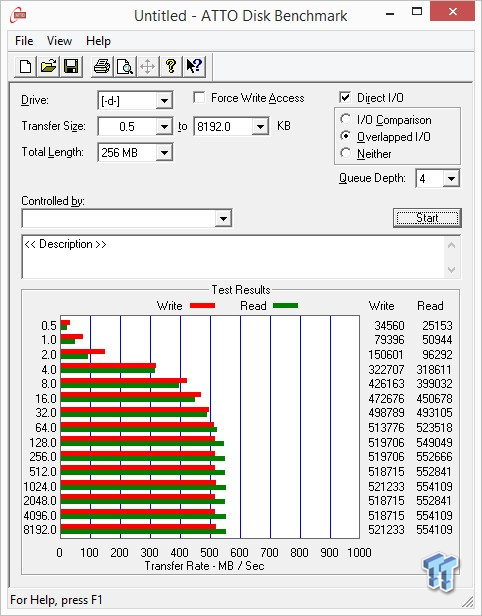
Although Toshiba quoted 554 / 512 MB/s sequential read and write performance, we achieved the same sequential read, but slightly better sequential write performance at 521 MB/s.
Benchmarks - Sequential Performance
HD Tune Pro
Version and / or Patch Used: 4.00
Developer Homepage: http://www.efdsoftware.com
Product Homepage: http://www.hdtune.com
HD Tune is a Hard Disk utility which has the following functions:
Benchmark: Measures the performance
Info: Shows detailed information
Health: Checks the health status by using SMART
Error Scan: Scans the surface for errors
Temperature Display
HD Tune Pro gives us accurate read, write, and access time results. For the past couple of years, HD Tune Pro has gained popularity amongst reviewers; it is now considered a must-have application for storage device testing.
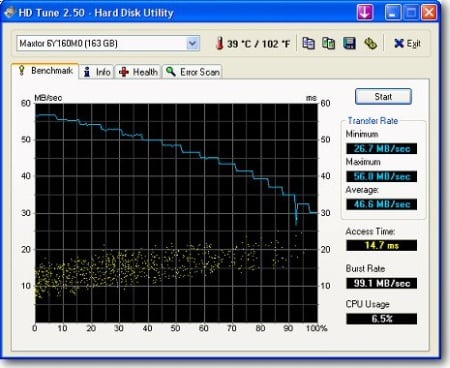

While the performance isn't exactly the same as the Vertex 4, Vector, or Vector 150, the profile of the test results on the graph is very similar.
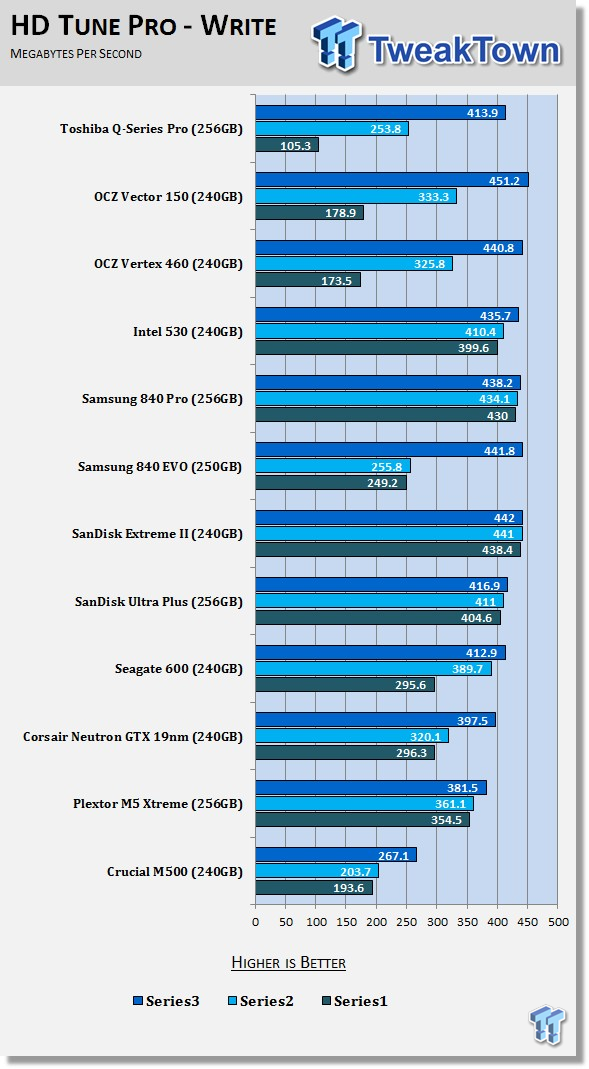
Q Series Pro also has the same performance write profile as the OCZ drives when we write 64KB blocks to it. The drive writes at high speed for 50% of the test, and then drops down to just over 105 MB/s for the second half.
HD Tach - Sequential Write Performance after Random Writes

After running the drive through random write tests, we measure the 128KB sequential performance in HD Tach. The lack of a DRAM buffer to store the map translation layer may be why the performance drops so much after random writes. Regardless of the reason, the Q Series Pro can get in pretty bad shape after a random write workload.
Benchmarks - AIDA64 Random Access Time
AIDA64 Random Access Time
Version and / or Patch Used: 1.60
Developer Homepage: http://www.aida64.com
Product Homepage: http://www.aida64.com
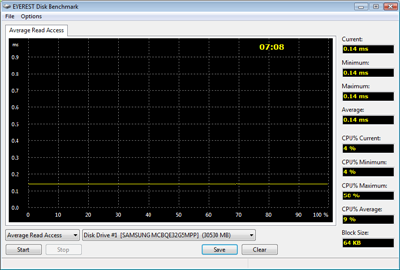
AIDA64 offers several different benchmarks for testing and optimizing your system or network. The Random Access test is one of very few, if not the only, that will measure a hard drive's random access times in hundredths of milliseconds, as opposed to tens of milliseconds.
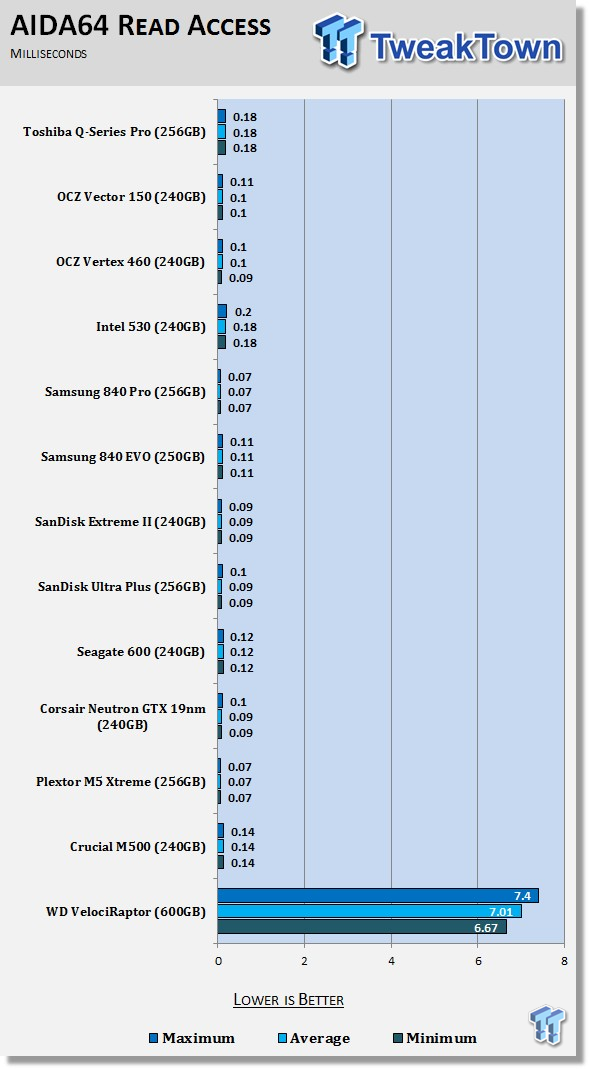
Read latency isn't an issue with the Q Series Pro; the drive holds a steady .18ms at 64KB.
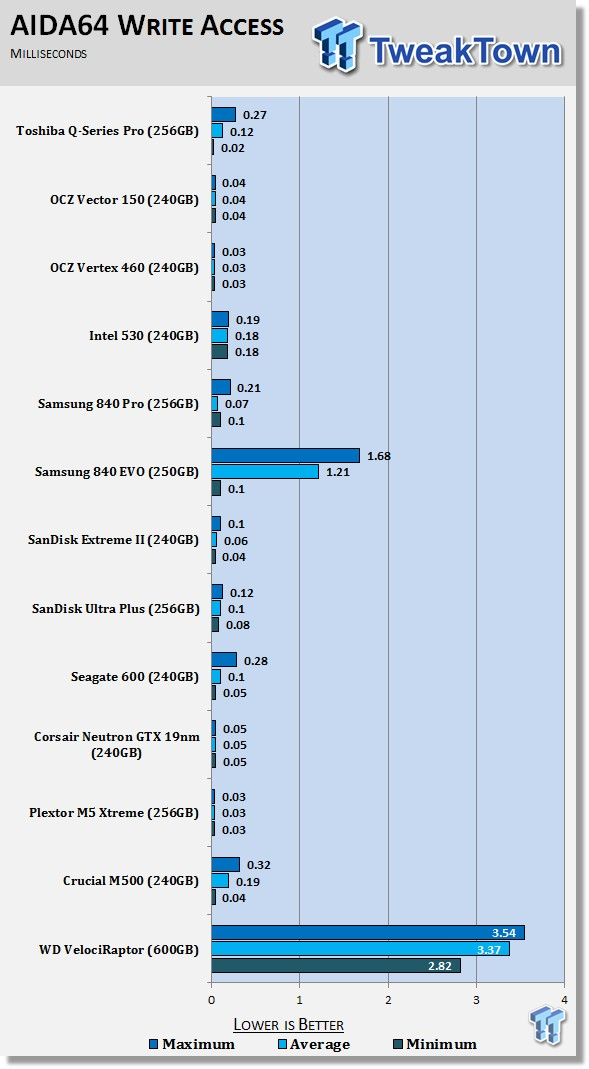
The write latency starts out strong, and then steadily increases. This is similar to what we see on many new SSDs using new lithography flash with a SLC like layer handled by the flash transaction layer.

Here we see the actual run in AIDA64 that shows the graph results. The first 8% of the run shows the low latency, and then the drive's latency increases. This is similar to what we see on the 840 EVO, Extreme II, and other drives with an SLC like flash layer.
Benchmarks - Anvil Storage Utilities
Anvil Storage Utilities
Version and / or Patch Used: RC6
So what is Anvil Storage Utilities? It's a storage benchmark for SSDs and HDDs where you can check and monitor your performance. The Standard Storage Benchmark performs a series of tests, you can run a full test, or just the read or the write test, or you can run a single test (i.e. 4K DQ16).
Anvil Storage Utilities is not officially available yet, but we've been playing with the beta for several months now. On several international forums, the author, Anvil, has been updating the software steadily, and is adding new features every couple of months.
The software is used several different ways, and to show different aspects for each drive. We've chosen to use this software to show the performance of a drive with two different data sets. The first is with compressible data, and the second data set is incompressible data. Several users have requested this data in our SSD reviews.
0-Fill Compressible Data

Incompressible Data

Toshiba's SSD controller doesn't work differently with incompressible data like the LSI SandForce and Phison controllers.
Read IOPS through Queue Depth Scale
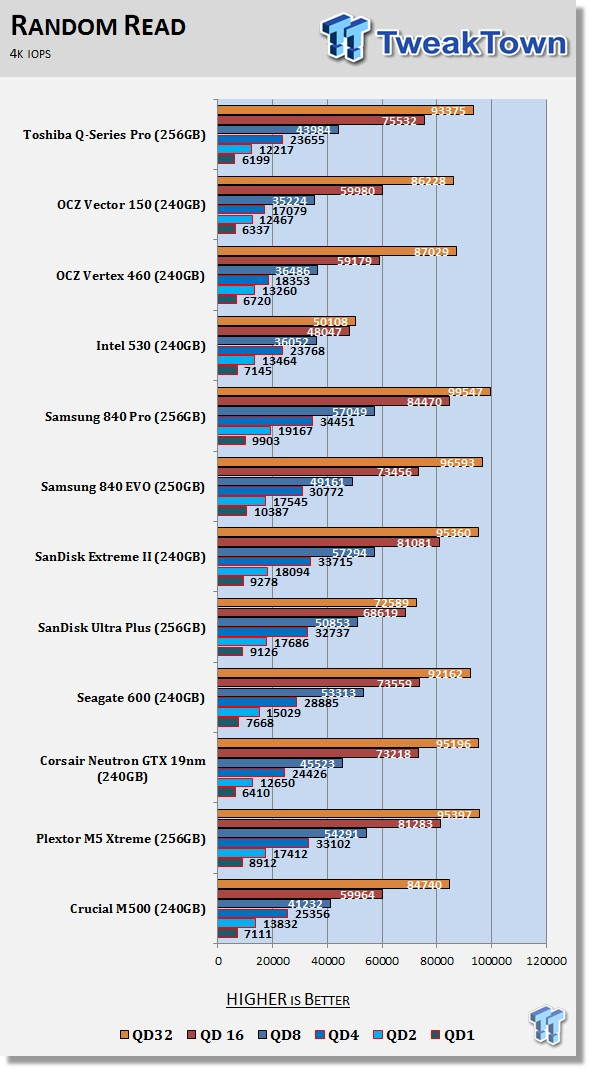
The low queue depth read IOPS performance is on the low side of the results on the chart, but the Q Series Pro takes off at QD4 and higher. Eventually, the drive makes it over 90K read IOPS, but the performance comes at QD32.
Scaling Write IOPS through Queue Scale

4K write IOPS performance at QD1 and QD2 is very good; it's among the best drives on the market today. The drive reaches its peak at 60K IOPS.
Benchmarks - CrystalDiskMark
CrystalDiskMark
Version and / or Patch Used: 3.0 Technical Preview
Developer Homepage: http://crystalmark.info
Product Homepage: http://crystalmark.info/software/CrystalDiskMark/index-e.html
Download here: http://crystaldew.info/category/software/crystaldiskmark
CrystalDiskMark is a disk benchmark software that allows us to benchmark 4K and 4K queue depths with accuracy.
Key Features:-
* Sequential reads/writes
* Random 4KB/512KB reads/writes
* Text copy
* Change dialog design
* Internationalization (i18n)
Note: Crystal Disk Mark 3.0 Technical Preview was used for these tests since it offers the ability to measure native command queuing at 4 and 32.

The 4K IOPS results carry over to CDM. Here, we see the 4K QD1 read at 24 MB/s. In this test, we get to see the full sequential read speed, which is over 540 MB/s. The Q Series Pro does the same thing that the modern Vertex and Vector drives do; the QD1 read speed is limited, so another task can take place without the drive feeling slow when multitasking.

Again, the IOPS performance results carried over well in CDM, where we see the MB/s. The Q Series Pro scales well from QD1 to QD4, but the drive plateaus early.
Benchmarks - PCMark Vantage Hard Disk Tests
PCMark Vantage - Hard Disk Tests
Version and / or Patch Used: 1.0.0
Developer Homepage: http://www.futuremark.com
Product Homepage: http://www.futuremark.com/products/pcmarkvantage

PCMark Vantage is the first objective hardware performance benchmark for PCs running 32 and 64 bit versions of Microsoft Windows Vista. PCMark Vantage is perfectly suited for benchmarking any type of Microsoft Windows Vista PC, from multimedia home entertainment systems and laptops, to dedicated workstations and high-end gaming rigs. Regardless of whether the benchmarker is an artist or an IT Professional, PCMark Vantage shows the user where their system soars, or falls flat, and how to get the most performance possible out of their hardware. PCMark Vantage is easy enough for even the most casual enthusiast to use, yet supports in-depth, professional industry grade testing.
FutureMark has developed a good set of hard disk tests for their PCMark Vantage Suite. Windows users can count on Vantage to show them how a drive will perform in normal day to day usage scenarios. For most users, these are the tests that matter since many of the old hat ways to measure performance have become ineffective to measure true Windows performance.


In real-world tasks (but with the drive empty to see the results broken down) the Q Series Pro holds its own, but lags behind many of the hyper drive class products.
Benchmarks - PCMark Vantage - Drives with Data Testing
For a complete breakdown on the Drives with Data Testing, please read this article. You will be able to perform this test at home with the files provided in the article; full instructions are included.
- Brief Methodology
SSDs perform differently when used for a period of time, and when data is already present on the drive. The purpose of the Drives with Data Testing is to show how a drive performs in these 'dirty' states. SSDs also need time to recover, either with TRIM, or onboard garbage collection methods.
Drives with Data Testing - 25%, 50%, 75% Full States and Dirty / Empty Test
Files needed for 60 (64GB), 120 (128GB), 240 (256GB)
60GB Fill - 15GB, 30GB, 45GB
120GB Fill - 30GB, 60GB, 90GB
240GB Fill - 60GB, 120GB, 160GB
Empty but Dirty - a test run just after the fill tests, and shows if a drive needs time to recover, or if performance is instantly restored.

With data on the drive, the Q Series Pro runs the same tests very well. Using the 50% of flash populated with data as our marker, the Q Series Pro runs faster than any other drive on the chart. This is an important benchmark because it shows results in a state that is closer to real-world use. It's rare to get a result in the 50K range, but the Q Series Pro breaks into the 55Ks.
Benchmarks - PCMark 8 Hard Disk Tests
Version and / or Patch Used: 1.0.0
Developer Homepage: http://www.futuremark.com
Product Homepage: http://www.futuremark.com/products/pcmark8
Note: PCMark 8 Storage benchmark is ideal for testing the performance of SSDs, HDDs, and hybrid drives. Using traces recorded from Adobe Creative Suite, Microsoft Office, and a selection of popular games, PCMark 8 Storage highlights real-world performance differences between storage devices.


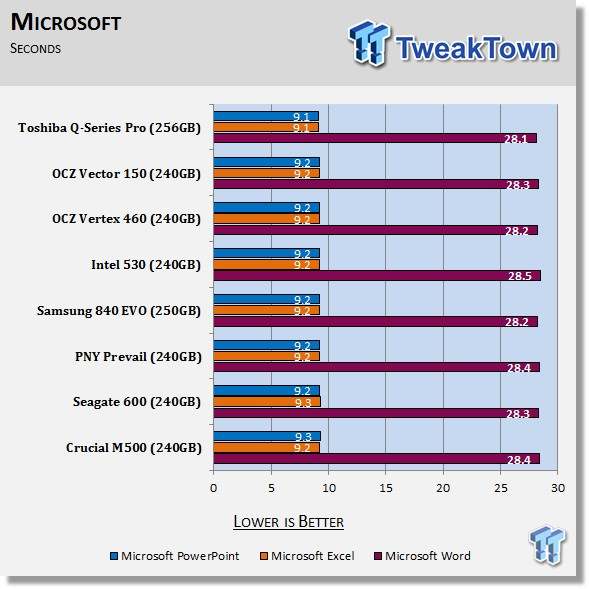
Futuremark's newest storage test found in PCMark 8 gives us the results in seconds, and all of the drives are very close to each other.
PCMark 8 Storage Bandwidth
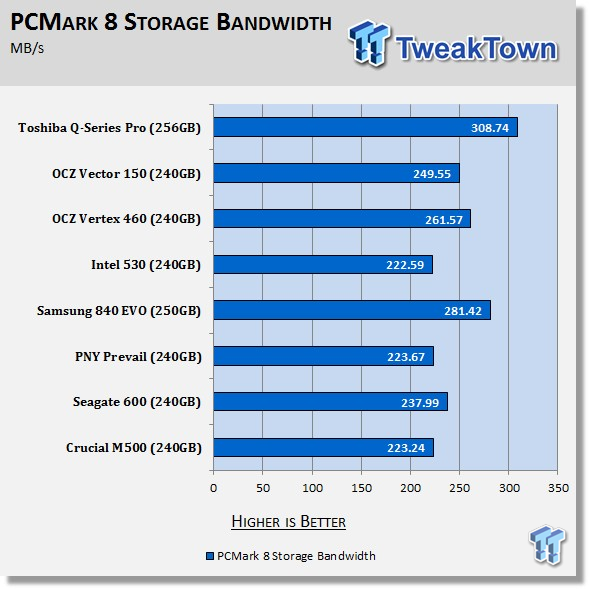
In this new advanced test, Q Series Pro is faster than every other drive on the market. As we saw in the benchmarks above though, the SATA III limit means a number of very good SSDs are all very close to each other performance wise.
Benchmarks - DiskBench
DiskBench - Directory Copy
Version and / or Patch Used: 2.6.2.0
Developer Homepage: Nodesoft
Product Homepage: DiskBench
Download here: http://www.nodesoft.com/diskbench/download
Note: In this test, we use the Lenovo W530 Mobile Workstation and a SuperSSpeed S301 SLC 128GB SSD to move a 15GB block of data to and from the target drive. This is part of our real-world test regiment. Roughly 45GB of data resides on the target drive before the '15GB Block' is transferred. The 15GB Block is the same data we built for the Data on Disk Testing, and is a mix of compressible and incompressible data.

This is a data transfer test that takes place in a notebook, with the notebook power scheme in place. This test is another that we came up with to show performance in the real-world, and not just a corner case. The Q Series Pro performs very well, and faster at writing data than the 840 EVO, the bestselling SSD on the market today.
Benchmarks - Power Testing
Bapco MobileMark 2012 1.5
Version and / or Patch Used: 2012 1.5
Developer Homepage: http://www.bapco.com
Test Homepage: http://www.bapco.com
MobileMark 2012 1.5 is an application-based benchmark that reflects usage patterns of business users in the areas of office productivity, media creation, and media consumption. Unlike benchmarks that only measure battery life, MobileMark 2012 measures battery life and performance simultaneously, showing how well a system design addresses the inherent tradeoffs between performance and power management.

For the last month, we laid off publishing the power and thermal tests in the reviews, and we heard about it. Our logging multimeter doesn't like Windows 8, so we're working on getting an update, and we're in the middle of a move to a new notebook with Windows 8 and DEVSLP support.
Until we have all of the little bugs worked out, we're just publishing the MobileMark results with our older W530 notebook so we can still publish the results. When we get the new system working, we'll publish a separate article with all of the updated results with DEVSLP working.
Our chart is a bit crowded, but it's easy to spot the Toshiba Q Series Pro, it's the one that performed the best on the chart. The power on time was within a few minutes of the OCZ Vertex 460 and SanDisk Extreme II, but it was still better than the others on the chart.
Final Thoughts
In many corner case tests, the Toshiba Q Series Pro was either at the top or close to the top performance wise. The 256GB class drive only has a few places where performance slides, but equally, the drive has a few places where the performance is better than anything else.
The real story isn't just about performance, and it shouldn't be either. The real story is the performance at cost. The overall value for the Q Series Pro is high, but that's mainly due to the very low price of $158.85 at the time of writing, and the level of performance offered. It would be nice if the same package also included a desktop adapter bracket and a SATA cable, at the same price.
Toshiba has mainly focused on the OEM market, but made a run with the Q Series, and now the Q Series Pro. From a market share point of view, I don't think it worked out too well, even when they have a product with great performance like the one we looked at today. Acquiring OCZ will instantly boost Toshiba's street knowledge when it comes to the retail market, even with OCZ as a subsidiary.
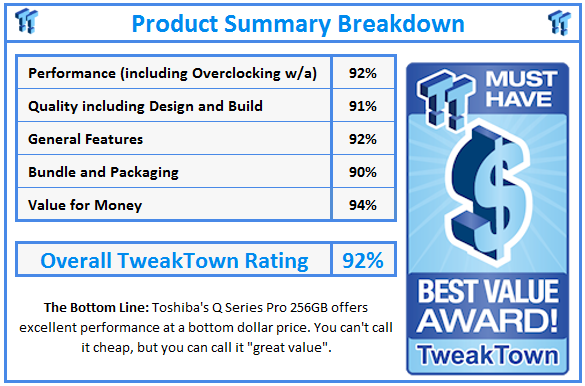
All things considered, and looking at what really matters for the Q Series Pro, this is a really good drive that's available for an excellent price. At this point, the Q Series Pro is the best option for those looking for value and performance.
PRICING: You can find the Toshiba Q Series Pro SSD for sale below. The prices listed are valid at the time of writing, but can change at any time. Click the link to see the very latest pricing for the best deal.
United States: The Toshiba Q Series Pro 128GB SSD retails for $98.99 at Amazon, the Toshiba Q Series Pro 256GB SSD retails for $154.00 at Amazon, and theToshiba Q Series Pro 512GB SSD retails for $398.41 at Amazon.
Canada: The Toshiba Q Series Pro 128GB SSD retails for $134.54 at Amazon Canada, the Toshiba Q Series Pro 256GB SSD retails for $244.99 at Amazon Canada, and the Toshiba Q Series Pro 512GB SSD retails for $519.02 at Amazon Canada.

