Introduction
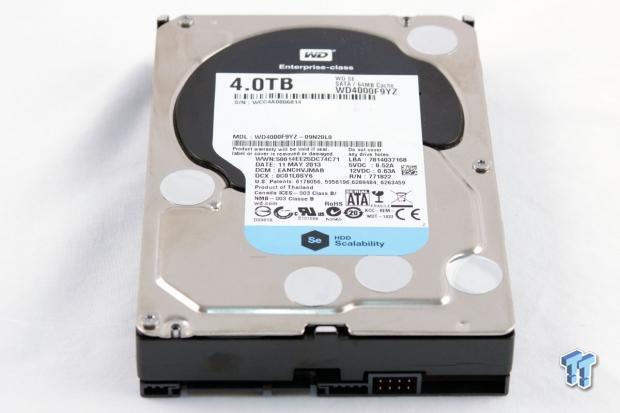
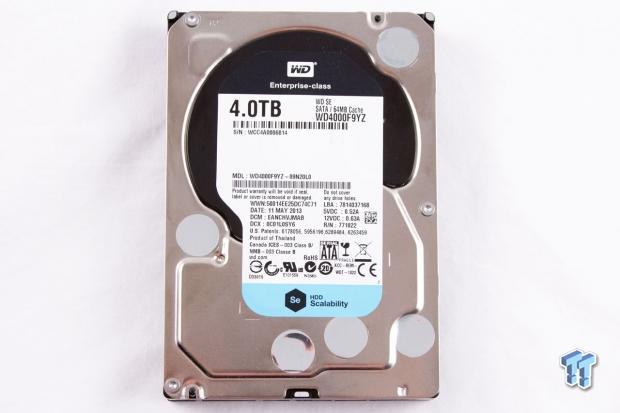
WD has released a new SATA 6Gb/s 7,200 RPM HDD in the 3.5" form factor specifically geared for scale-out and NAS environments. This new WD Se makes several trade-offs to provide an economical means of storing massive amounts of data, but also utilizes new technologies to create the desired balance of capacity, performance, reliability and price for users. The WD Se line of HDDs is available in capacities of 2TB (WD2000F9YZ), 3TB (WD3000F9YZ) and 4TB (WD4000F9YZ), at lower pricing than other enterprise HDD's ($160-310 USD).
We have all read about the continuing data explosion. As mobile computing continues its expansion, and higher resolution video and images proliferate, the need to store this vast amount of data is becoming paramount. A recent Digital Universe study revealed that the amount of data created, replicated and consumed in a single year is growing at an annual rate of 46%. This is leading to a future literally overran with data, as evidenced by the prediction that we will be generating 40,000 Exabyte's of data per year in 2020.
This flood of data has created a quandary for many organizations. Through the magic of big data and analytics, even the most mundane unstructured 'disposable' data is valuable. This has led to a redesigning of the datacenter to meet the changing demands of data storage. Facebook is leading the way with new datacenters designed specifically to handle these large amounts of unstructured data in a cost-effective manner.
The WD Se enterprise-class HDD looks to offer these type of applications an economical means of storing large amounts of data in NAS and replicated environments that do not require high performance. The WD Se fits well for users with a need for mass storage for bulk cloud storage, Big Data storage, backup and archiving. Providing this class of HDDs with enterprise features that ensure a higher level of reliability is key. WD accomplished this by leveraging the design and components of the WD Re HDD's.
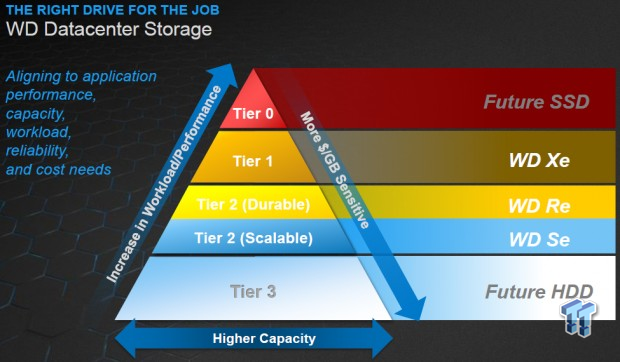
WD began by revamping their datacenter portfolio to provide a solution for all levels of performance required in the datacenter. Our focus immediately jumps to the Tier-0 and Tier-3 categories, where we notice that WD has a new SSD in the works, and a future HDD that looks to fulfill the need for massive storage requirements.
The WD Xe resides in the Tier-1 slot and provides high-density performance storage for demanding applications. The Xe is followed closely by the WD Re, which comes in both SAS and SATA flavors. This splits the Tier-2 into two categories, one focused on durability and the other focusing on scalable high capacity storage. The Xe and Re are well suited for RAID environments with higher performance and reliability.
One of the primary differentiators between the Re and the Se is the throughput rating per year. WD is using this new metric to fine-tune their offerings for customers with specific workloads. The WD Re fulfills the durability requirement for Tier-2 with its higher workload rating of 180 TB/year. This higher workload averages out to 1.5TB of data transfers per day. For those with less demanding workloads the WD Se fills out the lower portion of Tier-2 with 550 TB/year or 500 GB per day of use.
The Se also features a markedly lower power consumption in comparison to the Re and Xe HDDs. The Se features a power draw of 9.5W, a reduction of 2 Watts. This is accomplished in large by the relaxed Advanced Format 4K sectors and disabling of unnecessary features in the SOC. The lower performance of the Se will not result in vastly improved IOPS-to-Watts measurements, but in replicated environments the overall power reduction is a welcome addition.
While the Se offers less durability than the Re HDD's, it still provides plenty of enterprise-class features to provide a great solution for those looking to store large amounts of data reliably. TLER, StableTrac, RAFF, an SED option and a five year warranty round out the feature set of the WD Se. Let's take a closer look at these technologies on the following page.
WD Se Specifications
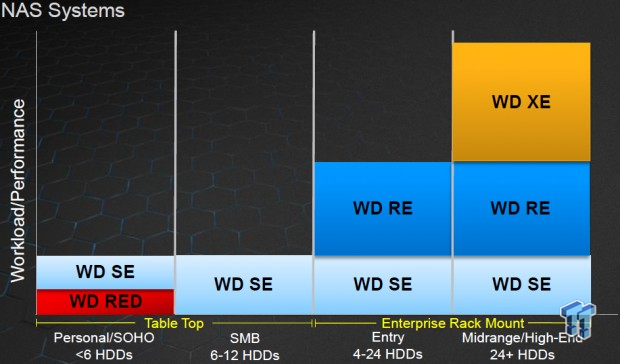
The WD Se comes in a 3.5" form factor and operates at 7,200 RPM. All capacities have the same 64MB cache buffer. The SATA 6Gb/s HDD is geared for scale out environments and is suitable for a large number of applications. For many NAS users, the WD Red series has been very popular, but suffers from the notable setback of being limited to use in settings with five or fewer HDDs. While these smaller NAS units are commonplace in SMB and SOHO environments, there is a need for a more scalable solution for datacenter use. The WD Se can scale all the way up to 24+ NAS ports.
The WD Se series is validated with extended burn-in testing with thermal cycling prior to use to ensure reliability. RAFF (Rotary Acceleration Feed Forward) works in conjunction with the Multi-Axis Shock Sensors to provide dual axis shock detection, allowing the Se to adjust to vibrations. In high-vibration datacenter environments, this is an important feature. StableTrac also helps mitigate the impact of vibration by securing the motor shaft at both ends.
Dual Actuator Technology fine tunes head positioning to increase accuracy. This works in concert with the Dynamic Fly-height technology to adjust the head of the drive dynamically to provide the best performance.
TLER (Time-Limited Error Recovery) allows for improved error handling in a RAID/NAS environment. The WD Se also features a self-encryption option and dual processors for enhanced performance.
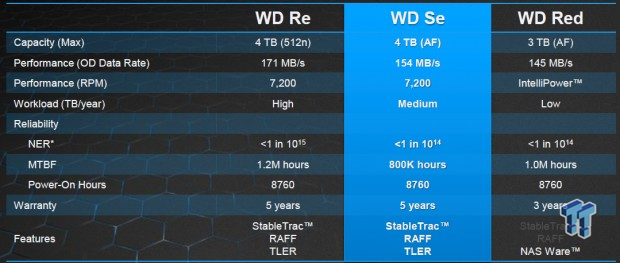
The WD Se has a lower MTBF (800,000 hours) than the Red and Re models. The Se utilizes the Advanced Format 4K sectors and includes features not found on the WD Red series of HDDs. For those looking for a higher capacity Red, the Se makes a good fit with its option of a 4TB model. The Se also features a lower NRE of 1E14.
WD Se Internals


The WD Se comes in a 3.5" form factor and has a SATA 6Gb/s connection. The PCB is fastened with multiple screws on the bottom of the drive. The drive has five platters, with 800GB per platter, on the 4TB model we are testing.


When we remove the PCB, we observe the thermal padding in the interior of the HDD. This allows PCB components to shed heat into the interior of the drive.
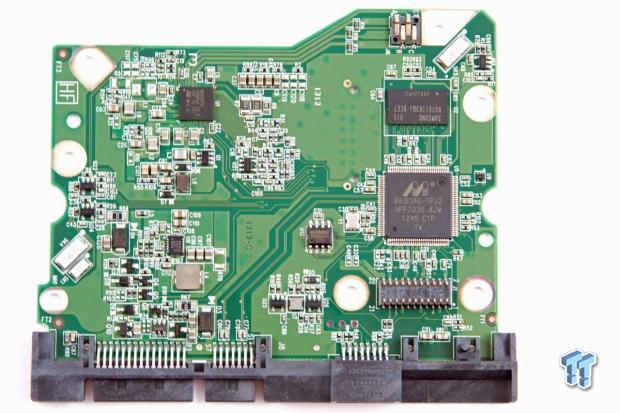
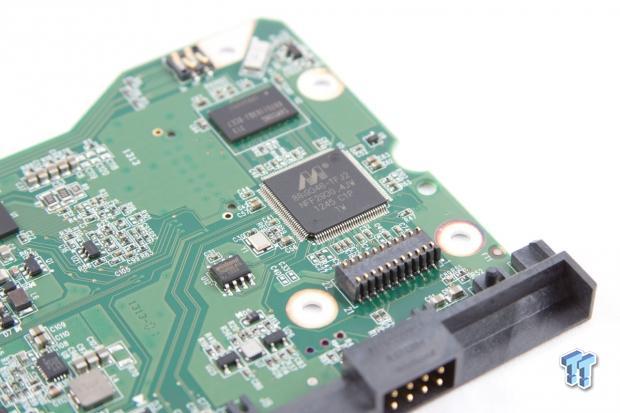
The Samsung cache chip holds 64 MB of cache buffer, and the Marvell 88i9346-TFJ2 controller sets atop the other components.
Test System and Methodology


We utilize a new approach to HDD and SSD storage testing for our Enterprise Test Bench, designed specifically to target long-term performance with a high level of granularity.
Many testing methods record peak and average measurements during the test period. These average values give a basic understanding of performance, but fall short in providing the clearest view possible of I/O QoS (Quality of Service).
'Average' results do little to indicate the performance variability experienced during actual deployment. The degree of variability is especially pertinent, as many applications can hang or lag as they wait for I/O requests to complete. This testing methodology illustrates performance variability, and includes average measurements, during the measurement window.
While under load, all storage solutions deliver variable levels of performance. While this fluctuation is normal, the degree of variability is what separates enterprise storage solutions from typical client-side hardware. Providing ongoing measurements from our workloads with one-second reporting intervals illustrates product differentiation in relation to I/O QOS. Scatter charts give readers a basic understanding of I/O latency distribution without directly observing numerous graphs.
Consistent latency is the goal of every storage solution, and measurements such as Maximum Latency only illuminate the single longest I/O received during testing. This can be misleading, as a single 'outlying I/O' can skew the view of an otherwise superb solution. Standard Deviation measurements consider latency distribution, but do not always effectively illustrate I/O distribution with enough granularity to provide a clear picture of system performance. We use histograms to illuminate the latency of every single I/O issued during our test runs.
We measure power consumption during test runs. This provides measurements in time-based fashion, with results every second, to illuminate the behavior of power consumption in steady state conditions. Power consumption can cost more over the life of the device than the initial acquisition price of the hardware itself. This significantly affects the TCO of the storage solution. We also present IOPS-to-Watts measurements to highlight the efficiency of the storage solution.
Our test pool features HDDs of varying capacity, so it is important to bear this in mind when viewing results. We conduct our tests over the full LBA range to allow each HDD to highlight its top performance. In some cases, this approach can give slower speed, and higher capacity, HDDs a slight advantage in test results due to a longer 'dwell' time on outer tracks. Typically, this is not a concern when testing HDDs of similar speeds and capacities. The first page of results will provide the 'key' to understanding and interpreting our new test methodology.
4K Random Read/Write
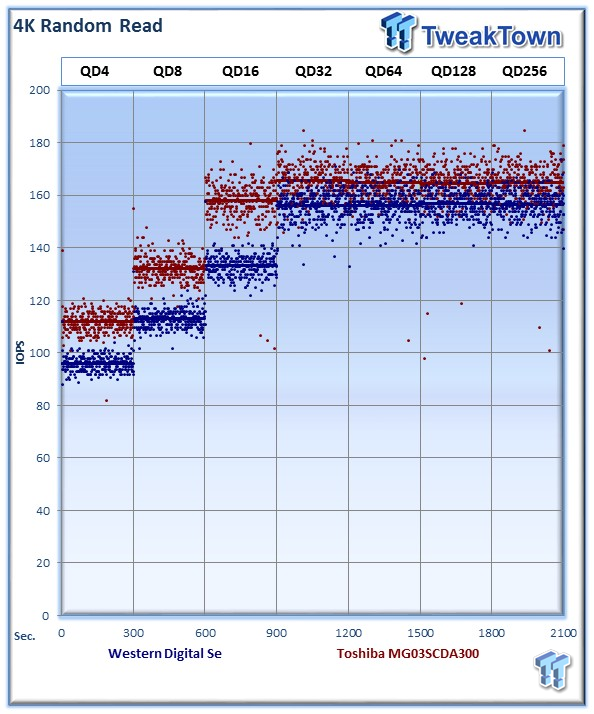
Each QD for every parameter tested includes 300 data points (five minutes of one second reports) to illustrate the degree of performance variability. The line for each QD represents the average speed reported during the five-minute interval.
4K random speed measurements are an important metric when comparing drive performance, as the hardest type of file access for any storage solution to master is small-file random. One of the most sought-after performance specifications, 4K random performance is a heavily marketed figure.
The Western Digital Se averages 156 IOPS at QD256, but is beat slightly by the Toshiba MG03SCA300.
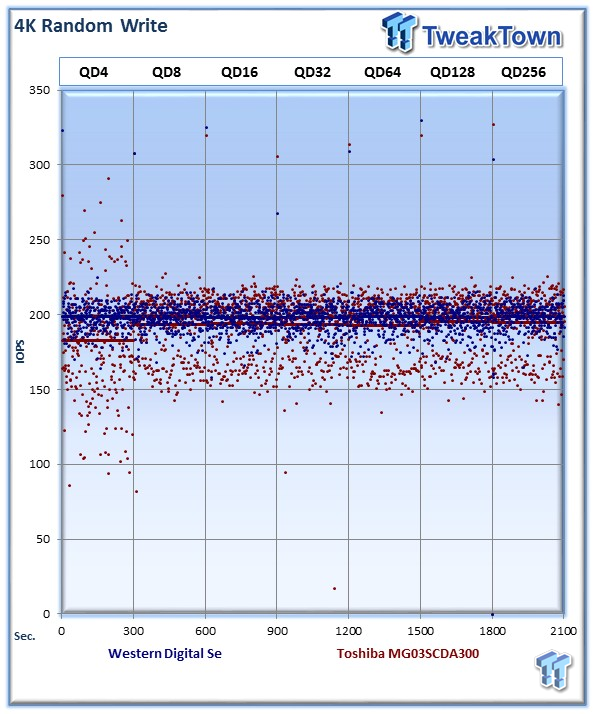
The Toshiba drive has higher performance spikes with 4K random writing, but we observe that the significant variability leads to a lower average. The WD Se averages 198 IOPS at QD256.

Our write percentage testing illustrates the varying performance of each solution with mixed workloads. The 100% column to the right is a pure write workload of the 4K file size, and 0% represents a pure 4K read workload.
The WD Se follows a predictable curve as we mix in write activity, but manages to keep a tighter performance profile than the Toshiba HDD.

The WD Se provides 57,124 I/O's (96.41%) at 100-200ms, and the remaining 2,108 I/O's (3.55%) in the 200-400ms range. The Toshiba MG03SCA300's recorded latency range spans from 80-600ms.

We record the power consumption measurements during our test run at QD256. The WD Se consumes an average of 8.65 Watts.


IOPS to Watts measurements are generated from data recorded during our test. The WD Se delivers an average of 28 IOPS per watt for 4K random writes, and 22 IOPS per Watt for 4K random read.
8K Random Read/Write

8K random read and write speed is a metric that is not tested for consumer use, but for enterprise environments this is an important aspect of performance. With several different workloads relying heavily upon 8K performance, we include this as a standard with each evaluation. Many of our Server Emulations below will also test 8K performance with various mixed read/write workloads.
The WD Se delivers an average of 155 IOPS at QD256.

The average 8K random write speed of the WD Se is 196 IOPS at QD256. The Se performs well with random write activity, again resulting in a tighter performance range.

The WD Se exhibits a traditional curve with slightly slower random read speed than random write speed.

The WD Se delivers a consistent 95.72% of I/O's (56,003) at 100-200ms, and 2,499 I/O's (4.27%) at 200-400ms.

Power consumption for the WD Se averages 9.41 Watts during the measurement window.


The WD Se delivers solid performance with an average of 20 IOPS per Watt in 8K random write, and 16 IOPS for 8K random read.
128K Sequential Read/Write

The 128K sequential speeds reflect the maximum sequential throughput of the SSD using a realistic file size encountered in an enterprise scenario.
The WD Se averages 160 MB/s at sequential read, with a very tightly defined performance range again benefiting the overall average score.

The WD Se averages the same impressive 190 MB/s in sequential write speed.

The WD Se trails the Toshiba MG03SCA300 in the 10-40% write percentage testing, but manages to come back on top as we mix in heavier write workloads.

The WD Se offers up 99.98% of requests in the 20-40ms range.

The WD Se averages 9.25 Watts during sequential write testing.


The WD Se provides 16 MB/s per Watt for 128K sequential read and write.
Database/OLTP and Webserver
Database/OLTP
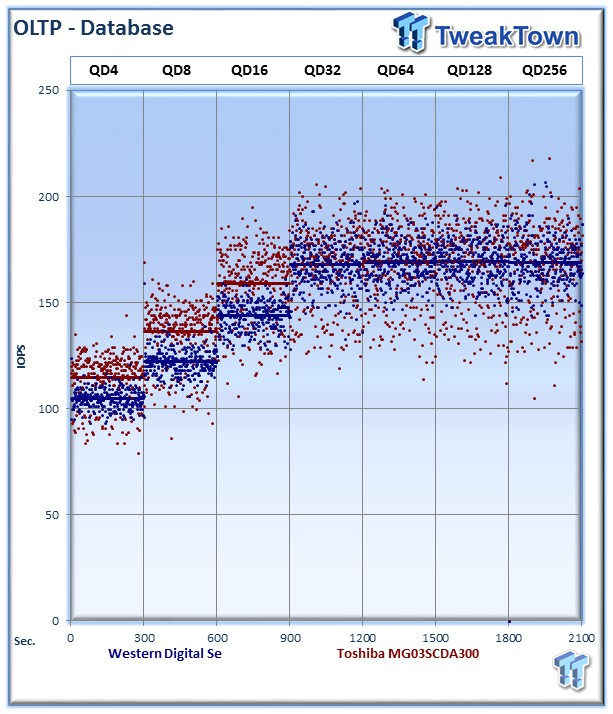
This test emulates Database and On-Line Transaction Processing (OLTP) workloads. OLTP is in essence the processing of transactions such as credit cards and high frequency trading in the financial sector. Enterprise SSDs are uniquely well suited for the financial sector with their low latency and high random workload performance. Databases are the bread and butter of many enterprise deployments. These are demanding 8K random workloads with a 66% read and 33% write distribution that can bring even the highest performing solutions down to earth.
The WD Se averages 169 IOPS at QD256, matched closely by the Toshiba MG03SCA300.
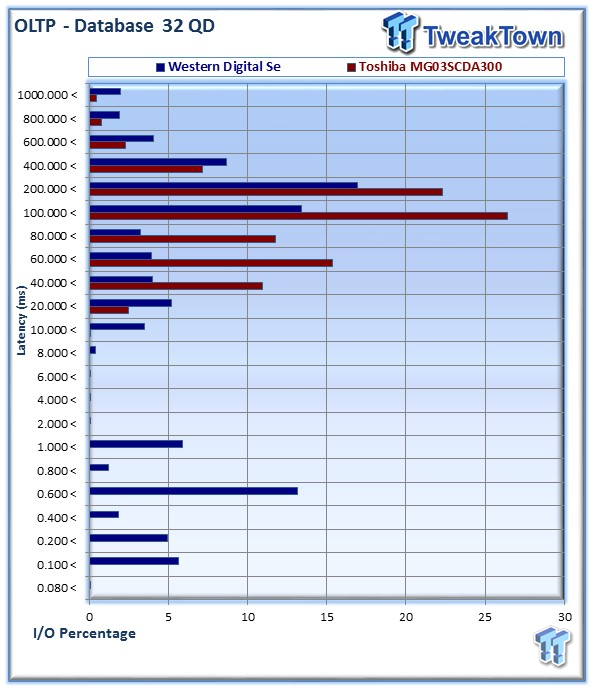
The WD Se offers up a much wider range of latency recordings than the Toshiba HDD with this mixed workload.

The WD Se averages 9.25 Watts.

The WD Se averages 17.7 IOPS per Watt.
Webserver

The Webserver profile is a read-only test with a wide range of file sizes. Web servers are responsible for generating content for users to view over the internet, much like the very page you are reading. The speed of the underlying storage system has a massive impact on the speed and responsiveness of the server that is hosting the website, and thus the end-user experience.
The WD Se averages 154 MB/s at QD256.

The WD Se provides a wide range of latency variability, from 6ms all the way up to our maximum of 1000ms.

The WD Se averages 9.4 Watts.

The WD Se averages 16 IOPS per Watt.
Fileserver and Emailserver
Fileserver

The File Server profile represents typical file server workloads. This profile tests a wide variety of different file sizes simultaneously, with an 80% read and 20% write distribution.
The WD Se averages 207 IOPS at QD256, pulling away easily from the Toshiba.

The WD Se again exhibits much more latency variability than the Toshiba HDD.

The WD SE averages 9.4 Watts.

The WD Se averages 16 IOPS per Watt.
Emailserver

The Emailserver profile is a very demanding 8K test with a 50% read and 50% write distribution. This application is indicative of the performance of the solution in heavy write workloads.
The WD Se averages 178 IOPS at QD256.

The WD Se again exhibits a wide range of latency variability.
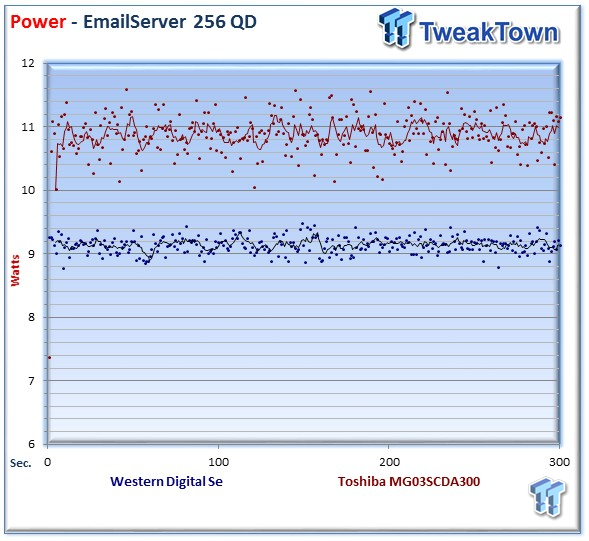
The WD Se averages 9.14 Watts.
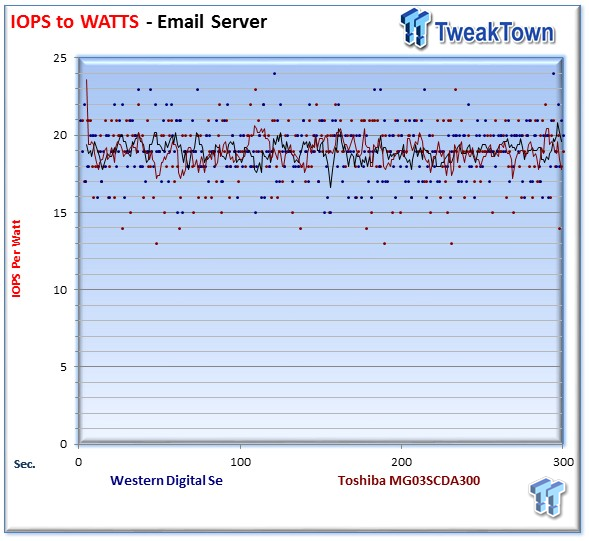
The WD Se averages 19 IOPS per Watt.
Final Thoughts
The WD Se fills a niche that is growing rapidly in the datacenter: the need to store large amounts of unstructured data in an economical manner. Tailoring the Se to deliver enterprise-class features for environments that have less-intense workloads provides a much-needed high capacity storage tier in the datacenter.
The 3.5" SATA 7,200 RPM WD Se will find itself at home in bulk cloud storage, replicated environments, content delivery networks, SMB network attached storage (NAS), and backup and archiving roles. For those with heavier workloads, WD also offers the Re and Xe models to address performance challenges.
We compared the WD Se to the Toshiba MG03SCA300 in a showdown of two enterprise-class 7,200 RPM HDDs designed for Tier-2 workloads. The WD Se delivered lower power consumption in our testing, with a large difference separating the two HDD's. This can be misleading due to the higher performance offered form the Toshiba in many workloads. However, this benefits the Se in scalable environments. The WD Se will spend a significant amount of time in spin-down or low power states in its intended environment. In our IOPS-to-Watts testing, the two HDDs traded blows, with the Toshiba MG03SCA300 typically leading in the read IOPS-to-Watts category. The WD Se tends to provide a better power ratio in write environments.
In performance testing, the WD Se offered a tighter performance range in our 4K and 8K testing. When we subjected the Se to mixed workloads, we witnessed significant latency variability. This is not entirely surprising with WD's focus on providing an economical mass-storage layer. The Toshiba MG03SCA300 is better suited for mixed workloads. The WD Se performed well in our Fileserver testing, though we observed the distinct latency distribution that penalizes the Se in heavier workloads.
In sequential workloads, likely a large part of the WD Se's workload in the datacenter, the WD Se excelled and provided a very consistent level of performance. Sequential performance is one of the key differentiators for the Se models. The Se offers up 171 MB/s, the Re SAS 182 MB/s, the Re SATA 171 MB/s and the Red offers 145 MB/s. This provides a tiered approach for multiple workloads. The Se might also find a home among existing Red users who require a larger capacity of 4TB. The Red series currently tops out at 3TB.
With intense qualification for the Se series, WD has put the drives through five million hours (570 years) of functional and thermal testing and an additional 20 million hours of actual workload validation; WD has done their homework with the WD Se series of HDDs. There is also an extended burn-in test with thermal cycling for each HDD manufactured.
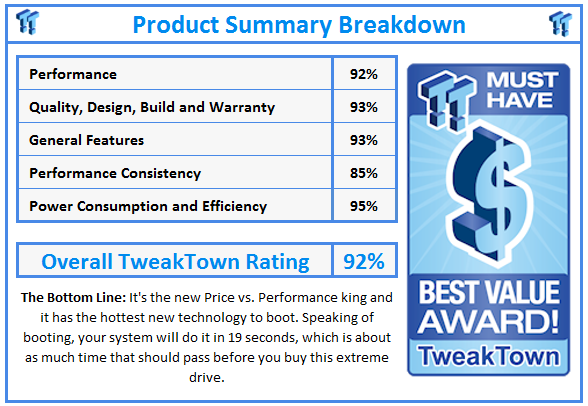
The WD Se provides a low-cost solution that addresses the needs of today's massive scale out architectures. The Se also delivers low power consumption and a host of enterprise class features to meet the five year warranty. For those that utilize the WD Se in its intended environments where capacity is more important than speed, it will provide a value that is hard to match, winning it TweakTown's Best Value Award.

 United
States: Find other tech and computer products like this
over at
  United
Kingdom: Find other tech and computer products like this
over at
  Australia:
Find other tech and computer products like this over at
  Canada:
Find other tech and computer products like this over at
  Deutschland:
Finde andere Technik- und Computerprodukte wie dieses auf