Introduction
It has been a little while since we have had an ASRock P55 board up on the bench. The last one was the when the Lynnfield CPUs launched. At the time it was the P55 Deluxe. This board featured a handy little SATA 3.0 add-in card and was an excellent performer.
Well, today we get to head back to the ASRock camp and see if another of their P55 boards can live up to the performance and quality we are getting used to from ASRock. This board is the no-frills P55DE3.
The P55DE3 is a very inexpensive board as far as P55s go. You can pick one up from Newegg.com for $99.99. So let's see if ASRock can still offer great performance and overclocking at this lower price.
The Box and What's Inside
Package and Contents
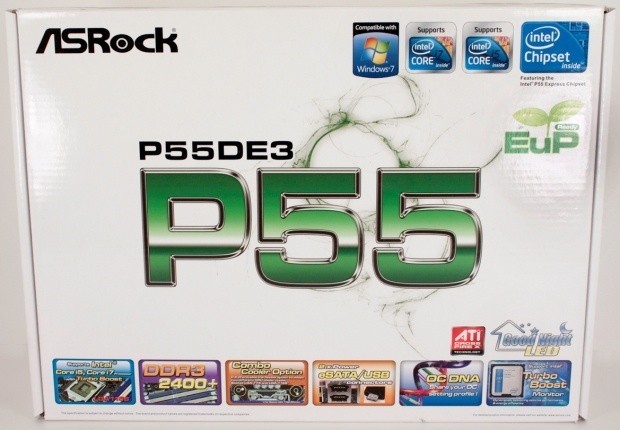
As we mentioned already, the P55DE3 is a no frills board. The box does not reflect this, though. Instead we see some of the typical hype about what you get with the P55DE3. This is not a bad thing, though; if you see this box in a local store for $100 you are more likely to pick this one up than a classy box that is $50-100 more.
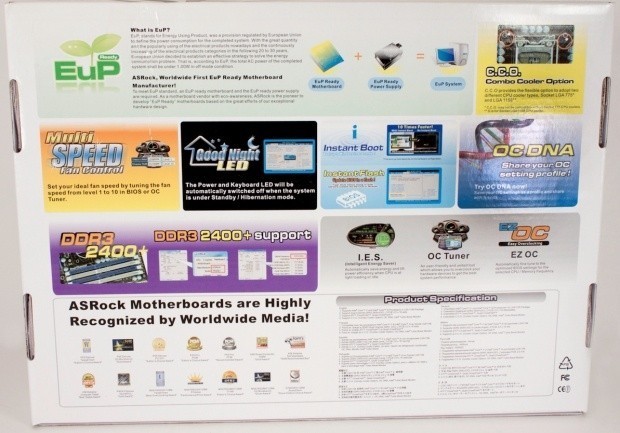
The back of the box continues with the information overload and goes into a little more detail about some of the more interesting features.
If you had any doubts about our "no-frills" comment, just take a look at the included accessories.
The Motherboard
The Board
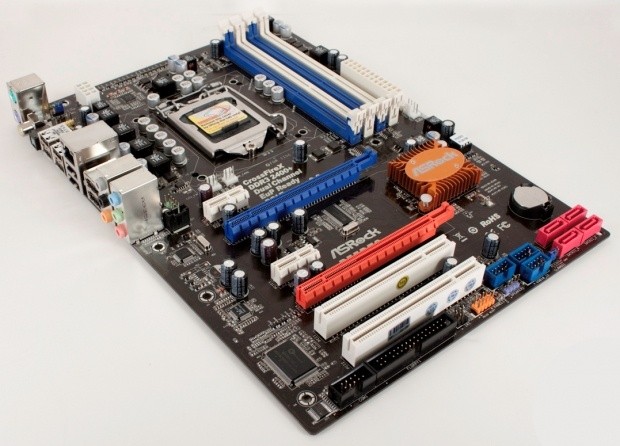
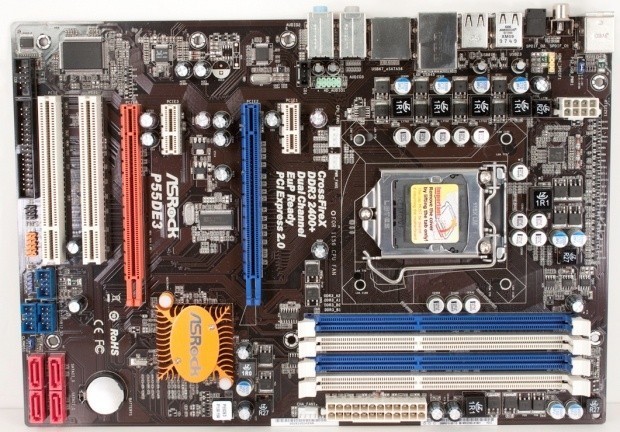
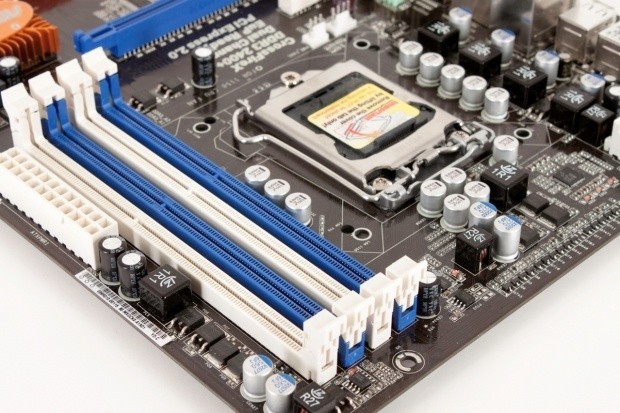
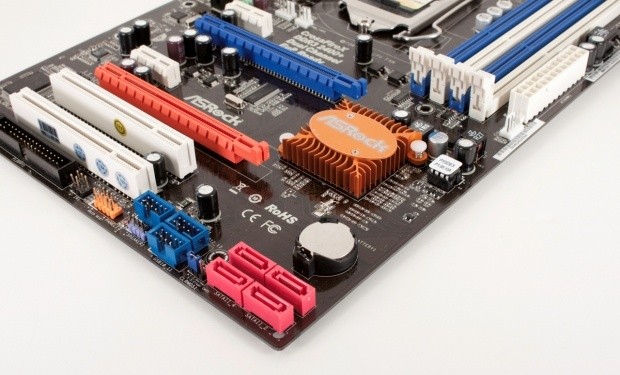
The ASRock P55DE3 is a clean looking board. It is obvious from even the first glance that ASRock meant this board to be slender in terms of junk thrown on it.
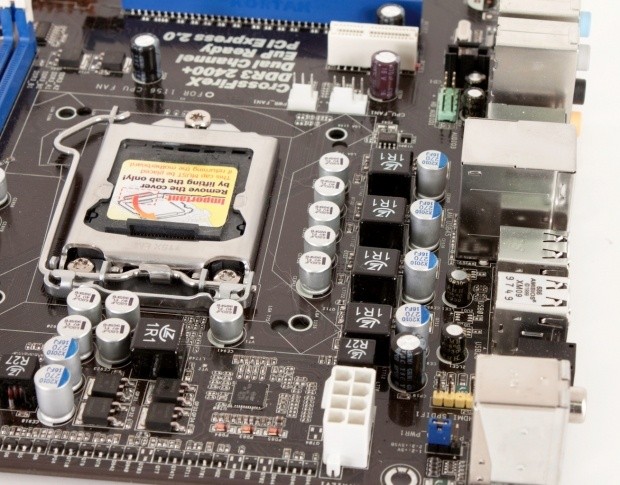
Looking at the top of the board, we see that while ASRock has put some money into solid capacitors for the CPU, they have not done so for the whole board. You can clearly see two traditional capacitors right above the power socket.
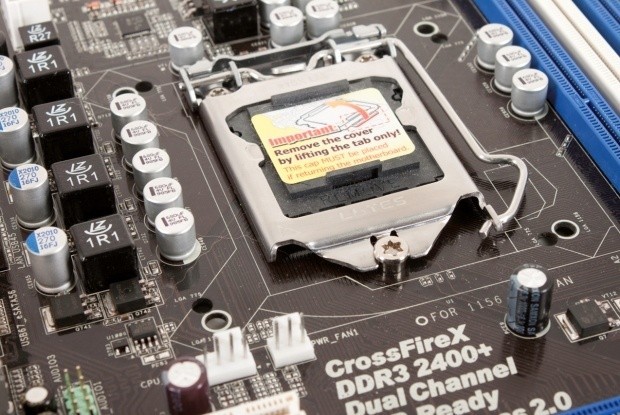
Looking at the placement, it would appear that ASRock carefully chose the ones to put more money into. Overall, the layout in this upper area is clean and surprisingly is not covered by any of the usual heatsinks you see on other boards.
For those of you that worry about this type of thing, ASRock has put a Lotes CPU hold down on the P55DE3.
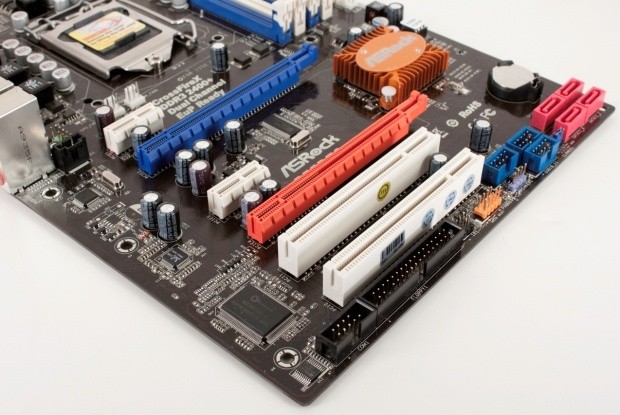
Looking at the lower half of the board, we see a fairly clean layout to the peripheral slots. Granted, there is one PCI slot that will go away if you use two dual height GPUs, but that is nothing unique to ASRock.
Interestingly enough, while there is a Floppy connector at the bottom of the board, there is no spot for a PATA drive. I think many would have preferred the PATA port over the floppy, but as there are still quite a few people using Windows XP, that floppy port comes in handy for installing new RAID and SATA drivers.
Looking at the lower-right corner, we see again that this is a budget board. Unlike many boards, you are not getting six SATA ports (or, is it 50 now?!). Instead ASRock has opted for a slimmed down four SATA ports.
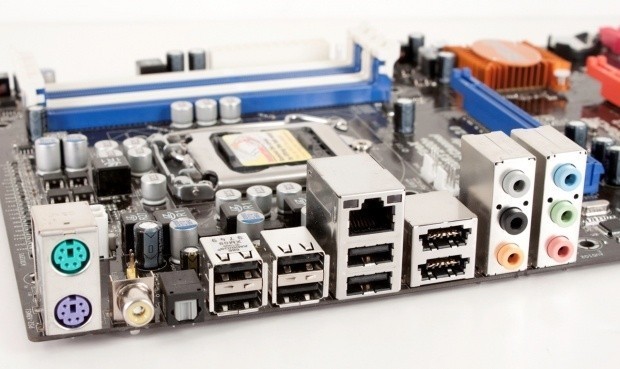
The I/O ports are also typical of what you expect to see these days on a P55 board, although soon the lack of USB 3.0 will be noticeable as more companies put this on.
BIOS and Overclocking
BIOS
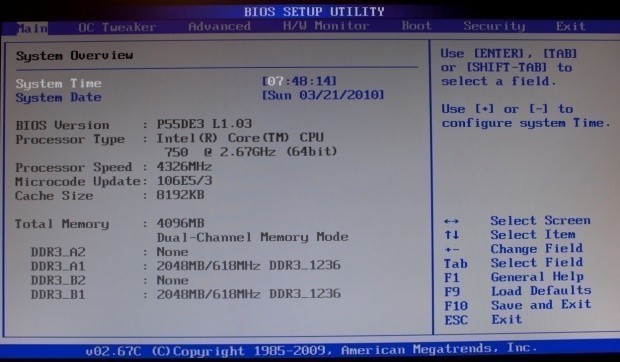
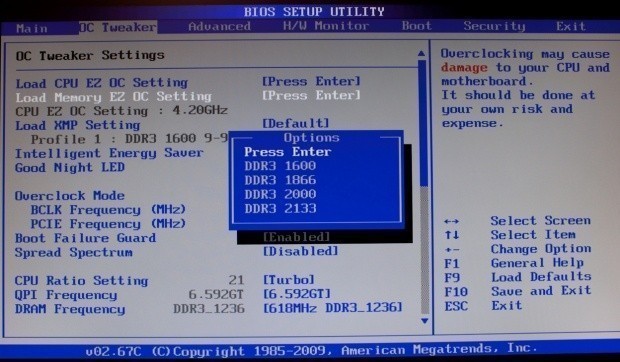
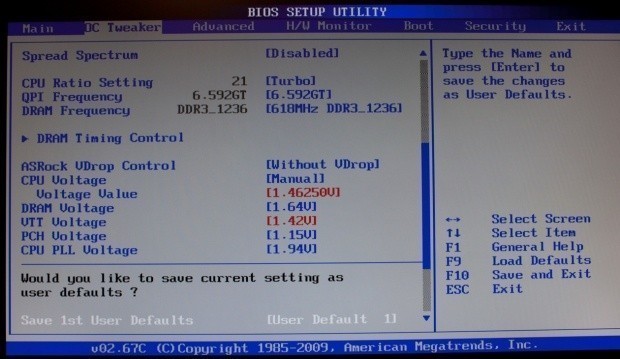
The BIOS we find on the P55DE3 is the now familiar AMI bios. It has the same features for tweaking your system that we have come to enjoy on other ASRock boards like the X58 Extreme and the P55 Deluxe.
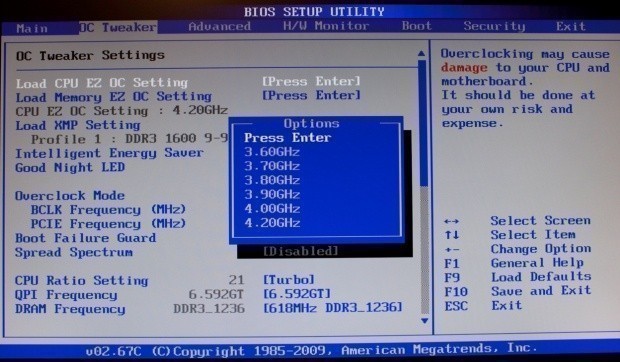
Two of the easiest features for newcomers to use are the CPU and Memory EZ OC Settings. These can automatically bump up your CPU or memory to the desired speed and also adjust all of the proper voltages to attain that speed. Of course, it is not a guarantee, but it is nice not to need to tinker with everything if you are in a hurry to get going.
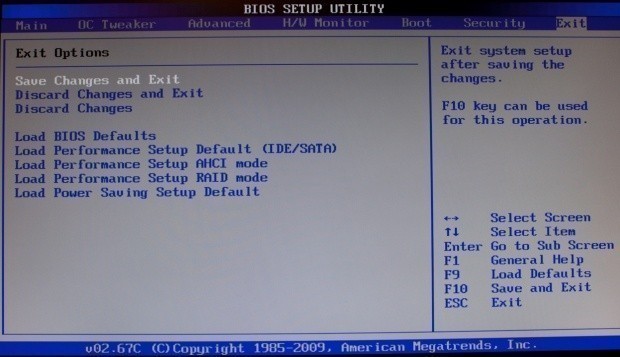
One item that I personally found interesting was the list of optimized BIOS settings you could load. They had quite a few that we aimed at HDD performance.
Overclocking
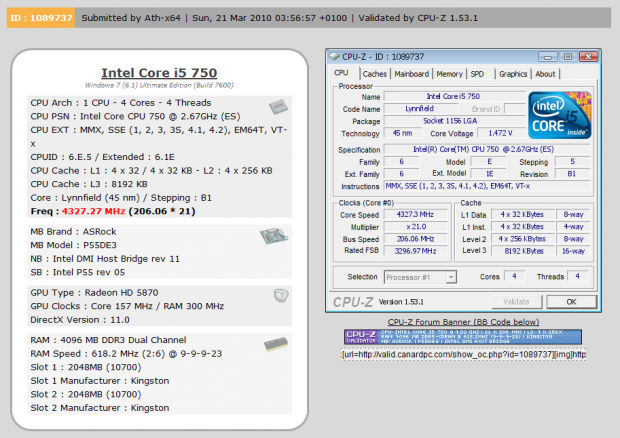
Overclocking the P55DE3 was a snap; I went into the BIOS, set the EZ OC setting for the CPU to 4.2GHz and pushed upwards from there. Once I had the base values set in the BIOS it was very simple to tweak them to the right spot. I was able to boot into Windows at just over 4.4GHz (211x21), but nothing, not even CPU-Z was stable.
Stepping backwards on the BCLK got me to 206x21 for a final stable clock of 4.327GHz. This is excellent and manages just a little past my previous best clock on this Core i5 750 by about 20MHz.
You can see the validation here.
Windows Overclocking Tools
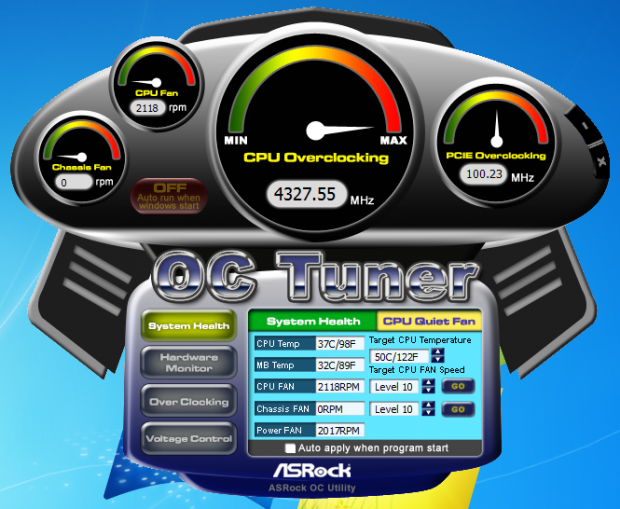
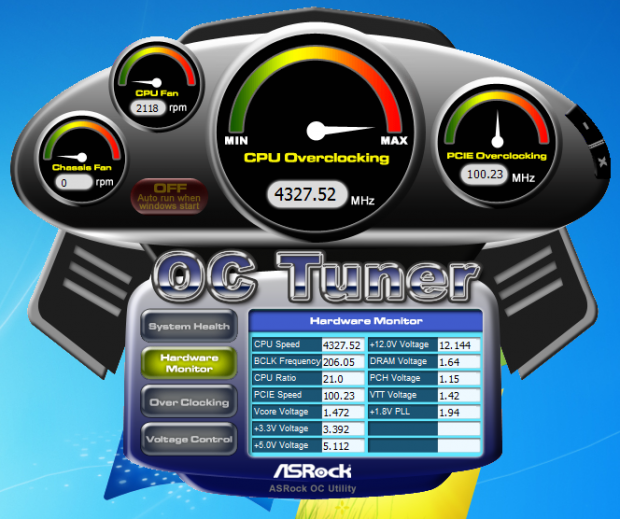
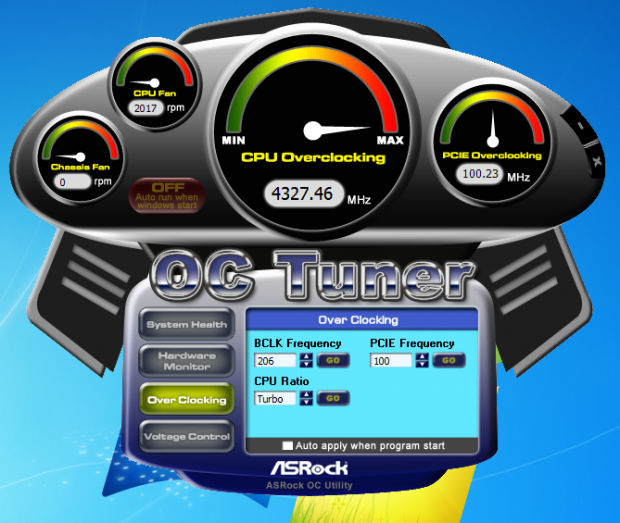
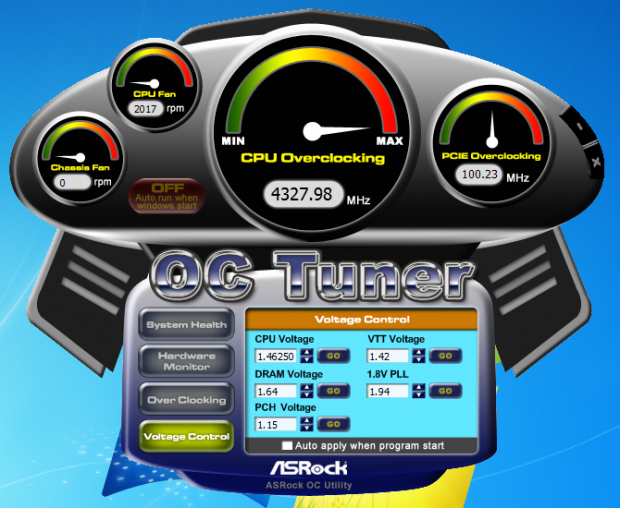
Of course, ASRock has also included some decent Windows based tools for overclocking. Although they are not the worst looking ones we have seen, they are still pretty tacky.
Although they might not look too great, they do offer fun.
As all overclocking results are dependent on the hardware you use, your results may vary. Results of our overclocking tests are included in the performance section with the stock scores.
Important Editor Note: Our maximum overclocking result is the best result we managed in our limited time of testing the motherboard. Due to time constraints we weren't able to tweak the motherboard to the absolute maximum and find the highest possible FSB, as this could take days to find properly. We do however spend at least a few hours overclocking every motherboard to try and find the highest possible overclock in that time frame. You may or may not be able to overclock higher if you spend more time tweaking or as new BIOS updates are released. "Burn-in" time might also come into play if you believe in that.
Test System Setup and Comments
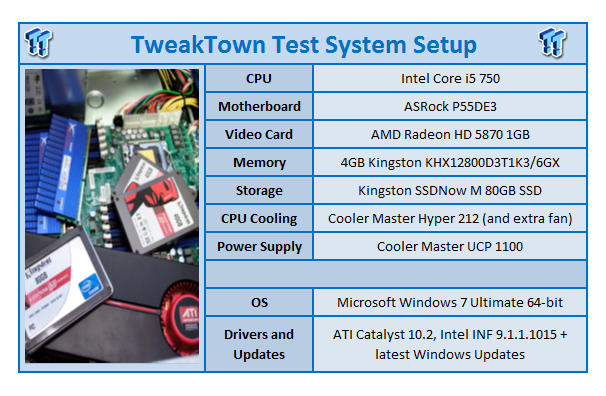
Comments
The setup and configuration of this board was a snap. I had no problems at all getting everything to play nicely. The spacing on the slots is great and even the vertical SATA ports did not cause any issues. Overclocking the P55DE3 was laughably simple, as I mentioned before (as well in other ASRock reviews), I simply picked the highest EZ OC setting and pushed the BCLK up from there until I topped out.
I do wish they had dropped a PATA port onto this board, but PATA CD/DVD-ROM drives are slowly disappearing and the SATA ones are getting very cheap and beginning to perform comparably to the older PATA style drives now (although there are some that still perform horribly). Still, with the nice and clean layout we had no issues of any importance to note during our testing of the ASRock P55DE3.
Synthetic Tests - Part I
With any system you will want to see a combination of synthetic testing and real-world. Synthetics give you a static, easily repeatable testing method that can be compared across multiple platforms. For our synthetic tests we use Everest Ultimate, Sisoft Sandra, Futuremark's 3DMark Vantage and PCMark Vantage, Cinebench as well as HyperPi. Each of these covers a different aspect of performance or a different angle of a certain type of performance.
Memory Bandwidth
Memory is a big part of current system performance. In most systems slow or flakey memory performance will impact almost every type of application you run. To test memory we use a combination of Sisoft Sandra, Everest and HyperPi 0.99.
Sisoft Sandra
Version and / or Patch Used: 2010c 1626
Developer Homepage: http://www.sisoftware.net
Product Homepage: http://www.sisoftware.net
Buy It Here
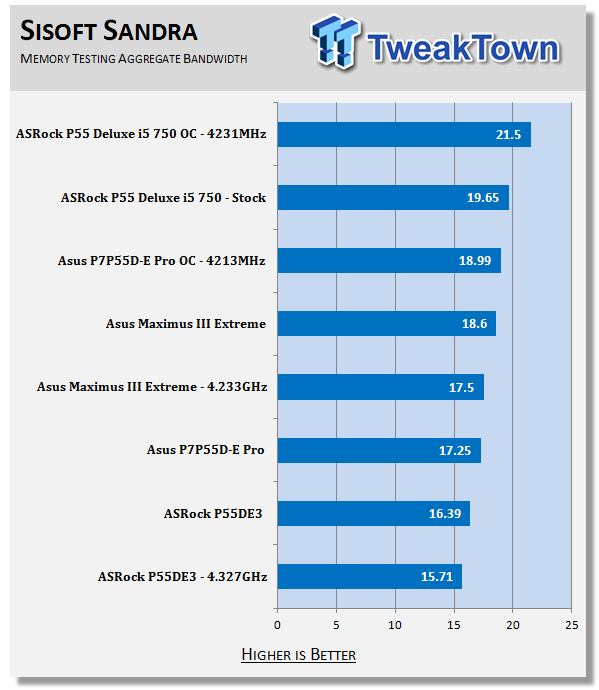
Our memory scores are not what we would have expected from a P55 board. The ASRock P55DE3 comes in at the bottom of the list where memory speed is concerned. We only hope this will not impact other performance greatly.
Everest Ultimate
Version and / or Patch Used: 5.30.1983
Developer Homepage: http://www.lavalys.com
Product Homepage: http://www.lavalys.com
Buy It Here
Everest Ultimate is a suite of tests and utilities that can be used for system diagnostics and testing. For our purposes here we use their memory bandwidth test and see what the theoretical performance is.
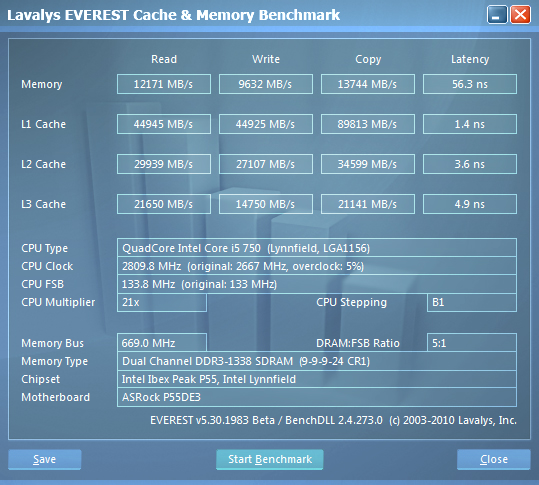
Stock Memory Performance
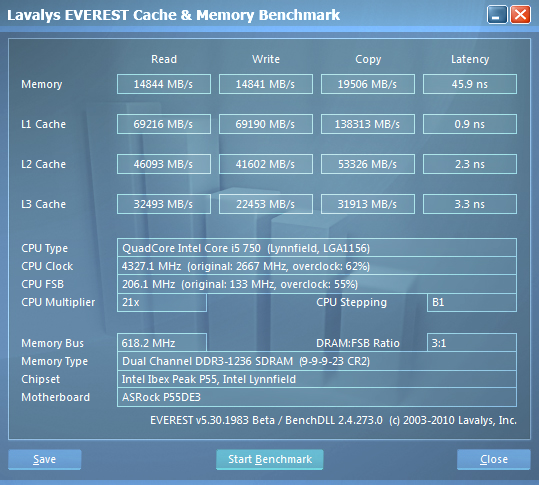
Overclocked Memory Performance
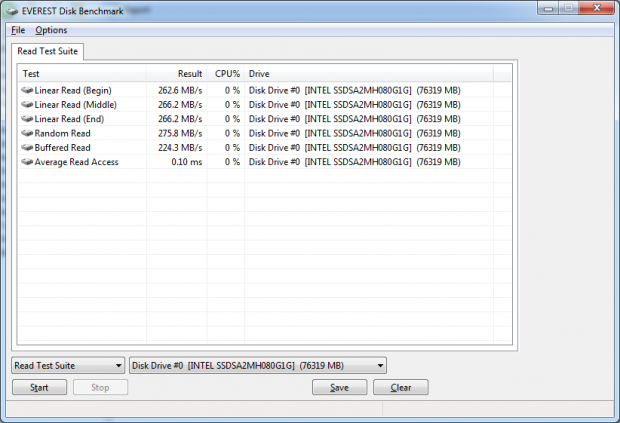
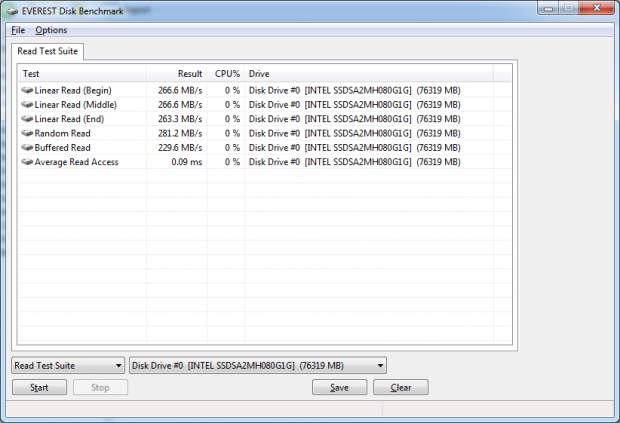
We see the same thing here with our Everest testing. If you do want more memory performance with this test, you can always enable C States in the BIOS for a few extra MB of bandwidth. It is important to remember that this will only affect benchmarks that are thread efficient.
HyperPi 0.99
Version and / or Patch Used: 0.99
Developer Homepage: www.virgilioborges.com.br
Product Homepage: www.virgilioborges.com.br
Download It Here
HyperPi is a front end for SuperPi that allows for multiple concurrent instances of SuperPi to be run on each core recognized by the system. It is very dependent on CPU to memory to HDD speed. The faster these components, the faster it is able to figure out the number Pi to the selected length.
For our testing we use the 32M run. This means that each of the four physical and four logical cores for the i7 and the four physical cores of the i5 is trying to calculate the number Pi out to 32 million decimal places. Each "run" is a comparative to ensure accuracy and any stability or performance issues in the loop mentioned above will cause errors in calculation.
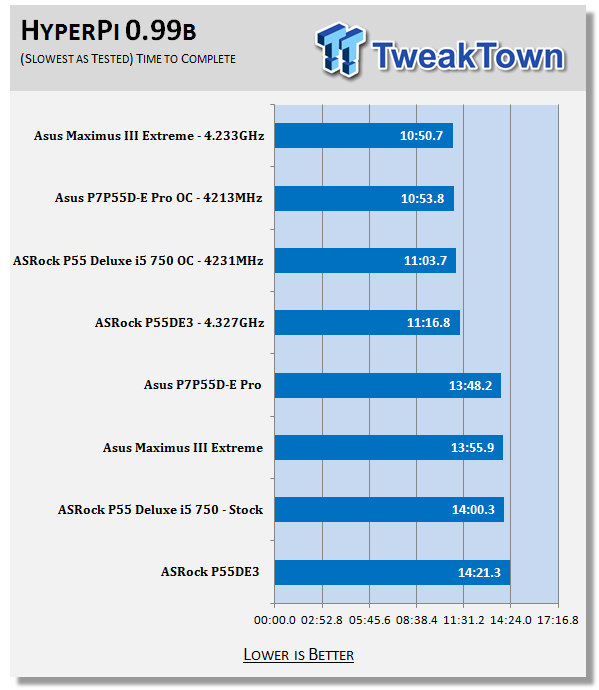
Ok, here we see the first casualty of the slower than expected memory performance. HyperPi is very memory dependent and the lack of available bandwidth impacts the time it takes the P55DE3 to finish the demanding 32M run.
Synthetic Tests - Part II
Disk Drive Controller
The system drive controller is an important part of system performance. In most modern boards your drive controller will run off of the PCI-e bus. The PCI-e bus performance can be affected by poor trace layout as well as many other design choices that show up on different boards.
For testing we use Sisoft's Sandra and Everest.
SiSoft Sandra
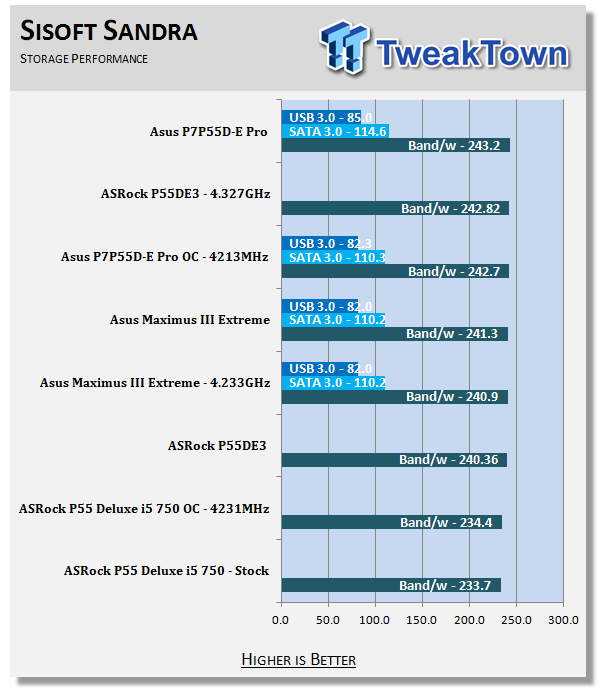
The P55DE3 is able to keep up with the rest of the P55 pack in terms of HDD (really, SSD) speed.
Everest
Stock HDD Performance
Overclocked HDD Performance
Again, HDD speed is where it needs to be.
Synthetic Tests - Part III
Here is where we dig out the FutureMark tests.
PCMark Vantage
Version and / or Patch Used: 1.0.0.0
Developer Homepage: http://www.futuremark.com/
Product Homepage: www.futuremark.com
Buy It Here
For overall system performance we use PCMark Vantage. This is run in both x86 and x64 mode to give the best indication of performance.
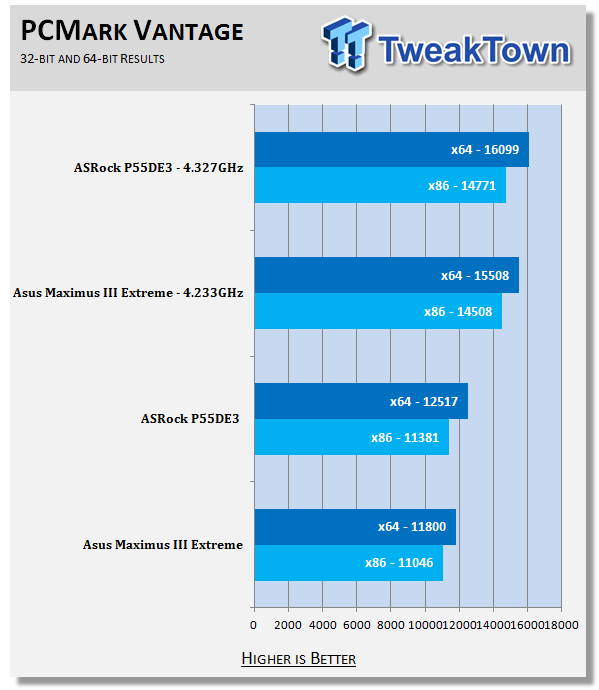
Here we see some good news. While the P55DE3 might have lower than expected memory performance, it has not hindered its PCMark scores at all.
3DMark Vantage
Version and / or Patch Used: 1.0.1
Developer Homepage: http://www.futuremark.com/
Product Homepage: www.futuremark.com
Buy It Here
For synthetic gaming tests we used the industry standard and overlockers bragging tool 3DMark Vantage. This is a test that strives to mimic the impact modern games have on a system. Futuremark went a long way to change from the early days of graphics driven tests to a broader approach including physics, AI and more advanced graphics simulations.
3DMark Vantage uses the DX10 API in addition to having support for PhysX. Due to the PhysX support and our use of an NVIDIA GPU, we run with PhysX enabled and disabled to give you the best indication of real system performance. For testing we use the Performance test run. We are also starting to add all three scores into our results to give you a better idea of the performance differences between different hardware.
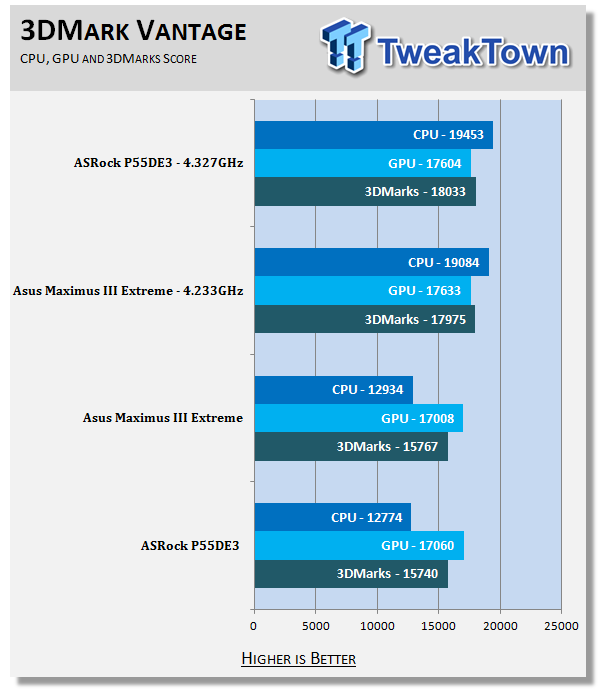
The P55DE3 is not the fastest board for 3DMark at stock speeds, but once we kick the CPU into high gear we easily outpace even the Maximus III Extreme.
Cinebench R11.5 x64
Version and / or Patch Used: R11.5
Developer Homepage: http://www.maxon.net/
Product Homepage: www.maxon.net
Download It Here
Cinebench is a synthetic rendering tool developed by Maxon. Maxon is the same company that developed Cinema4D, another industry leading 3D Animation application. Cinebench R11.5 tests your systems ability to render across a single and multiple CPU cores. It also tests your systems ability to process OpenGL information.
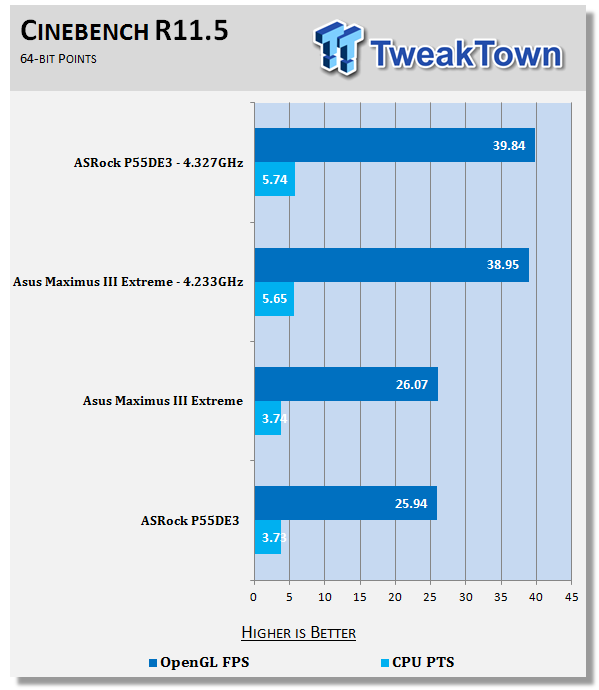
The P55DE3 does not do bad at all in Cinebench R11.5; it is only .01 point behind the Maximus III for CPU based rendering and about .13 frames per second off for the OpenGL testing.
Real-World Tests - Part I
Real-world testing allows us to see how well a product will perform when used in the same manner as it would be in your house or office. It is an important side to performance testing as it can uncover hidden glitches in the way a product performs.
It is especially true when testing a mainboard; there are so many components of a board that have to interact that any problems between parts can cause a failure of the whole.
For real-world testing we use some common applications and functions. We test with LightWave 3D for rendering performance, AutoGK for transcoding from DVD to AVI and two games for gaming testing.
Rendering
Rendering of 3D Animation is a system intensive endeavor. You need a good CPU, memory and HDD speed to get good rendering times. For our testing we use LightWave 3D. This software from Newtek is an industry standard and has several pre-loaded scenes for us to use.
To show better multi-thread performance we are also using perspective cameras which make heavy use of the ray tracing engine. We have also increased the resolution to 4k (4096 x 3072) to give the CPU even more to think about.
LightWave 3D
Version and / or Patch Used: 9.6
Developer Homepage: http://www.newtek.com
Product Homepage: http://www.newtek.com/lightwave/
Buy It Here
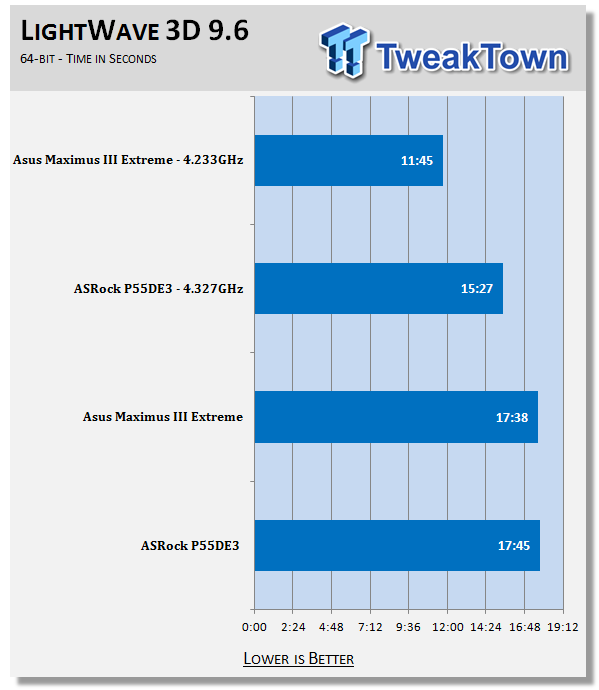
LightWave is another test that was hurt by the slow memory performance. Even with the much higher clock speed, the P55DE3 is not able to keep up. However, at stock we did only see a 7 second time difference in the same render.
AutoGK
Version and / or Patch Used: 2.55
Developer Homepage: http://www.autogk.me.uk/
Product Homepage: http://www.autogk.me.uk/
Download It Here
AutoGK stands for Auto Gordian Knot; it is a suite of transcoding tools that are compiled into an easy to install and use utility. It allows you to transcode non-protected DVDs and other media to Xvid or Divx format. For our testing purposes we use a non-DRM restricted movie that is roughly 2 hours in length. This is transcoded to a single Xvid AVI at 100% quality.
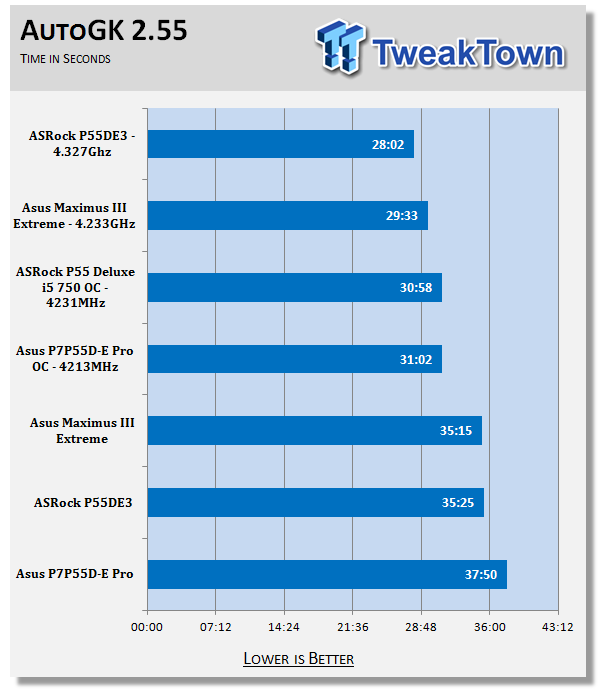
At stock speeds the performance difference between the ASRock P55DE3 and the Maximus III is very minimal. This shows that the board is a solid performer. Of course, once we pushed the CPU up to 4.3GHz it walks away from the competition.
Real-World Tests Part II
Here we have our real gaming tests. Each of the games we chose uses multiple cores and GPUs. They are able to stress the system through use of good AI. Both have decent positional audio that adds impact to the sound subsystem of the board. We ran each game through the level or parts listed and recorded frame per second using FRAPS. This brings the whole game into play.
*** A word on gaming as a CPU test; ***
Gaming is no longer a good indication of true CPU performance. As you push over 1024x768 resolutions you see the GPU take over and dominate the performance scale. This is even evident in 3DMark Vantage testing. The CPU score can be through the roof and still not add more than a handful of points to the overall score.
This does not mean the gaming is not of value for testing. It can show an issue with the CPU and gaming if the CPU is unable to meet the speed expected of a certain GPU. But for the most part you are not going to see great differences in performance between CPUs in high resolution gaming.
Call of Duty Modern Warfare 2 (DX9)
Version and / or Patch Used: 1.0
Timedemo or Level Used: First combat until the school is cleared
Developer Homepage: http://www.infinityward.com
Product Homepage: http://modernwarfare2.infinityward.com
Most of you know about the game Modern Warfare 2; it caused quite a bit of controversy in the latter half of 2009. The game is a first person shooter with a heavy combat emphasis. It follows the events in the first Modern Warfare very closely and brings back several characters from the original.
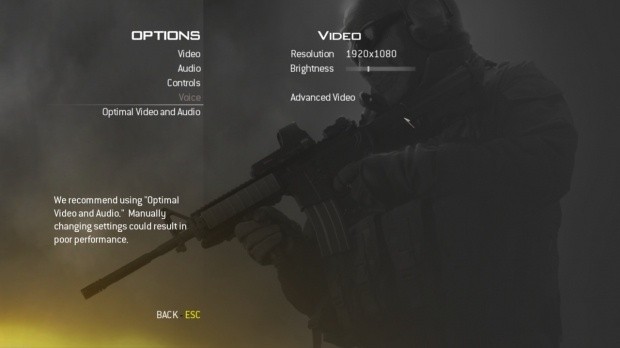
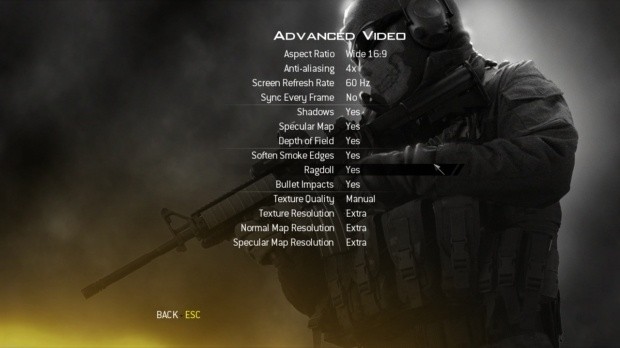
As with most games in the Call of Duty franchise, it features a heavy A.I. load. This is not because of a complex AI routine, but more due to the sheer number of enemies in any given combat situation. It is also our single DX9 based game in our testing suite. Settings are shown below.
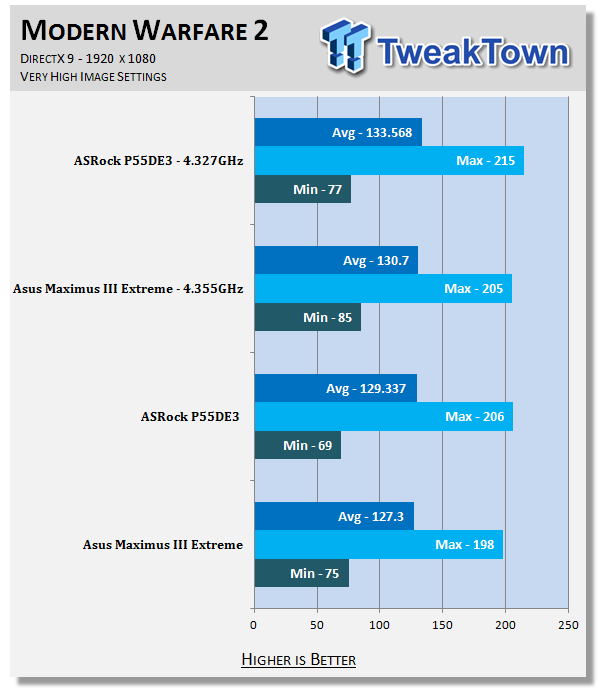
It looks like for the graphics presented in Modern Warfare 2, none of the boards in our testing group have any issues giving you outstanding performance. Even with the CPUs overclocked, the delta between the systems is only about 6 FPS.
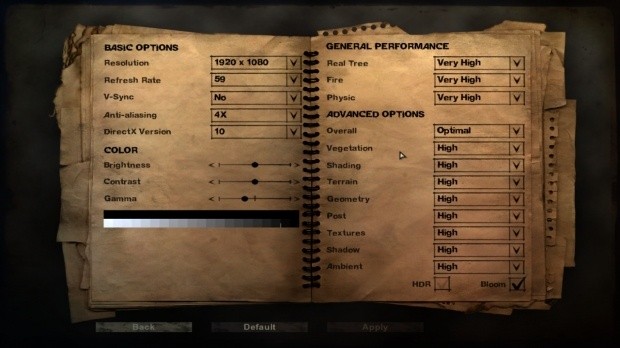
Far Cry 2 (DX10)
Version and / or Patch Used: V1.00
Timedemo or Level Used: Clearing the Safe house through to the Rescue
Developer Homepage: http://www.ubi.com
Product Homepage: http://farcry.us.ubi.com
Far Cry 2 is a large sandbox style game. There are no levels here so as you move about the island you are on you do not have to wait for the "loading" sign to go away. It is mission driven so each mission is what you would normally think of as the next "level".
In the game you take the role of a mercenary who has been sent to kill the Jackal. Unfortunately your malaria kicks in and you end up being found by him. Long story short, you become the errand boy for a local militia leader and run all over the island doing his bidding. Settings we used for testing are shown below.
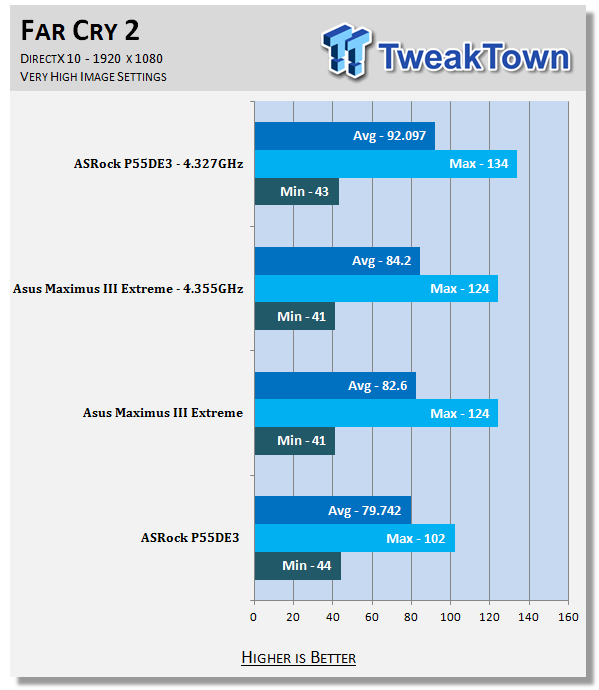
Again we see very similar numbers between the boards in the testing group. We did note that the P55DE3 was about 5 FPS slower at stock speeds with this game. However, you would probably not ever be able to tell if you were actually sitting at either system and playing the game.
Battlefield Bad Company 2 (DX11)
Version and / or Patch Used: V1.00
Timedemo or Level Used: From washing up on the beach to the mine fields.
Developer Homepage: http://www.ea.com/
Product Homepage: http://badcompany2.ea.com/
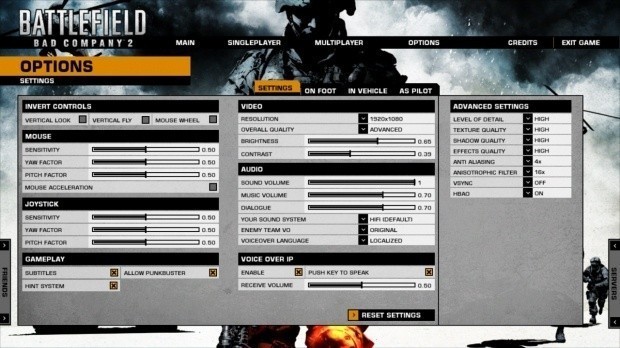
Battlefield Bad Company is another sequel and also another game "franchise". Bad Company 2 is also our DX11 Shooter game. The game follows a fictitious B company team on a mission to recover a Japanese defector. This puts you back in World War II (at least for the beginning of the game) while the multi-player game is centered on much more modern combat. For our testing we used the single player mode. Settings are shown below.
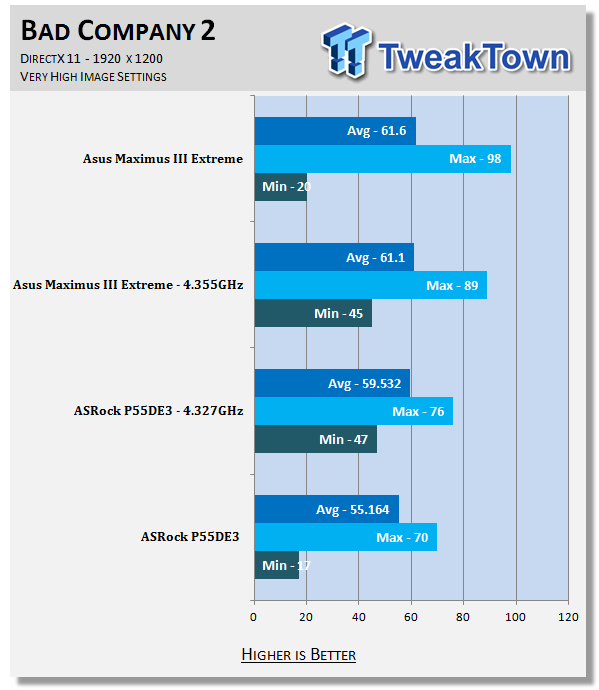
For some reason the P55DE3 did not do quite as well as it did in the other games we use for testing. Again, the difference is minimal and probably not noticeable during actual play, but it is something to be aware of.
Gaming Conclusion
The P55DE3 is a good gaming board. It holds its own (although with a slightly lower FPS) even at stock speeds when compared to a much higher-end motherboard. It would be interesting to see what this board could do with a Crossfire pair of GPUs. If gaming is your thing and you are looking for a low priced board, the P55DE3 might be the one for you.
Power Usage and Heat Tests
Power Consumption
We are now able to find out what kind of power is being used by our test system and the associated graphics cards installed. Keep in mind; it tests the complete system (minus LCD monitor, which is plugged directly into an AC wall socket).
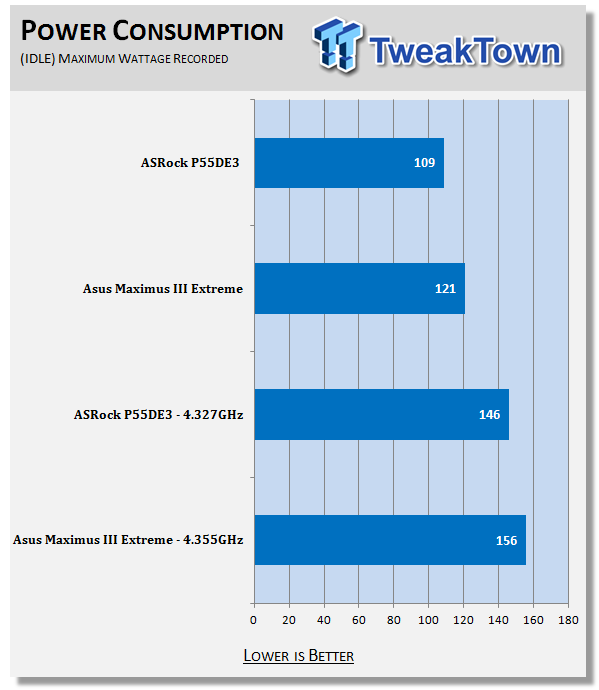
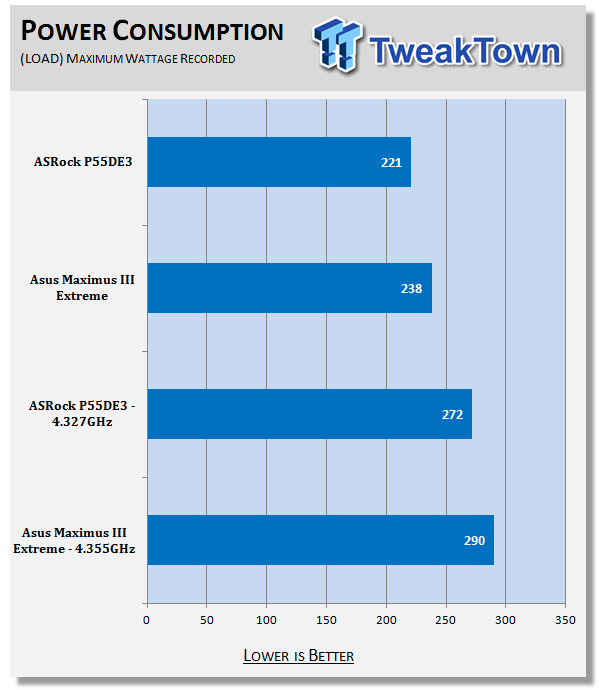
At both stock and overclocked speeds the ASRock P55DE3 shows us much more efficient power usage.
Heat Generation
As a new measure, we are now monitoring the heat generation from the key components on the motherboard; this being the Northbridge, Southbridge (if it contains one) as well as the Mosfets around the CPU. The results are recorded at idle and load during the power consumption tests.
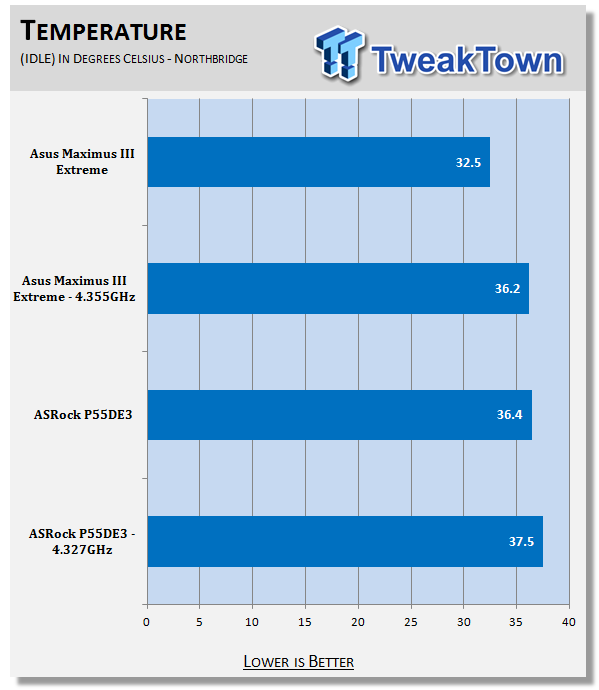
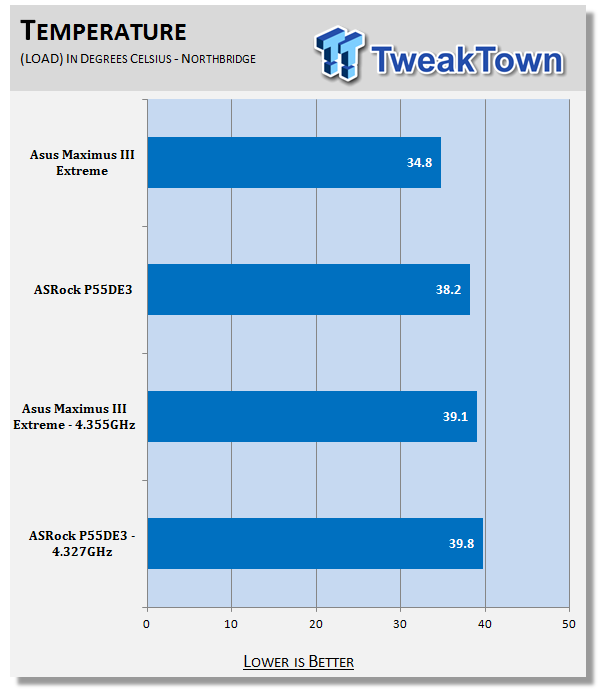
Unfortunately the small heatsink over the P55 chipset combined with the heat generated by the HD 5870 push the temperatures on the ASRock P55DE3 up.
Final Thoughts
I have to say that I am very impressed with the ASRock P55DE3. It is a solid performer (with the exception of memory performance) and an excellent overclocking board. I was outright surprised when I hit 4.3GHz stable on this board. I really did not expect anything that high.
The P55DE3 is priced at $99.99 on Newegg.com. This makes it one of the lowest priced P55 boards you can pick up. True, it does not have SATA 3.0 or USB 3.0, but considering the price on those drives and peripherals, I did not expect to see them on what is clearly a value based product.
Still, while the price may say value, the performance certainly does not. We do have to say that there is an issue with memory bandwidth, but that is something that can probably be corrected with a BIOS update.
To wrap things up; the P55DE3 is a great board at a great price. It surprised us more than once during our testing and is a motherboard we can highly recommend if you are looking to keep to a budget.

