


Our Verdict
Introduction and Pricing
We are almost six months into Alder Lake, and Intel has resumed its KS series, the last time being with 9th Gen Core processors with the 9900KS. This serves to further enhance the performance of its Alder Lake architecture at the cost of increased TDP as base power has been upgraded to 150W from the 125W of the 12900K, but the maximum turbo power has stuck; both the K and KS showing 241W.
We still have the hybrid architecture using "Golden Cove" high-performance P-Cores and "Gracemont" Efficient E-Cores. The 12900KS is the new flagship offering with an 8+8 design with added HT on the P-Cores, essentially the same design as 12900K.
The increased TDP also allows Intel to offer higher performance by bumping up the clocks of the CPU. The base clock for the P cores has been nudged 200MHz to 3.4GHz, while the E cores took an extra 100MHz. Turbo frequencies have also been altered, 100MHz to E cores and P cores, while Turbo Boost Max gains 300MHz from 5.2GHz to 5.5GHz.
The MSRP of the Intel Core i9 12900KS comes in at $749.99.
Packaging and Test System
Intel Core i9-12900KS
Best Deals: Intel Core i9-12900KS "Alder Lake" CPU
Prices last scanned 33 minutes ago
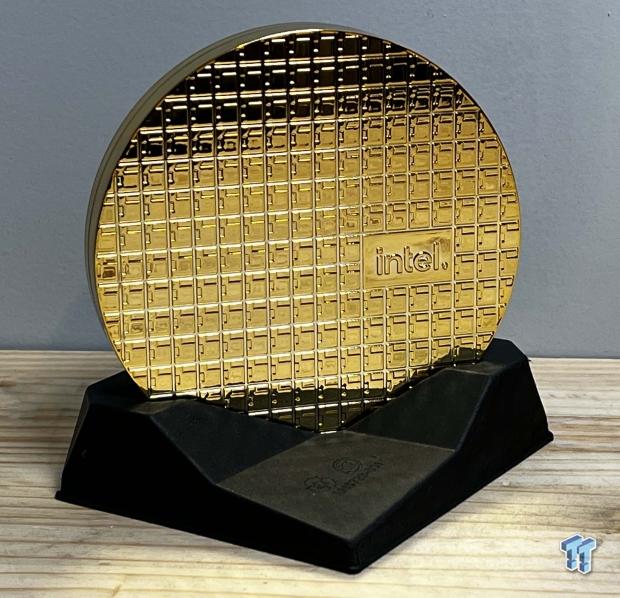
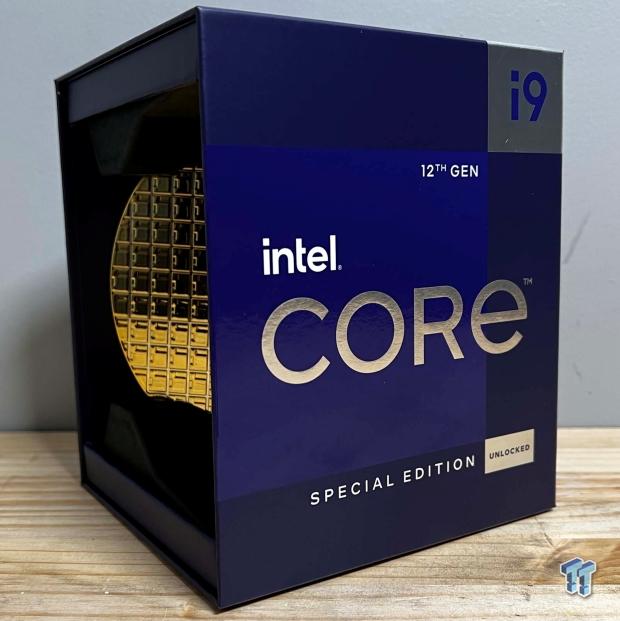
The KS was delivered in retail packaging, darker in appearance than the 12900K box but still includes the gold wafer.
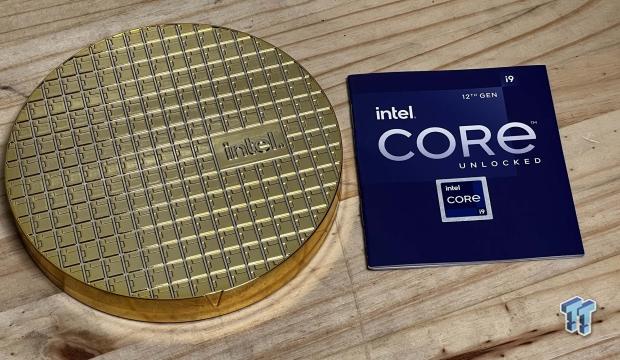
The 12900KS is tucked away inside the wafer above, reading material included.

The CPU is an LGA1700 design, with branding and core markings on the IHS.
Our Latest Intel CPUs Review Coverage
- Intel Arc G3 Extreme first impressions with MSI's Claw 8 EX AI+ - Incredible power for an extreme price
- Intel Core Ultra 5 250K Plus CPU Review - Shaking up the entry-level
- Intel Core Ultra 7 270K Plus CPU Review - The 285K is now obsolete
- Intel Core Ultra 9 285HX vs. 285K CPUs Head-to-Head - Desktop Power in a Laptop Form Factor
- Intel Core Ultra 5 245K Processor Review - Team Blue Has Seen Better Days
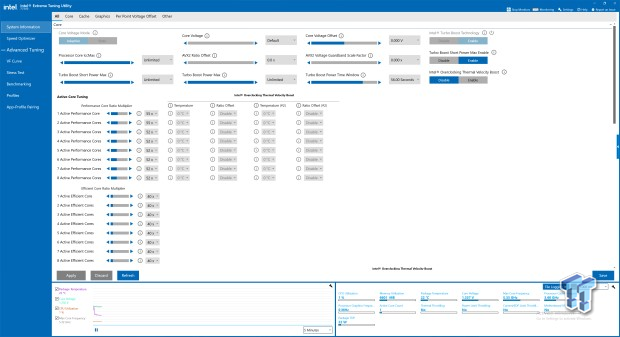
Above, we have the default clocks and settings for the 12900KS in XTU. You will notice that 5.5GHz is reserved for two cores while all other scenarios have the P-Cores at 5.2GHz and E-Cores always at 4GHz.
We have adjusted our test platforms since the initial Alder Lake reviews in late 2021. This includes new motherboards for AMD and Intel CPU reviews alongside a switch in GPUs and Power Delivery/Cooling.
Because of this, we have retested all Alder Lake CPU samples alongside AMD Ryzen 5900X and 5800X. We have used the latest drivers as of 4/4/22 with Windows 11.
TweakTown Intel Test System
- RAM: Kingston Fury Beast DDR5-6000 CL40 (buy from Amazon)
- GPU: Sapphire Radeon RX6800XT Nitro+ (buy from Amazon)
- Cooler: BeQuiet Pure Loop 360 (buy from Amazon)
- OS Storage: Sabrent Rocket 4 Plus NVMe (buy from Amazon)
- Power Supply: BeQuiet Dark Power Pro 1200W (buy from Amazon)
TweakTown AMD Test System
- RAM: Thermaltake ToughRam DDR4 4000 CL19
- GPU: Sapphire Radeon RX6800XT Nitro+ (buy from Amazon)
- Cooler: BeQuiet Pure Loop 360 (buy from Amazon)
- OS Storage: Sabrent Rocket 4 Plus NVMe (buy from Amazon)
- Power Supply: BeQuiet Dark Power Pro 1200W (buy from Amazon)
- OS: Microsoft Windows 11 (buy from Amazon)
Cinebench R23,CrossMark and AIDA64
Cinebench
Cinebench is a long-standing render benchmark that has been heavily relied upon by both Intel and AMD to showcase their newest platforms during unveils. The benchmark has two tests, a single-core workload that will utilize one thread or 1T. There is also a multi-threaded test that uses all threads or nT of a tested CPU.

Out of the box, 12900K was impressive, but KS takes this even further with a slightly higher 1T score of 2128 and multi-thread reaching just over 28K.
CrossMark
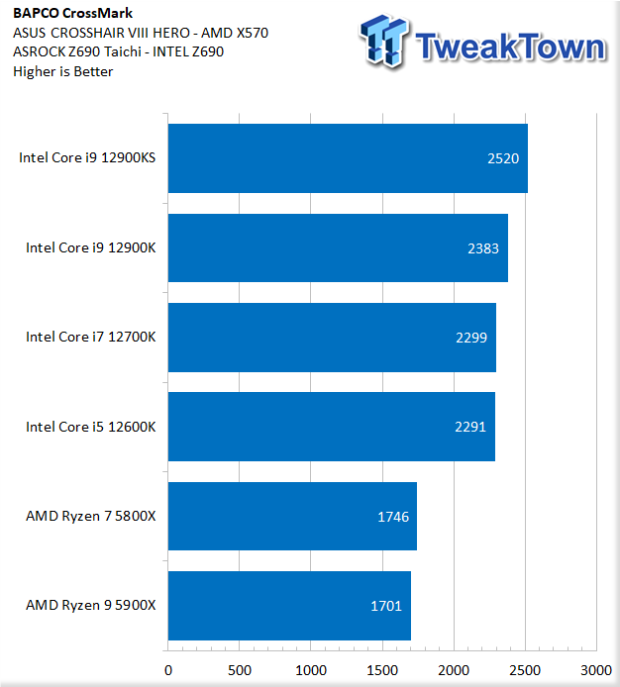
In CrossMark, the KS offered a near 200-point advantage over the 12900K.
AIDA64
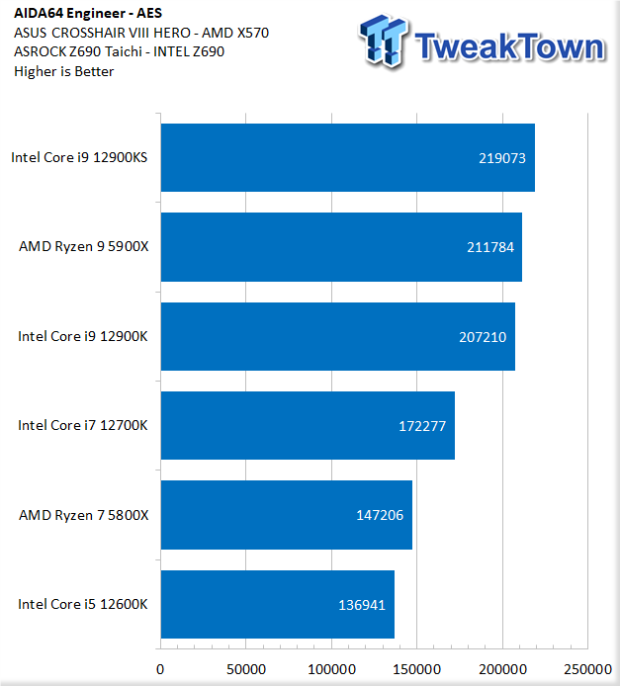
AES grabbed a near 8000-point bump over the 12900K.
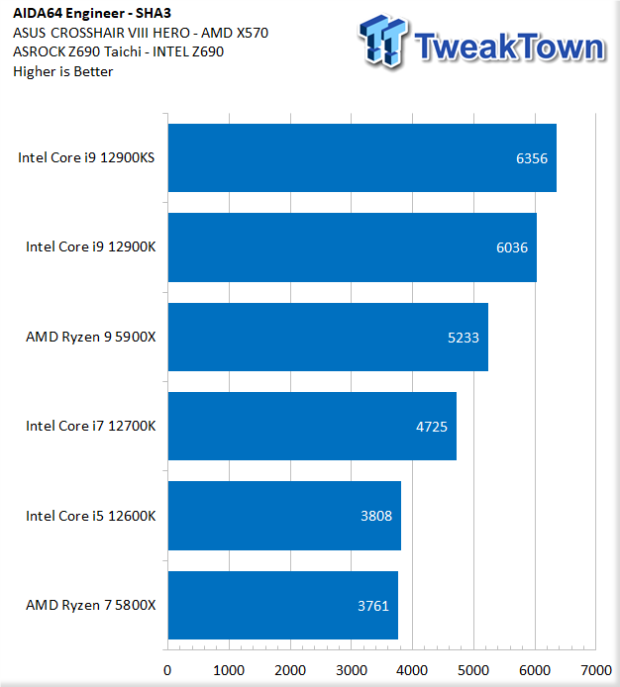
SHA3 came in at 6356, about 300 points higher than K.
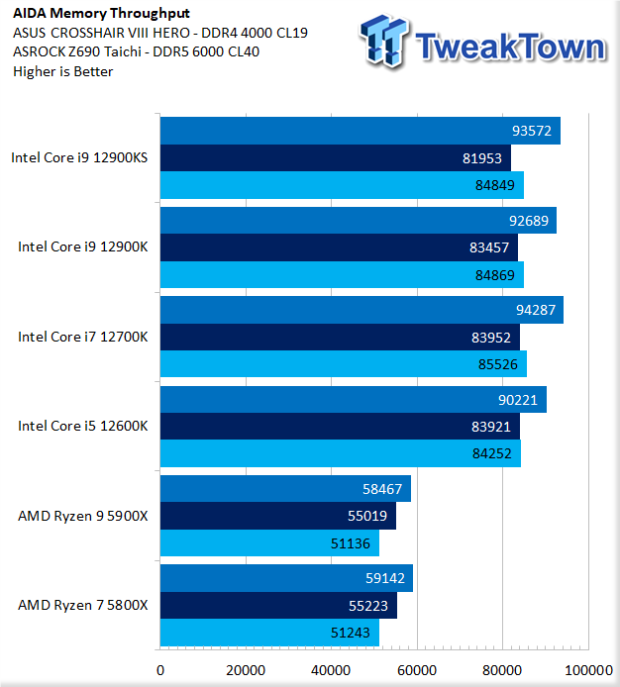
Memory Throughput was identical: 93K read, 83K write, and 84K copy.
UL Benchmarks
3DMark
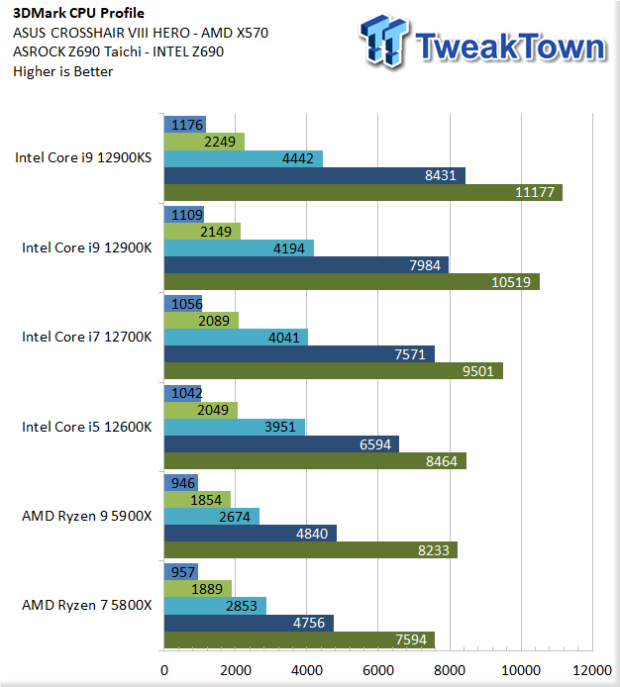
CPU Profile shows a sizable gin with 12900KS. At peak, we see a score of 11177 at 16 threads, compared to 10519 for the 12900K and 8233 for the 5900X.
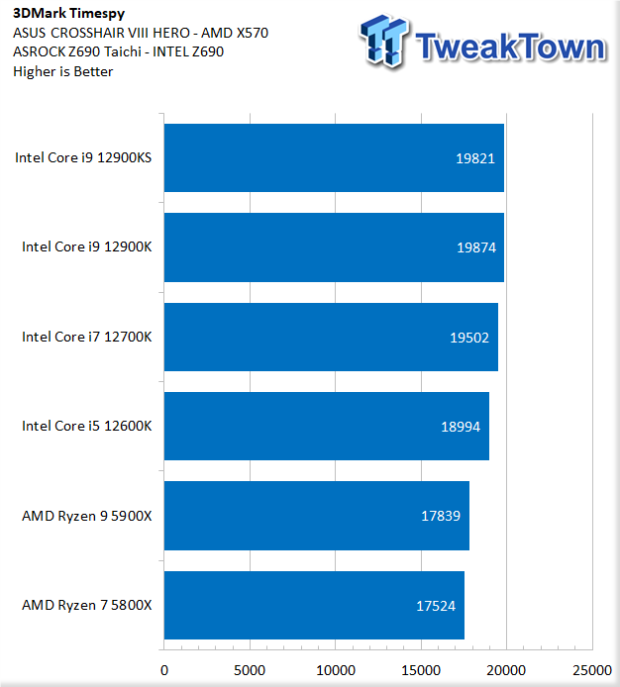
Timespy gives us our first glimpse at a gaming workload. 12900KS doesn't appear to gain anything over 12900K, losing about 50 points to the K.
UL Procyon

In Procyon, the KS SKU enjoyed a solid performance bump over the 12900K. In the Office workload, the gain was 500 points, Photo was close to 600 points, and video editing showed 200 points.
1080p Gaming Performance
Shadow of the Tomb Raider has become a staple of game performance benchmarking, but I try to test multiple game engines, so I have added Horizon and Cyberpunk 2077 to our testing. Additionally, we picked up a few Microsoft titles in Gears 5 and Forza Horizon. The GPU in use for both platforms is the Sapphire 6800XT Nitro+.


The KS picked up around 6FPS testing at low settings 1080p. This gives the most accurate results of CPU performance as it's not bound by the GPU at all. At higher quality settings, the GPU becomes more of a factor, as is the case with our testing, seen above, as Ultra settings shows 226FPS for the KS, 4FPS over the K.
Horizon showed near-identical results. Though closer overall, the KS does gain 4FPS over the K at low settings and 6FPS at Ultra.


Cyberpunk kept things very close at low settings, but the KS does gain 3FPS. High Settings showed no real gain between the KS and K or even the 12700K, for that matter.
Gears 5 showed the 12900K ahead of the KS by 7 FPS at low settings. Ultra-flipped the two CPUs, the KS grabbing a 3FPS advantage.
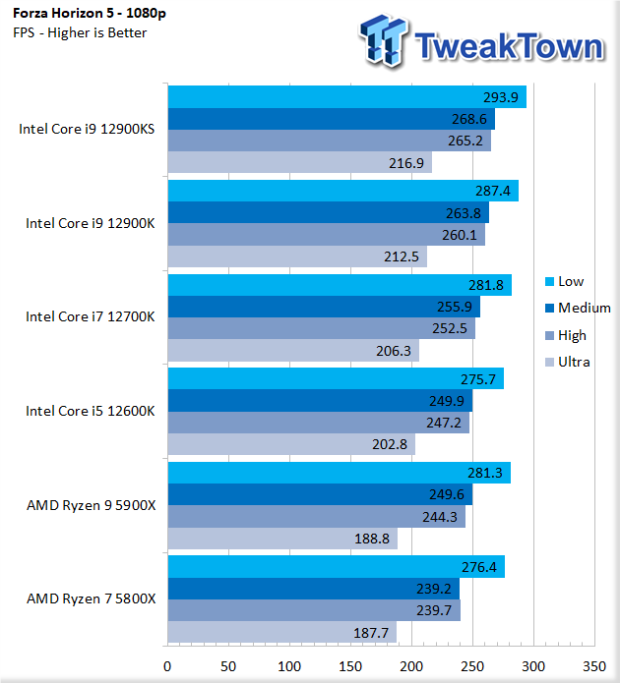
With Forza Horizon 5, FPS topped at 293 for the 12900KS and 287 for the K at low settings. In Ultra settings, everything tightened up, a 4FPS advantage going to the 12900KS.
Power, Pricing and Final Thoughts
Power and Pricing
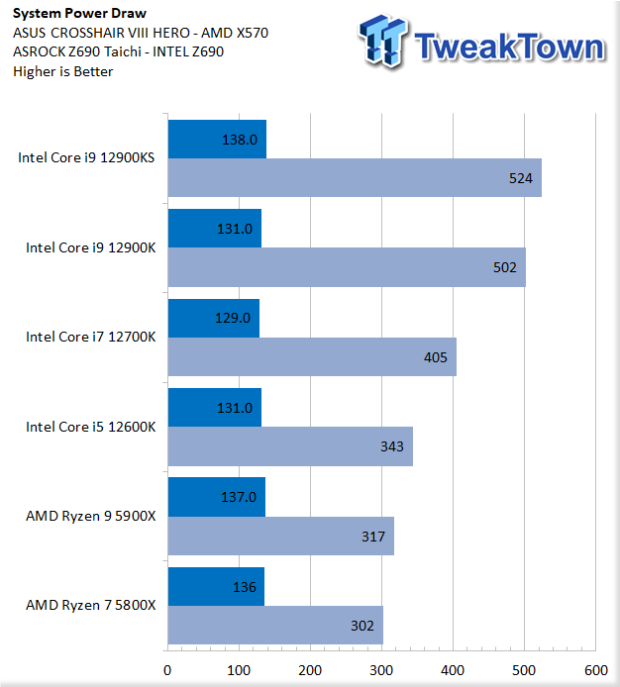
The power draw for the 12900KS was in line with the increase in TDP. I saw 524 watts at peak for our entire system. This compares to the 12900K at 502 and 12700K at 405.
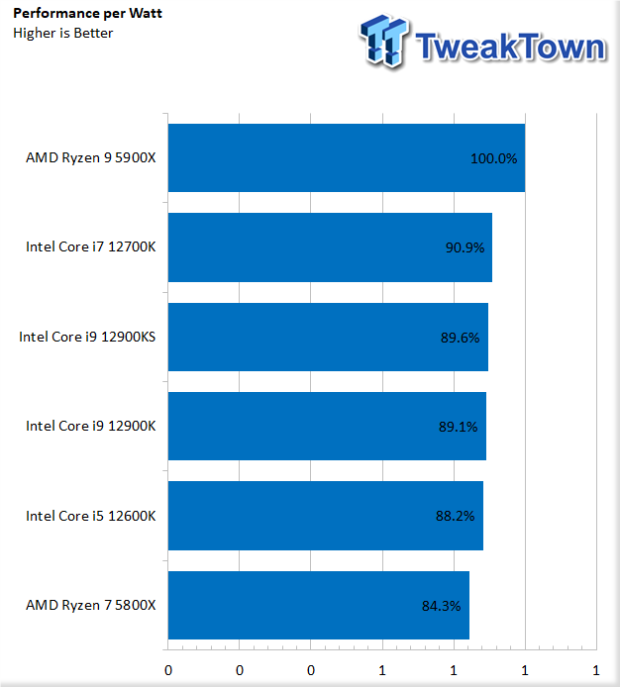
Taking the performance from multi-threaded Cinebench R23 and crossing it with peak power draw in R23, we come away with our own performance per watt chart, seen above. In this scenario, for those who care about power, the 5900X offers a near 10 percent advantage over the closest Intel CPU.
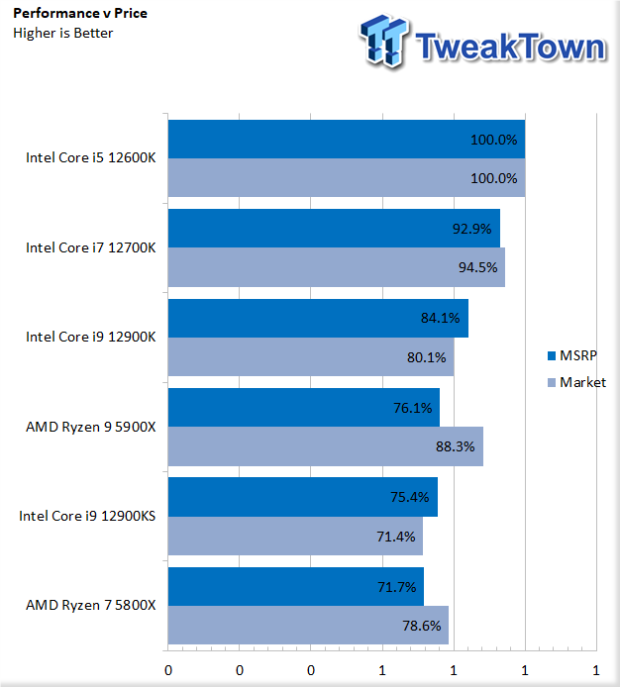
Using R23 once again, we take the MSRP and current market price as of today and cross it with the multi-threaded performance of each CPU. In this scenario, the 12600K comes out on top for MSRP and Market, while the 12900K and KS flank the 5900X. In market pricing, the 5900X does take the third spot due to recent price drops.
Final Thoughts
The bottom line for the 12900KS is it's a slightly higher performing variant of an Alder Lake Core i9. It outpaces the 12900K in almost every scenario, just as expected.
On the flip, I'm going to say most 12900K processors can or can get very close to running 12900KS clocks. Our media sample of the 12900K, received back in November, will run the clocks on several boards tested but running your CPU outside of Intel spec does void the warranty. So be warned, this is yet another reason for the KS SKU.
That said, this CPU will be for consumers who want the best CPU currently available on the best platform available. Comparing the 12900KS to AMD's current best offering in the 5900X, you will gain roughly 40 FPS in Tomb Raider, 30 FPS in Horizon, and 40 FPS in Cyberpunk. Gears 5 showed 30 FPS, and Forza too showed 30 FPS.
 AMD Ryzen 7 7700X3D Review - Days of Future Past
 Intel Arc G3 Extreme first impressions with MSI's Claw 8 EX AI+ - Incredible power for an extreme price
 Intel Core Ultra 5 250K Plus CPU Review - Shaking up the entry-level
 Intel Core Ultra 7 270K Plus CPU Review - The 285K is now obsolete
 AMD Ryzen 7 9850X3D Review - The best gaming chip just got better
 Google Earth quickly added and removed AI image generation for obvious reasons
 Google, Amazon, Microsoft and Meta have reportedly spent over $1 trillion on AI
 3D-printed chimney drops Ryzen 7 9800X3D CPU temperature by almost 20 degrees
 AYANEO's KONKR Pocket Advance is a new gaming handheld that looks like a Game Boy Advance
 LIAN LI launches new affordable wireless Uni Fan SL Flex and Uni Fan CL Flex fans
 Half of Xbox Series discs need downloads to work properly, and PlayStation is not far behind, report shows
 Xbox consoles get more expensive in Europe, Series S now costs as much as Series X did at launch
 Memory shortages will get only worse in 2027 and 2028, warns Samsung
 VPS vs. Shared vs. Dedicated Hosting: Which One Actually Fits a UK Power User in 2026?
 Qualcomm is raising chip prices from September 1, and Android phones could get more expensive
 Montech TG3 Mid-Tower Chassis Review
 ASUS ROG Strix X870E-A Gaming WiFI7 Neo Review - A New Enticing Option
 Noctua NL-LC1-36 Liquid CPU Cooler Review
 Logitech G316 X 98 Wired Gaming Keyboard Review - Retro-Inspired Board that Falls a Little Short
 Biwin M560 2TB SSD Review - Best Overall Retail-Ready DRAMless SSD
 Logitech G512 X 98 Analog Mechanical Gaming Keyboard Review - An Innovative Two-in-One
 Thrustmaster T.Flight HOTAS 5 MSFS Edition Review
 SteelSeries Arctis Nova Pro Omni Wireless Headset Review - One Headset to Rule Them All
 SteelSeries Arctis Nova 7 Wireless Gen 2 Headset Review - New and Improved, But Is It Enough?
 How to tell if someone has been using your Windows PC without your permission
 6 Task Manager tips for troubleshooting Windows performance problems
 ASUS ROG's 20th Anniversary Line-up of Premium PC Gaming Gear has Arrived - Here's Everything You Need to Know
 Six File Explorer tips every Windows user should know
 I switched my PC to encrypted DNS in Windows 11, and browsing felt more private
 Printer Not Working in Windows? How to fix detection, print queues and drivers
 The Ultimate Guide to Personalizing Your Windows 11 Taskbar
 How to Turn Your Windows Laptop Into a Second Monitor with Miracast and Wireless Display in Minutes
 6 Mistakes to Avoid When Buying a Windows Laptop
 I capped Windows Update's bandwidth with Delivery Optimization, and my downloads stopped choking