


How did gaming's Big 3 (PlayStation, Xbox, and Nintendo) fit into global video games market in 2022? We've calculated market share estimates using estimates from analysts and official figures from the companies themselves.
According to our estimates, gaming's Big 3 platform-holders saw slight year-over-year fluctuations in market share positioning throughout 2022. Using a combination of Newzoo's 2022 global video games market data and quarterly financial reports filed by Sony, Microsoft, and Nintendo, we're able to weigh each company's calendar year performance against the backdrop of worldwide games market earnings. The results show a year-over-year decline in overall market revenues and individual company earnings.
Before we go into the numbers let's take a quick look at our basic methodology. Newzoo's market report estimates that the worldwide video games industry generated $184.4 billion throughout 2022, representing an $8.3 billion (-4.3%) decrease from 2021. To determine how Sony, Microsoft and Nintendo fit into the market, we've simply added up the appropriate quarters for each company to deliver total-year earnings and divided those against Newzoo's estimates.
This isn't a perfect or exact metric by any means, however it's worth noting that Newzoo estimates are frequently used in official documents published by the video games industry's top companies. Newzoo figures are also found in documents from regulators in regards to the Microsoft-Activision merger and market share data. It's also very important to remember that Sony and Nintendo data are based on conversions from Japanese Yen to USD. We used the quarterly foreign exchange rates provided by both companies for our conversions.
Now let's take a look at the numbers.
Read Also: Nintendo vs PlayStation hardware sales: All console and handheld unit sales charted and ranked
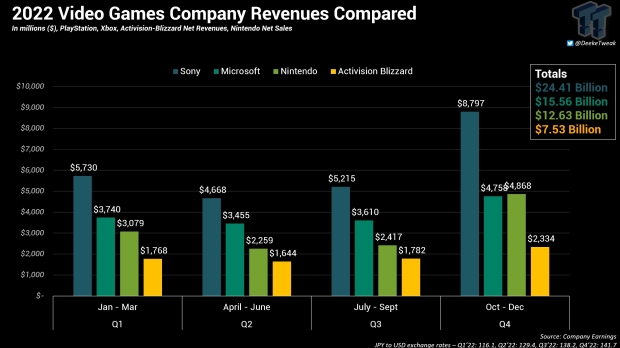
In 2022, we've found that the Big 3 earned the following revenues, which represent a range of year-over-year decreases:
- Sony - $24.41 billion, (-0.7%)
- Microsoft - $15.56 billion, (-4%)
- Nintendo - $12.62 billion, (-15%)
- Big 3 Total - $52.6 billion, (down 5.6% or $3.1 billion)
Nintendo was hit with the most dramatic drop in earnings due to a tough year-over-year comparison. Remember that these numbers do not necessarily indicate the companies are doing poorly--far from it. The decrease simply illustrates just how good 2021 was for these companies and how 2022 has been affected by macro-economic trends like global inflation.
We've prepared the following figures to highlight changes in market share trends. There wasn't much change overall. The global video games market made less money, and so did the Big 3.
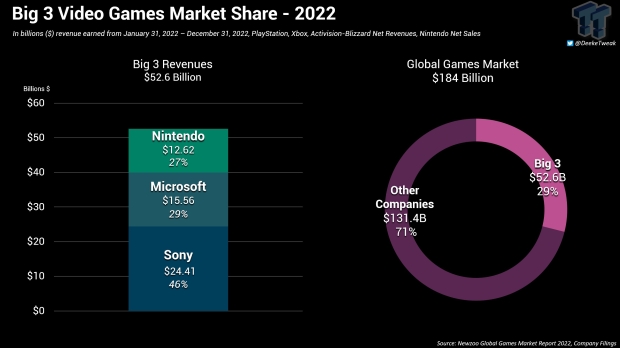
The Big 3 made up 29% of total global video games revenues for 2022, whereas other companies--including platform-holders like Valve on PC as well as a plethora of games publishers and developers across the full spectrum of gaming--made up 71% of market revenues, or $131.4 billion.
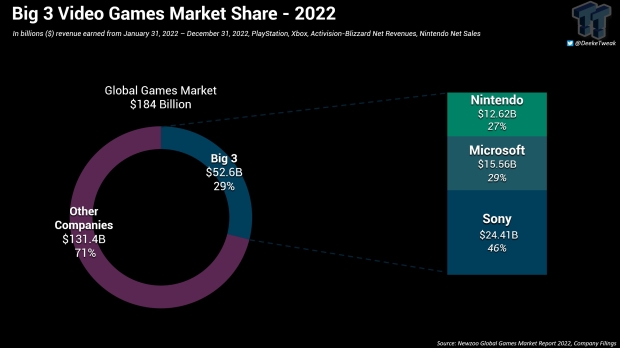
As per usual, Sony made up the largest proportion of Big 3 games revenues with 46% of earnings, with Microsoft in second place with 29% and Nintendo make up 27% (the sum may exceed 100% due to rounding).
On an individual basis, we're able to roughly measure the approximate market share of each company in relation to worldwide games revenues.
Here's what that data looks like in revenue form:
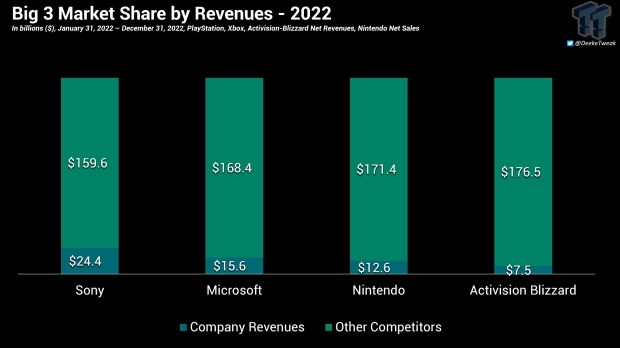
Here's how Sony, Microsoft, Nintendo and Activision-Blizzard fit into the worldwide market on a percentage basis. We've included Activision-Blizzard because of the ongoing Microsoft-Activision merger case and to give a better illustration of implied market share of the two companies combined.
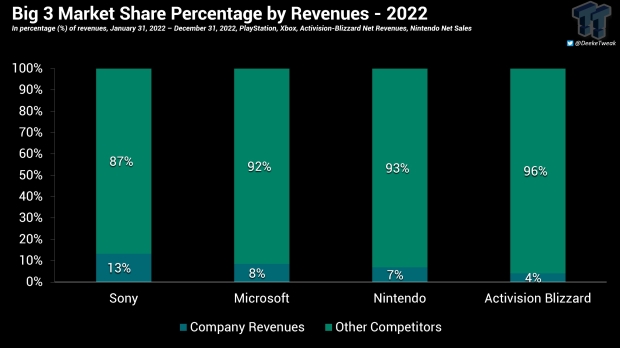
There aren't many changes in market share percentages from 2021 to 2022. The Big 3 lost a percentage point in global video game market share revenues, which doesn't sound like a lot, but indeed represents earnings slides when compare billions of dollars.
While the Big 3 saw earnings decline through 2022, it's important to remember that these comparisons are up against a historical record year for these companies and there are other factors such as estimated figures, converted values, and the data itself has been converted from fiscal into calendar year formats.

 PS5 outselling Xbox Series X/S by 3:1
 Xbox consoles will 'flatline' to 42 million users by the end of 2025, analyst firm predicts
 Gaming to make record-breaking $197 billion in 2025, PC revenue almost ties console
 Analyst predicts Helix will be significantly outsold by PS6
 Games industry made $184.3 billion in 2024, consoles segment was 84% digital
 AMD's RX 9050 GPU comes up short in first review, but there's a good reason why it lags behind NVIDIA's RTX 5050 here
 Sony confirms it won't reverse disc phase out: 'We're going to cautiously move forward'
 GeForce RTX 50 Series GPU prices are rumored to increase by 30% in the coming weeks, months
 TSMC's 1.4nm process timeline accelerates, with mass production happening sooner than expected
 Diablo 4's next season is bringing back iconic items from Diablo 2 and 3
 Razer Huntsman V3 HE Magnetic 8K keyboards include a Mini 65% model
 Four C's of Xbox's future outlined in new CEO memo
 Linux kernel patch boosts Steam Deck 1% lows by 31.8% by fixing AMD CPU clock handling
 Nexus Mods new owner wants to make installing mods as easy as using Spotify
 Dragon Age remasters are technically possible but won't be easy, BioWare co-founder says
 Montech TG3 Mid-Tower Chassis Review
 ASUS ROG Strix X870E-A Gaming WiFI7 Neo Review - A New Enticing Option
 Noctua NL-LC1-36 Liquid CPU Cooler Review
 Logitech G316 X 98 Wired Gaming Keyboard Review - Retro-Inspired Board that Falls a Little Short
 Biwin M560 2TB SSD Review - Best Overall Retail-Ready DRAMless SSD
 Logitech G512 X 98 Analog Mechanical Gaming Keyboard Review - An Innovative Two-in-One
 Thrustmaster T.Flight HOTAS 5 MSFS Edition Review
 SteelSeries Arctis Nova Pro Omni Wireless Headset Review - One Headset to Rule Them All
 SteelSeries Arctis Nova 7 Wireless Gen 2 Headset Review - New and Improved, But Is It Enough?
 AMD Ryzen 7 7700X3D Review - Days of Future Past
 I switched my PC to encrypted DNS in Windows 11, and browsing felt more private
 Printer Not Working in Windows? How to fix detection, print queues and drivers
 The Ultimate Guide to Personalizing Your Windows 11 Taskbar
 How to Turn Your Windows Laptop Into a Second Monitor with Miracast and Wireless Display in Minutes
 6 Mistakes to Avoid When Buying a Windows Laptop
 I capped Windows Update's bandwidth with Delivery Optimization, and my downloads stopped choking
 I use this decade-old free tool that finds files faster than Windows Search does
 I install and update most of my apps with this Windows command now, and I stopped downloading sketchy installers
 Hisense U6SF 65-inch MiniLED TV: High Performance Meets Leisurely Convenience
 I stopped digging through Windows menus after I set up this one folder