Introduction
One of the things I like most about TweakTown is Shawn's awesome SLI video card reviews. The performance he's able to get from a pair of video cards running in SLI is simply astounding. Running multiple cards linked together provides even more performance than a single card. It really redefines the meaning of performance PC.
RAID 0 can do the same thing as SLI or CrossFire does for video, for your storage system. How would you like to double or triple your storage performance? You can with RAID 0 and the nice thing is, RAID's already baked into your motherboard.
The biggest bottleneck on your PC has always been, and continues to be non-volatile storage. Even the fastest SSD can only serve up data at a tiny fraction of a CPU's capability to process it. Remember the first time you tried an SSD? Could you imagine ever going back to a spinner? SSD's have redefined the meaning of enthusiast-class PC.
RAID 0 takes SSD performance to another level and, that's exactly what this review is going to demonstrate. RAID 0 is simple to setup, reliable, and is something that once you try, will have you wondering how you ever lived without it.
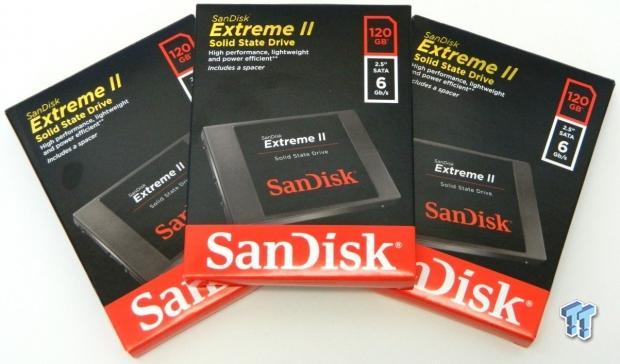
We've chosen SanDisk's Extreme II 120GB SSD's for TweakTown's first Haswell based RAID 0 report. In this report, we'll demonstrate how RAID 0 increases storage performance and how that performance scales from 1 to 3 drives.
Specifications, Pricing and Availability
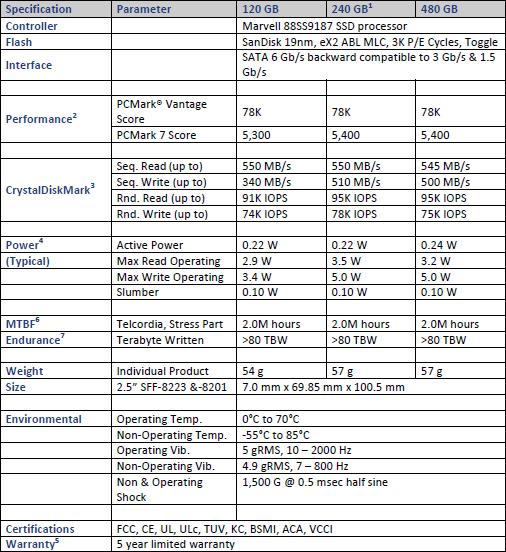
Available in three capacity sizes, the Extreme II is an affordable Hyper-Class SSD featuring premium 19nm, eX2 ABL MLC, 3K P/E toggle mode NAND. The Extreme is powered by Marvell's 8 channel "Monet" 88SS9187 SSD processor, providing sequential read speeds of up to 550 MB/s and sequential write speeds of up to 340 MB/s.
SanDisk backs the Extreme II with an industry leading five year warranty. The 120GB SanDisk Extreme II is available from Newegg or Amazon for $140. Since this is a RAID report, we are going to focus on performance rather than features. For a more in-depth look at SanDisk's Extreme II feature set, I will refer you to Chris Ramseyer's extensive review.
SanDisk's Extreme II is the recipient of TweakTown's prestigious Best of Computex 2013 award in the SSD category:
Chris Ramseyer writes: "The SanDisk Extreme II is the company's latest flagship SSD and the winner of our Best of Computex 2013 SSD award. Featuring the Marvell 88SS9187 controller and SanDisk's own 19nm ABL NAND Flash with nCache, the Extreme II brings an entirely new experience to power users. nCache technology reduces MLC latency to SLC levels. With each die shrink write latency increases and nCache is SanDisk's home grown solution for fighting back against this trend.
Available in three capacity sizes, 120GB, 240GB and 480GB, the Extreme II increases performance over the Extreme SSD and does it with both compressible and incompressible data. Priced well for a flagship SSD, the Extreme II is a superior next generation product that actually manages to increase performance at a time when others are falling back."
SanDisk Extreme II 120GB SSD
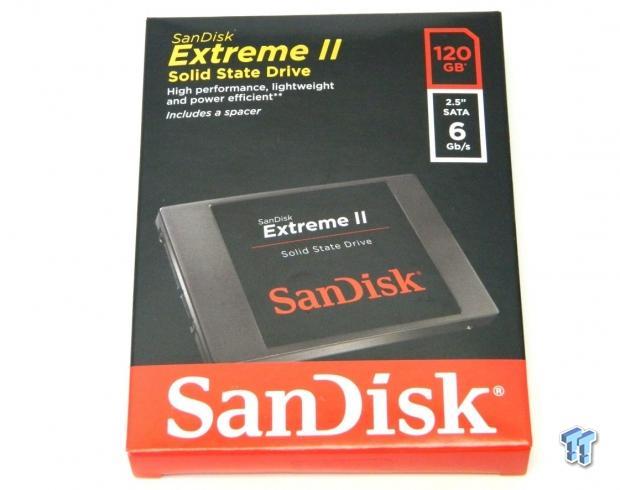
The SanDisk Extreme II comes packaged in a small attractive box that has a picture of the drive on the front. The box is black and red with gold, red and white lettering. The drives capacity is listed, along with a few attributes common to SSD's.
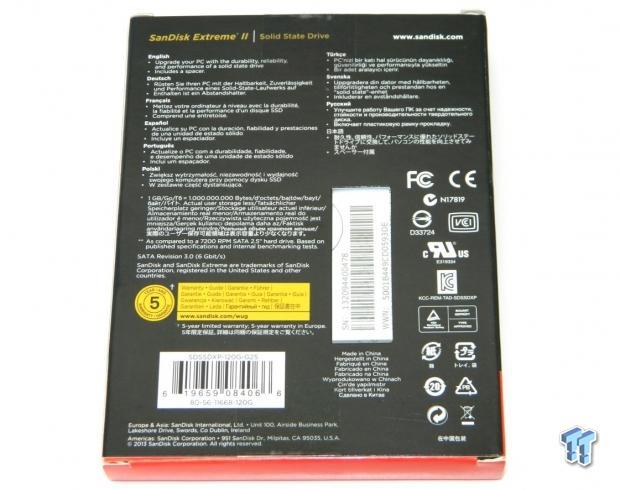
The rear of the box informs us the drive ships with a spacer and gives us the definition of a gigabyte in 10 languages. A yellow logo informs us that the Extreme II is backed by an industry leading five year warranty.
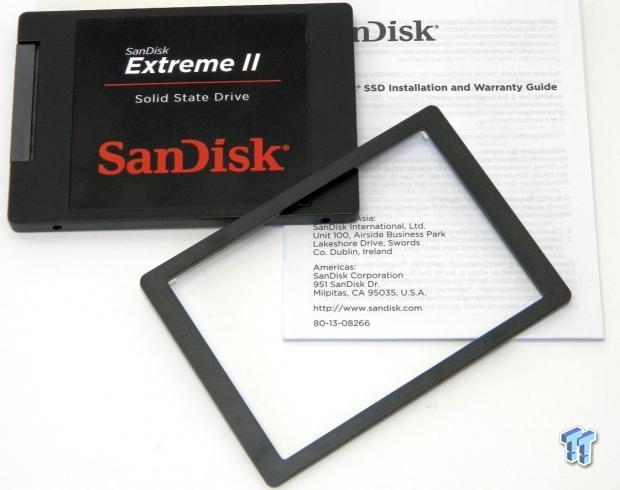
SanDisk includes a stick-on plastic spacer for increasing the drives overall thickness, as well as a printed installation guide.
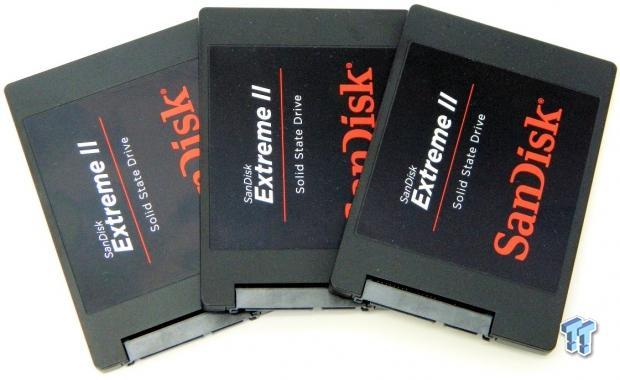
The top of the Extreme II's enclosure is formed from a single piece of black plastic. Centered on the top face of the drive is a black manufacturer's sticker with red and white lettering.
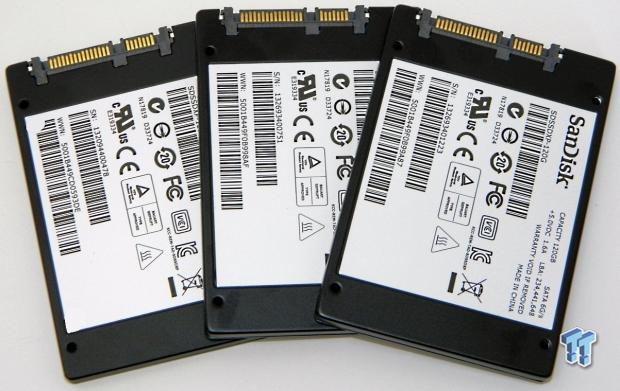
The bottom and sides of the Extreme II's enclosure are formed from a single piece of stamped aluminum painted black. Centered on the rear face of the enclosure is a manufacturer's sticker that lists the drives part number, serial number, capacity and interface.
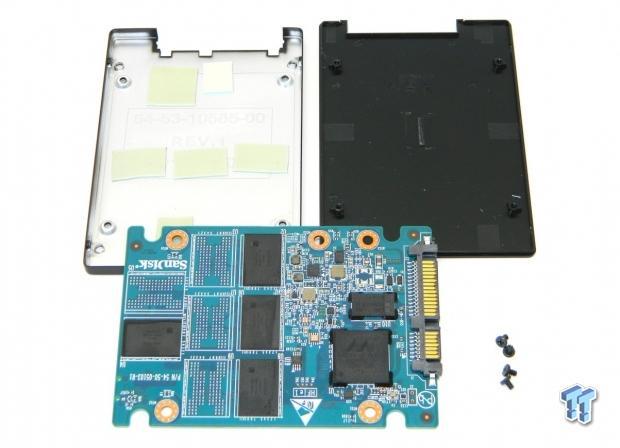
Here's what SanDisk's Extreme II 120GB SSD looks like completely disassembled. The FSP (Flash Storage Processor), DRAM module and NAND chips all make contact with a thermal pad thereby dissipating heat generated into the aluminum half of the enclosure.
Benchmarks - Test System Setup, Drive Properties & ATTO Baseline Performance
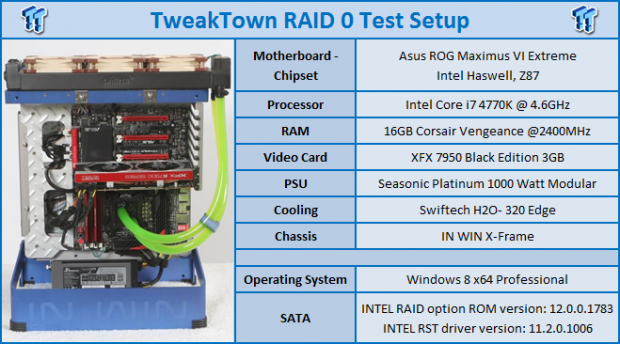
Desktop Test System
Drive Properties
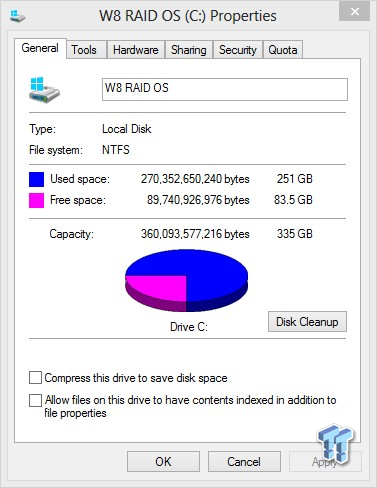
The majority of our testing will be done with our test drive/array as our boot volume. Our boot volume is 75% full for all OS Disk "C" drive testing, to mimic a typical consumer OS volume implementation. We're using 64K stripes for both 2 and 3 drive arrays. Write caching is enabled.
ATTO Baseline Performance
Version and / or Patch Used: 2.47
ATTO is a timeless benchmark used to provide manufactures with data used for marketing storage products.
Sequential Write
Sequential Write
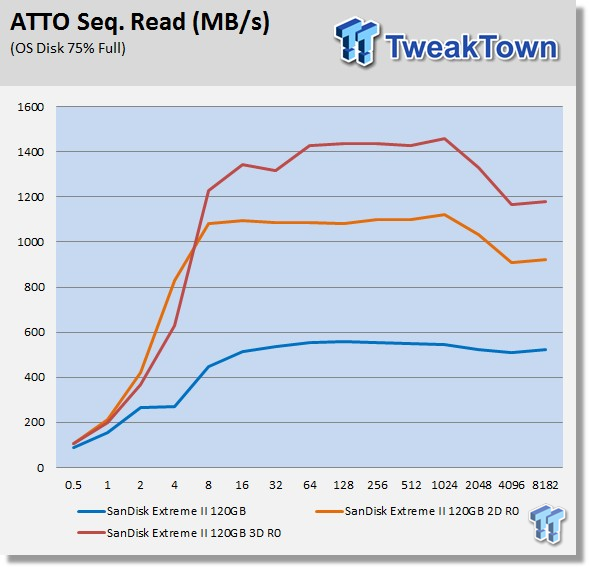
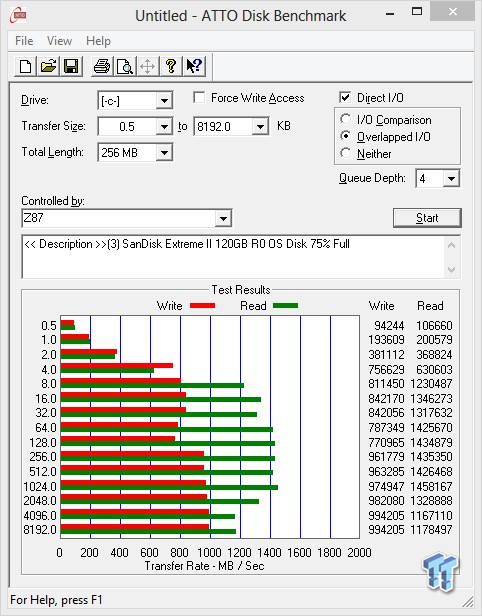
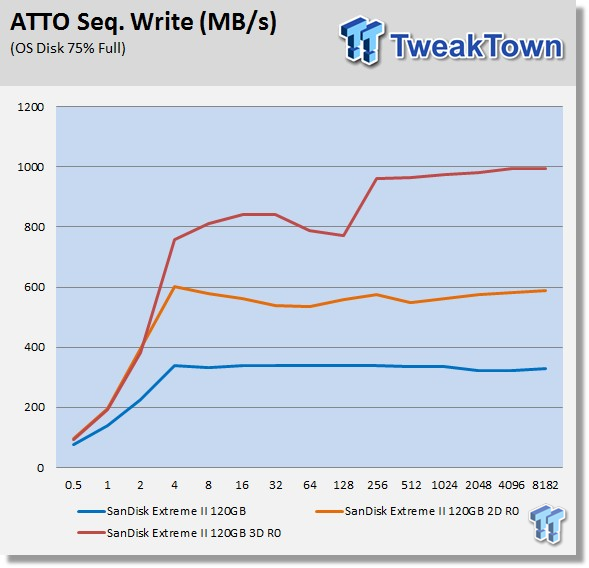
Right from the start, our ATTO testing shows excellent RAID scaling. 2 drives are around twice as fast as 1 drive, and 3 drives are nearly three times faster than a single drive.
2 drive Intel native 6Gb/s port arrays are possible with Z68 and Z77 based motherboards. Z87 based motherboards allow us to have arrays of 2-6 drives running off of native 6Gb/s Intel Ports.
Benchmarks - Anvil Storage Utilities
Anvil Storage Utilities
Version and / or Patch Used: RC6
So what is Anvil Storage Utilities? First of all, it's a storage benchmark for SSDs and HDDs where you can check and monitor your performance. The Standard Storage Benchmark performs a series of tests, you can run a full test or just the read or the write test or you can run a single test, i.e. 4K DQ16.
The software is used several different ways and to show different aspects for each drive. We've chosen to use this software to show the performance of a drive with two different data sets. The first is with compressible data and the second data set is incompressible data. Several users have requested this data in our SSD reviews.
0-Fill Compressible Data
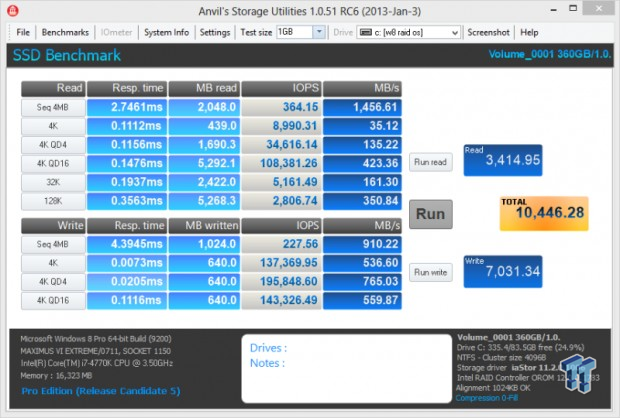
We're posting screen shots of our 3 drive array for this report. As you can see, sequential read/write speed has nearly tripled in comparison to a single drive. Write performance, especially 4K write performance, has increased tremendously due to write caching implementation.
0-Fill Compressible Read IOPS through Queue Depth Scale
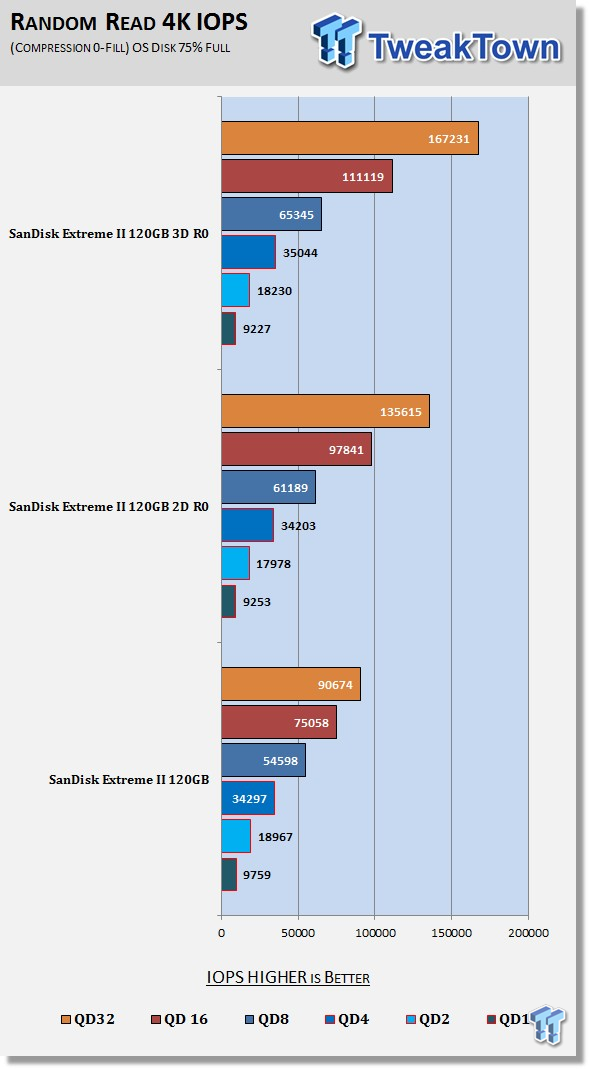
One of the many reasons we're big fans of the Extreme II is because it has really good low QD performance. Looking at the chart, we find that RAID 0 is increasing read performance from a queue depth of 8 and above.
0-Fill Compressible Write IOPS through Queue Depth Scale
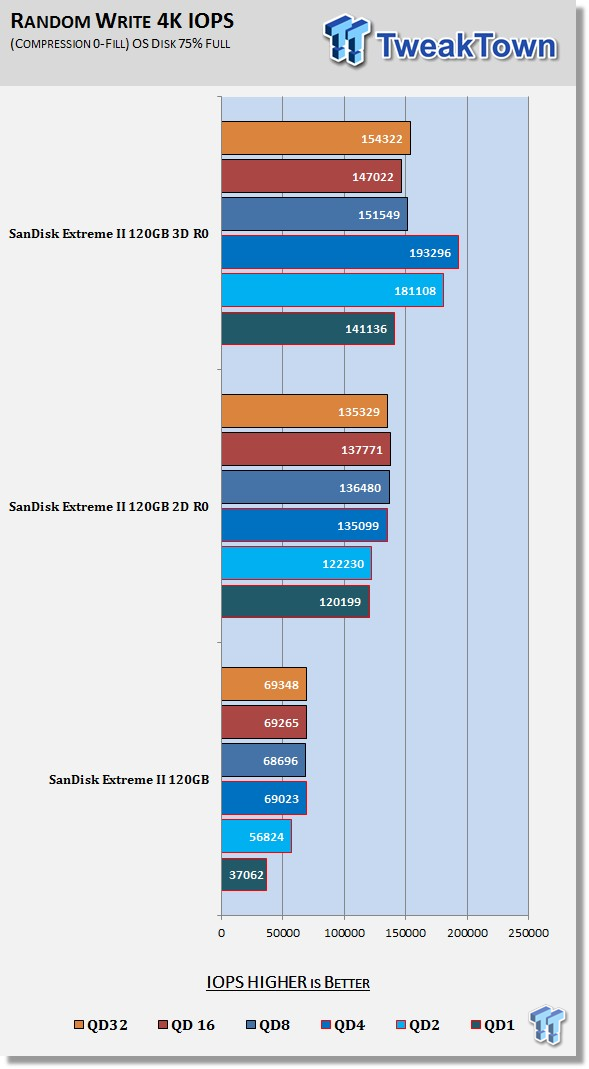
Write performance really benefits from RAID 0 when caching is enabled. Write performance is scaling very well. A 2 drive array is putting out nearly triple the performance of a single drive at QD1, and a 3 drive array even more! Look at the 3 drive arrays QD4 performance, it's approaching 200,000 IOPS!
Compression 100% Incompressible Data
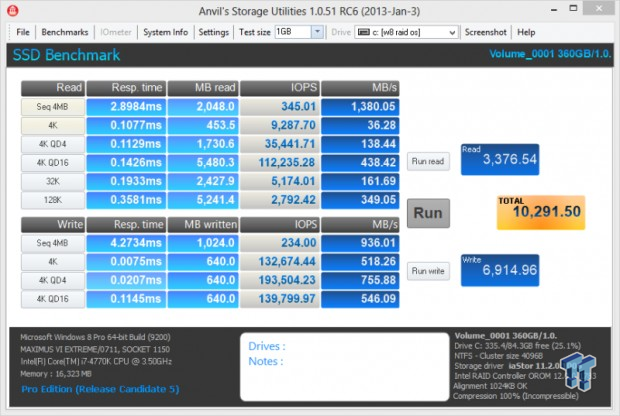
For the most part performance does not vary from compressible to incompressible data. The 150 or so point differential is more than likely due to variations between runs, not so much the difference in data.
Incompressible Read IOPS through Queue Depth Scale
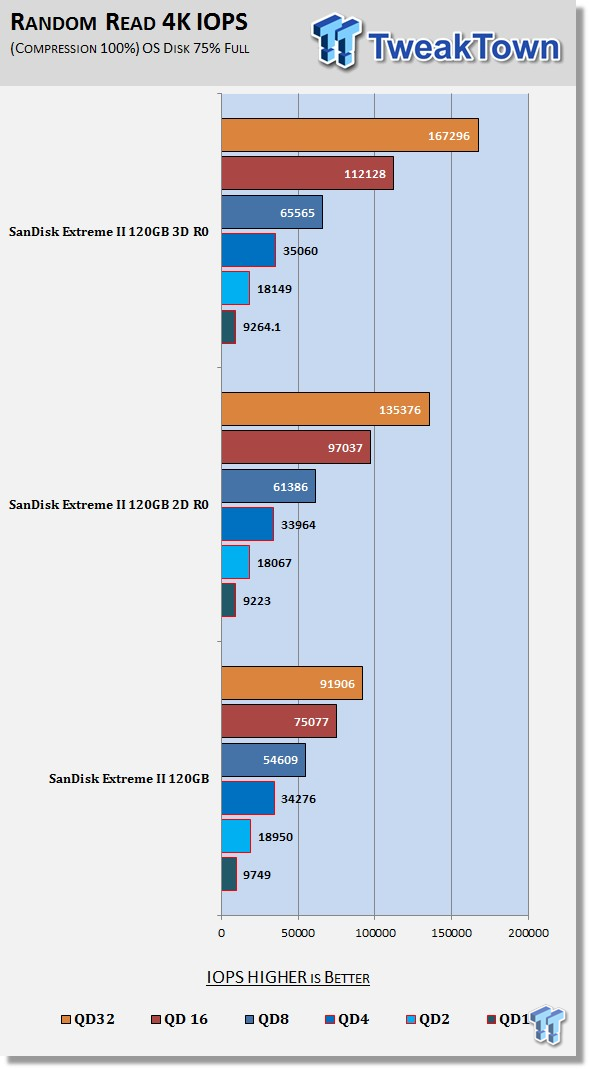
Nearly identical to our compressible IOPS scale.
Incompressible Write IOPS through Queue Scale
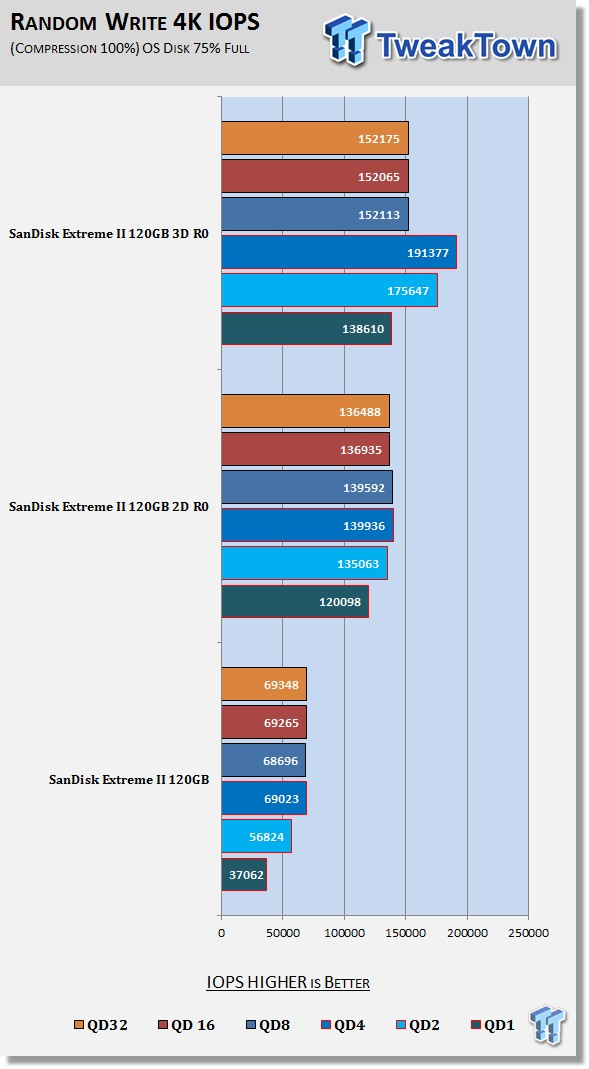
Again, nearly identical to our compressible IOPS scale. So, why do we chart incompressible IOPS? It will become apparent to you when you read our upcoming RAID reports featuring drives that utilize compression technology.
Benchmarks - CrystalDiskMark
CrystalDiskMark
Version and / or Patch Used: 3.0 Technical Preview
Developer Homepage: http://crystalmark.info
Product Homepage: http://crystalmark.info/software/CrystalDiskMark/index-e.html
Download here: http://crystaldew.info/category/software/crystaldiskmark
CrystalDiskMark is disk benchmark software that allows us to benchmark 4K and 4K queue depths with accuracy.
Key Features:-
* Sequential reads/writes
* Random 4KB/512KB reads/writes
* Text copy
* Change dialog design
* internationalization (i18n)
Note: Crystal Disk Mark 3.0 Technical Preview was used for these tests since it offers the ability to measure native command queuing at 4 and 32.
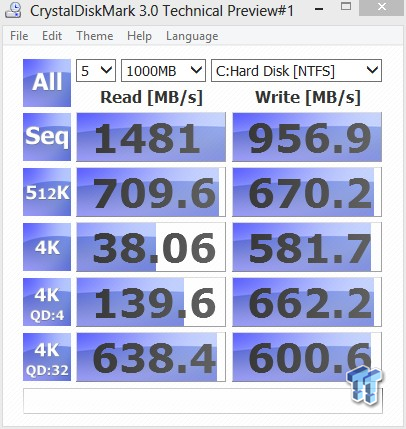
Besides the fantastic sequential performance, both our array's 4K write performance is stellar! Keep in mind that this isn't some empty, secondary attached array, this is our OS volume and its 75% filled to capacity.
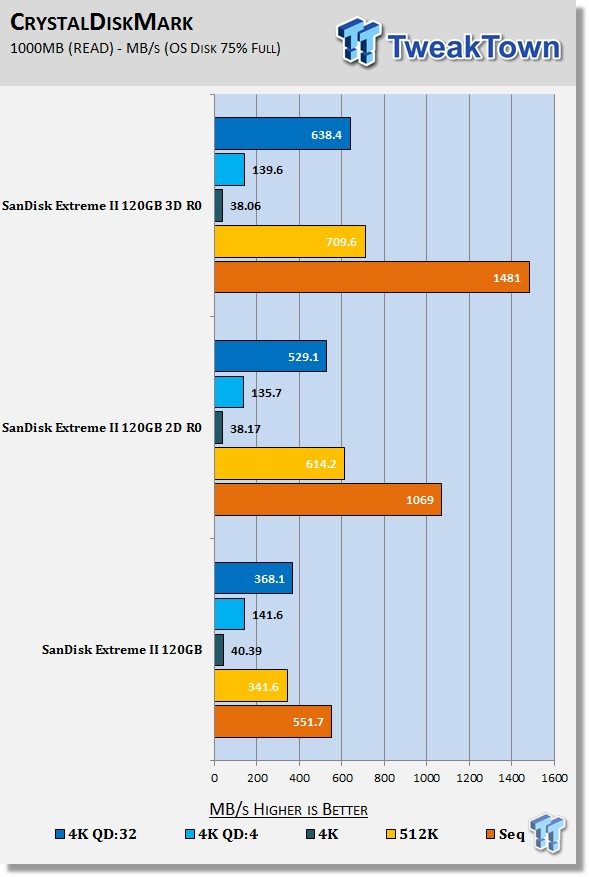
Sequential and QD32 read performance benefit most from RAID 0.
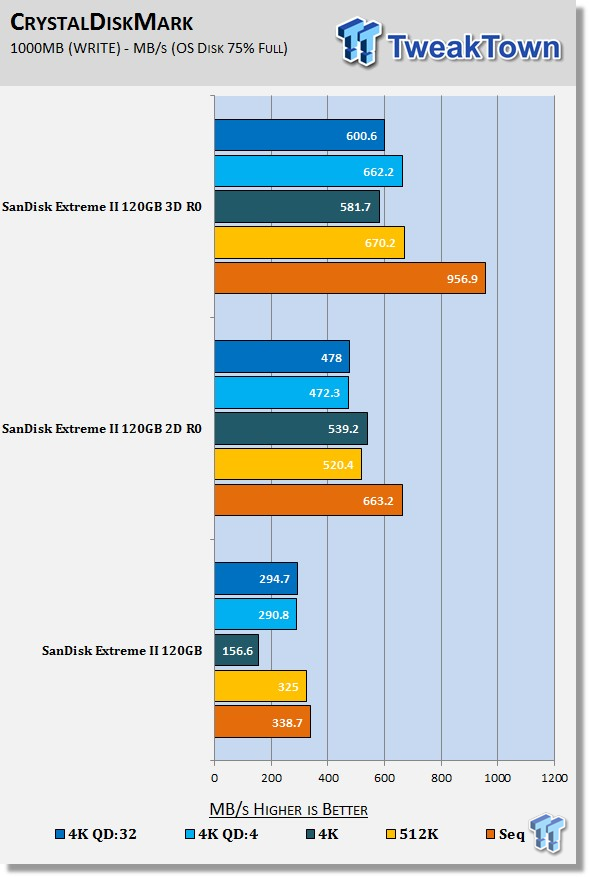
Write performance goes through the roof in comparison to a single drive. Transferring large chunks of data to and from an array is much faster with an array than a single drive. Installing programs from an array is lightning quick.
Benchmarks - AS SSD
AS SSD
Version and / or Patch Used: 1.7.4739.38088
Product Homepage: http://alex-is.de/PHP/fusion/news.php
Download here: http://alex-is.de/PHP/fusion/downloads.php
AS SSD determines the performance of Solid State Drives (SSD). The tool contains four synthetic as well as three practice tests. The synthetic tests are to determine the sequential and random read and write performance of the SSD. These tests are carried out without the use of the operating system caches.
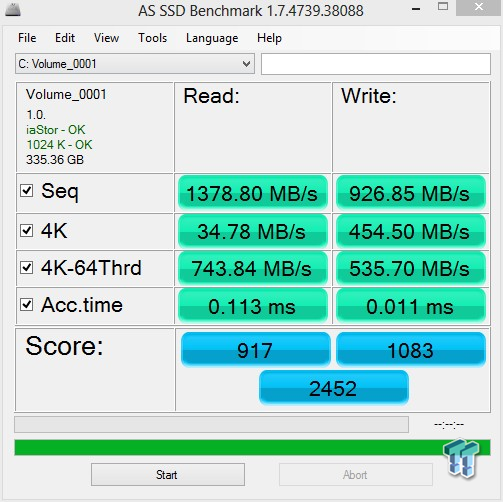
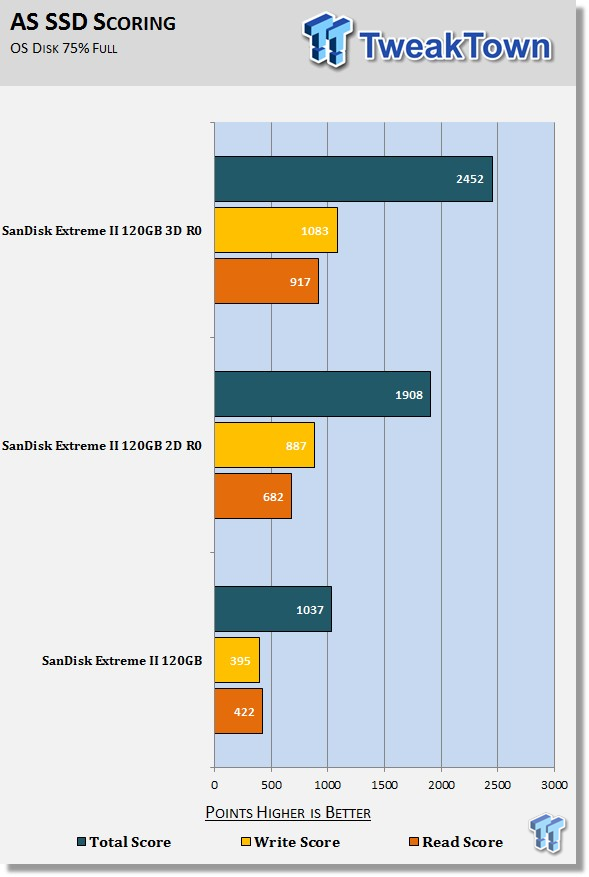
A 2 drive array scores nearly twice that of a single drive and our 3 drive array nearly 2.5 times that of a single drive.
Benchmarks - PCMark Vantage
PCMark Vantage - Hard Disk Tests
Version and / or Patch Used: 1.2.0.0
Developer Homepage: http://www.futuremark.com
Product Homepage: http://www.futuremark.com/products/pcmarkvantage

PCMark Vantage is the first objective hardware performance benchmark for PCs running 32 and 64 bit versions of Microsoft Windows Vista. PCMark Vantage is perfectly suited for benchmarking any type of Microsoft Windows Vista PC from multimedia home entertainment systems and laptops to dedicated workstations and high-end gaming rigs. Regardless of whether the benchmarker is an artist or an IT Professional, PCMark Vantage shows the user where their system soars or falls flat, and how to get the most performance possible out of their hardware. PCMark Vantage is easy enough for even the most casual enthusiast to use yet supports in-depth, professional industry grade testing.
The reason we like PCMark Vantage is because the recorded traces are played back without system stops. What we see is the raw performance of the drive. This allows us to see a marked difference between scoring that other trace based benchmarks do not exhibit. An example of a marked difference in scoring on the same drive would be empty vs. filled vs. steady state.
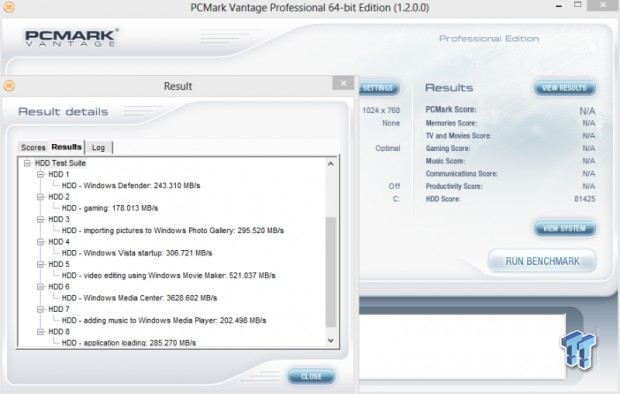
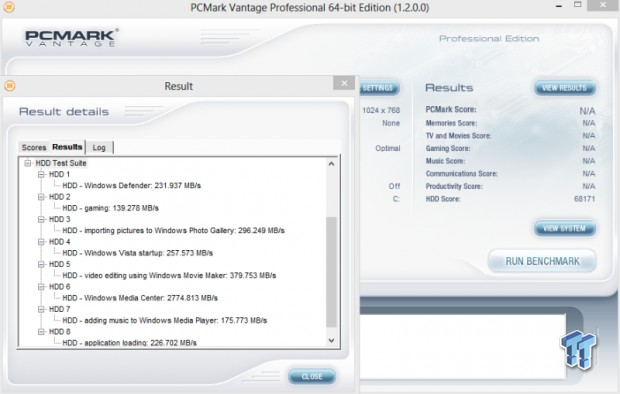
We run Vantage 3 ways. The first run is with the OS drive/Array 75% full to simulate a lightly used OS volume filled with data to an amount we feel is common for most users. The second run is with the OS volume written into a "Steady State" utilizing SNIA's guidelines (Rev 1.1). Steady state testing simulates a drive/arrays performance similar to that of a drive/array that has been subjected to consumer workloads for extensive amounts of time. The third run is a Vantage HDD test with the test drive/array attached as an empty lightly used secondary device.
OS Volume 75% full - Lightly Used
OS Volume 75% full - Steady State
Secondary Volume Empty - Lightly Used
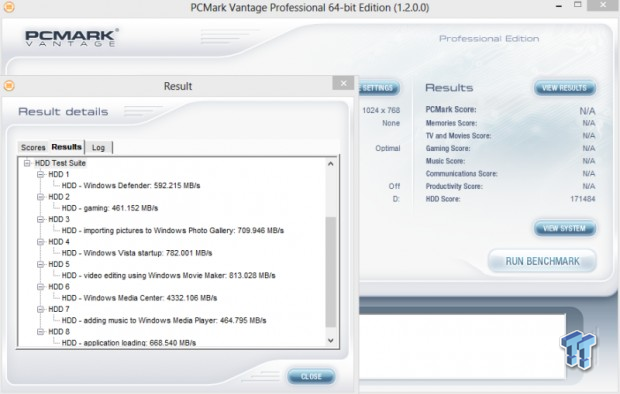
As you can see, there's a big difference between an empty drive/array and one that's 75% full/used and one that's in a steady state.
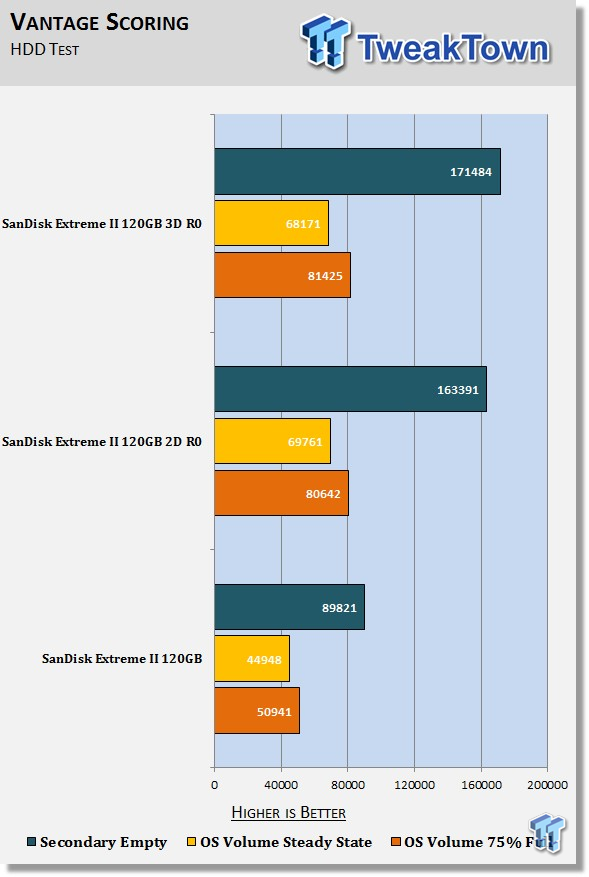
Running 64K stripes, both our 2 drive and 3 drive arrays nearly double the performance of our single drive. This is our go to test for evaluating one drive/arrays performance vs. another.
The important scores to pay attention to are "OS Volume Steady State" and, "OS Volume 75% full". These two categories are most important because they are indicative of typical of consumer based user states.
Benchmarks - PCMark 7
PCMark 7 - System Storage
Version and / or Patch Used: 1.4.00
Developer Homepage: http://www.futuremark.com
Product Homepage: http://www.futuremark.com/benchmarks/pcmark7
PCMark 7 includes 7 PC tests for Windows 7 & 8, combining more than 25 individual workloads covering storage, computation, image and video manipulation, web browsing and gaming. Specifically designed to cover the full range of PC hardware from netbooks and tablets to notebooks and desktops, PCMark 7 offers complete PC performance testing for Windows 7 & 8 for home and business use.
We will look to the Raw system storage scoring for RAID 0 evaluations because it's done without system stops and therefore allows us to see significant scoring differences between drives/arrays.
OS Volume 75% full - Lightly Used
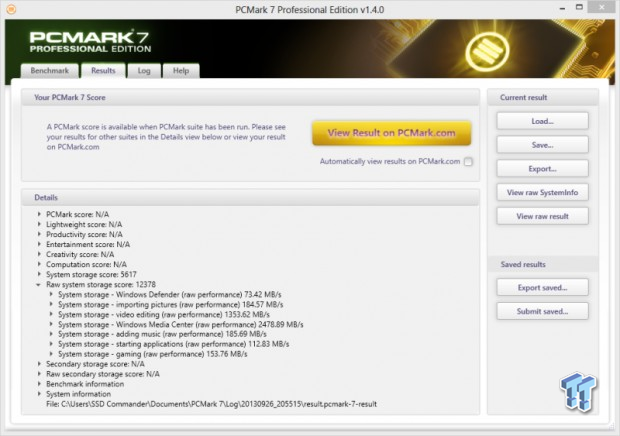
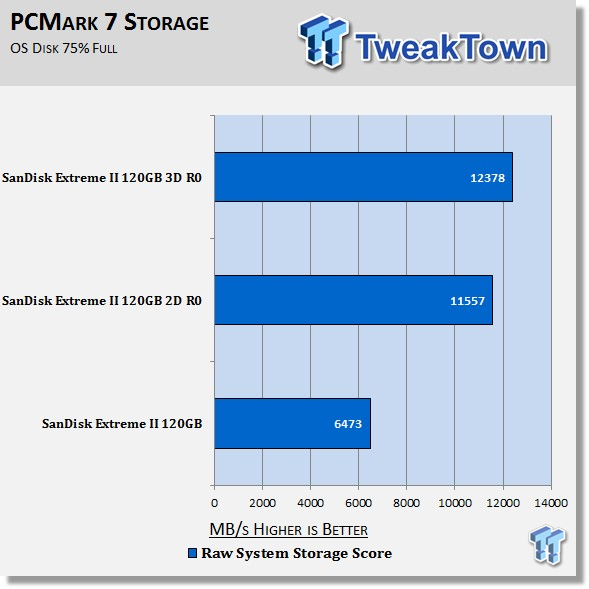
A 3 drive array has nearly double the performance of a single drive when analyzing PCMark 7's Raw system Storage score. Like PCMark Vantage testing showed, there's not a whole lot of difference between a 2 drive and 3 drive array performance wise, but there is a huge difference between a single drive and an array.
Secondary Volume Benchmarks - Disk Response Times
Iometer
Version and / or Patch Used: 1.1.0
Product Homepage: http://www.iometer.org
Download here: http://sourceforge.net/projects/iometer
Iometer is an I/O subsystem measurement and characterization tool for single and clustered systems. It was originally developed by the Intel Corporation and announced at the Intel Developers Forum (IDF) on February 17, 1998 - since then it's become wide spread within the storage industry.
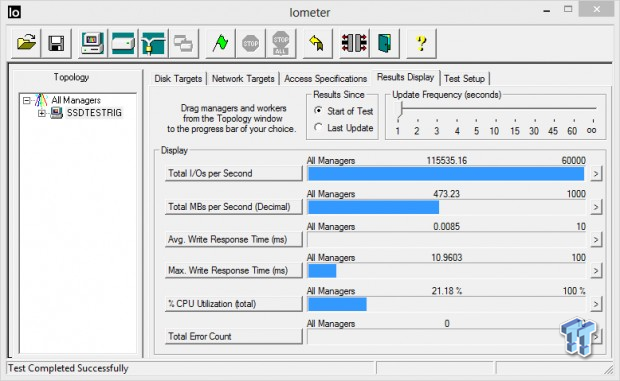
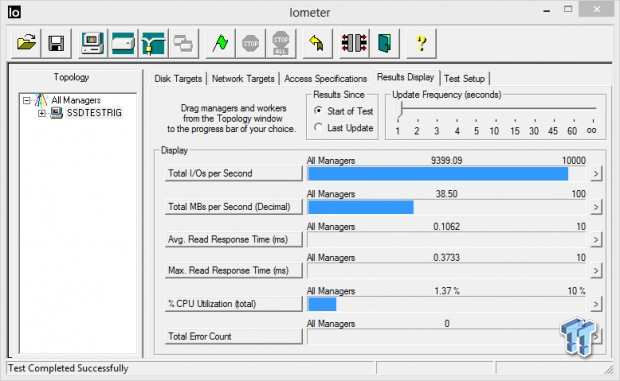
We use Iometer to measure disk response times. Disk response times are measured at an industry accepted standard of 4K QD1 for both write and read. Each test is run twice for 30 seconds consecutively, with a 5 second ramp-up before each test. The drive/array is partitioned and attached as a secondary device for this testing.
Write Response
Read Response
Average Disk Response
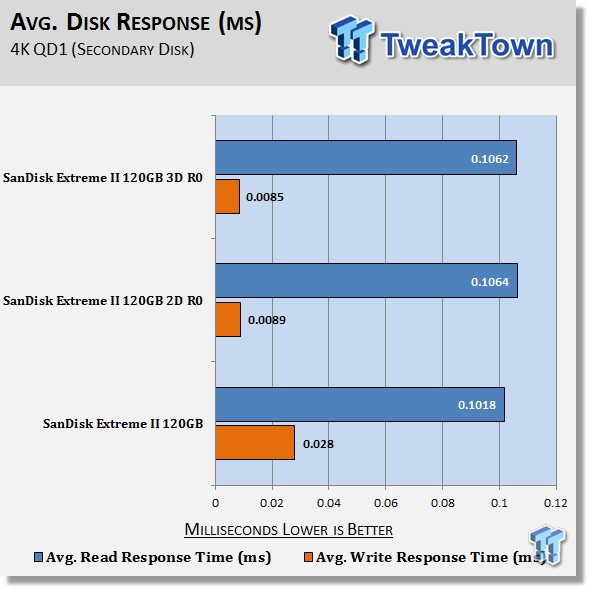
Write response times benefit most from RAID 0. There is a slight latency increase in read response times for an array vs. a single drive.
Maximum Disk Response
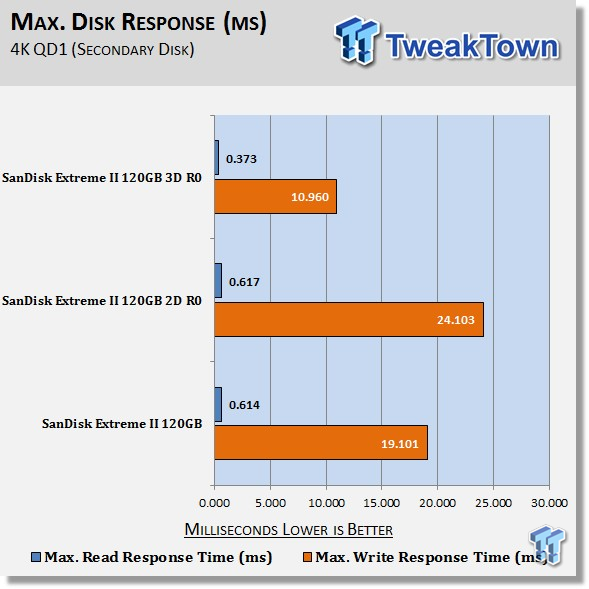
Maximum disk response times are difficult to nail down because they can vary so much from one run to the next, even when running the same drive.
We chart them anyway, because while they may vary from one run to the next, the chart gives us a pretty good overall picture of what to expect from our particular test subject.
Secondary Volume Benchmarks - Disk Bench Test
Disk Bench Test
Version and / or Patch Used: 2.1.1
Product Homepage: http://www.blackmagicdesign.com
Disk Speed Test is an easy to use tool to quickly measure and certify your disk performance for working with high quality video! Simply click the start button and Disk Speed Test will write test your disk using large blocks of data, and then display the result. Disk Speed Test will continue to test writes and reads from your disk so you can evaluate both performance and readability over time.
We rate a drive/arrays video capabilities by the number of different categories that the device is capable of passing. The maximum number of tests that are possible to pass are 45 write tests and 45 read tests. We chart the number of tests a disk/array is capable of passing for a comparison of one drive/array verses another.
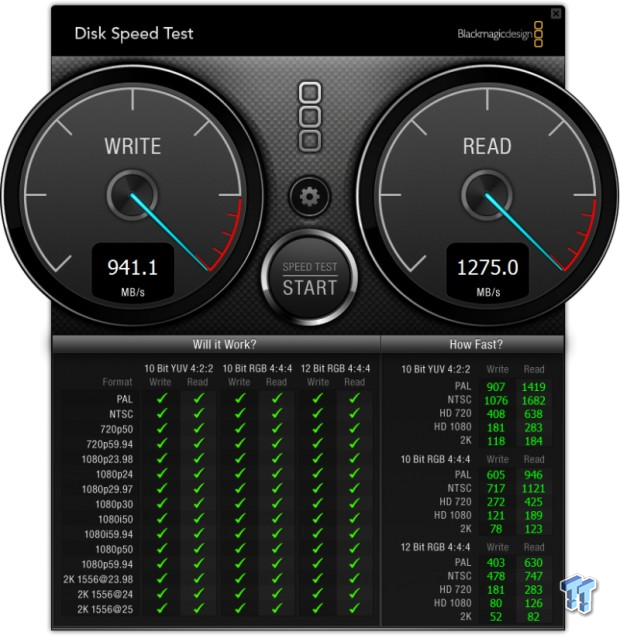
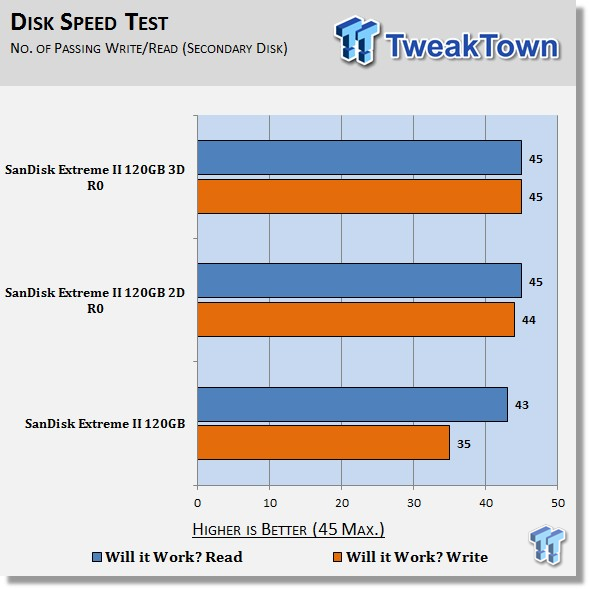
It's very hard for a single drive to be completely HD video capable. This is why serious video processing is almost exclusively done utilizing RAID arrays. Here we see a clear advantage of 3 drives vs. 2. The 3 drive array is completely HD video capable; the 2 drive array isn't.
Secondary Volume Benchmarks - DiskBench
DiskBench - Directory Copy
Version and / or Patch Used: 2.6.2.0
Developer Homepage: Nodesoft
Product Homepage: DiskBench
Download here: http://www.nodesoft.com/diskbench/download
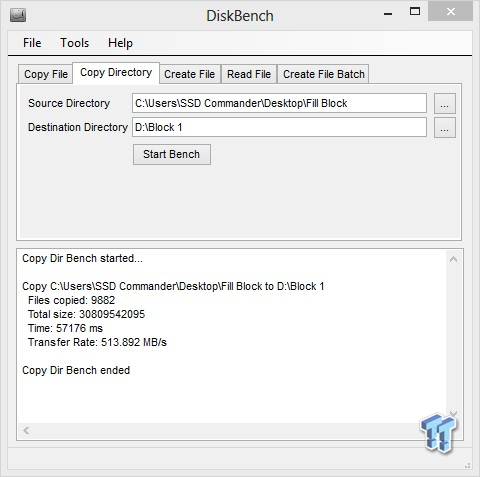
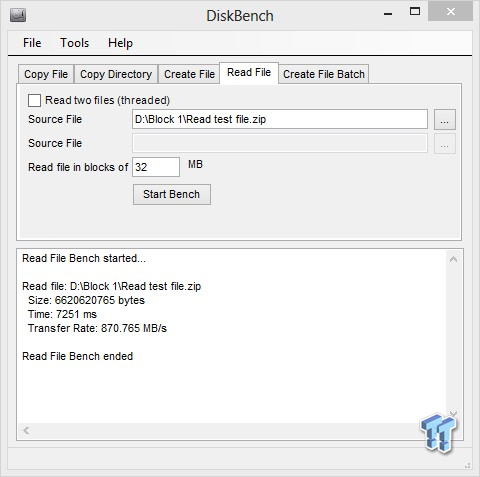
We use DiskBench to time a 28.6GB block of mostly incompressible random data as it's transferred from our OS array to our test drive/array. We then read from a 6GB zip file that's part of our 28.6GB data block to determine the test drive/arrays read transfer rate. The system is restarted prior to the read test to clear any cached data, insuring an accurate test result.
Write Transfer Rate
Read Transfer Rate
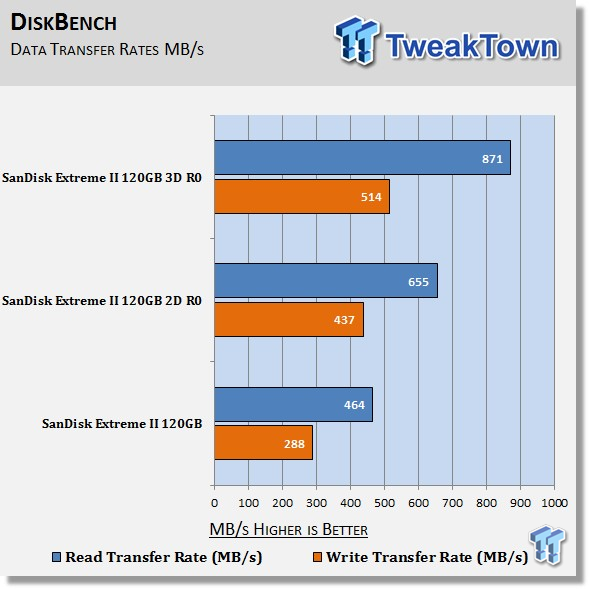
When it comes to large data transfers RAID arrays are vastly superior to a single drive.
Final Thoughts
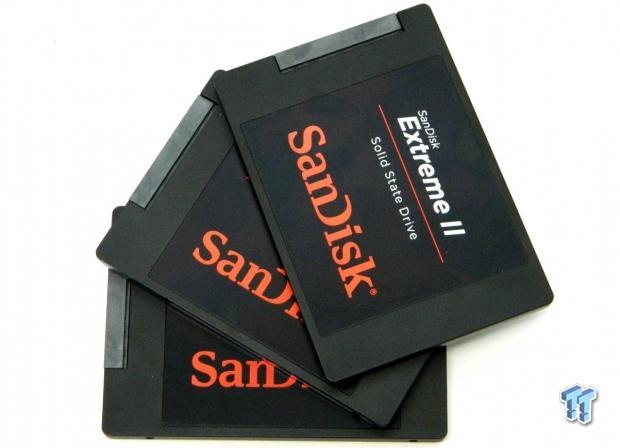
Solid state storage is the most important performance component found in a modern system today. Without it, you do not even have a performance system.
Like SLI does for video performance, RAID 0 does for storage performance. Because storage continues to be the biggest performance bottleneck on your system, there's nothing that will increase overall system performance more than increasing your storage performance. SSD's have taken our systems to a level of performance that can never be accomplished by traditional mechanical storage. Stacks of HDD's in RAID can easily be out performed by a single SSD.
A single SSD provides great overall system performance on its own, but when you start RAIDing them together, that magic gets even better. RAID 0 is something easily accomplished, it's not some black art like extreme overclocking or component modding. The overall storage system performance increase that a pair or more of SSD's in RAID 0 brings to the table is quite compelling; as demonstrated by this RAID report.
Going forward, TweakTown will be bringing you regular consumer based RAID reports to complement our industry leading storage coverage. So, the next time you go to buy an SSD, ask yourself, does it make sense to get one larger capacity drive? Or, do I want the superior performance of two or more drives in RAID 0 to go along with that capacity?

