


Introduction
I posted a blog last week that illustrated how time between each benchmark test can affect performance results. To show what we wanted, we used a small portion of a new benchmark that is built into Futuremark's PCMark 8 2.0. The new Consistency and Adaptivity (yes, I know, it's not really a word) tests add additional features to an already good benchmark.
We've stated before that the key to a good benchmark isn't just the test you are running, but the preconditioning involved before the test. SSD FOB (Fresh out of Box) performance is always great and very close to the limits of SATA III, but real-world performance has days, weeks, and months of data on the drive.
In the past, we've simulated prior stress with our Data on Disk testing by adding data on the drive and running PCMark Vantage's Storage Tests. Futuremark took that test and worked up a better method to show what we consider a better representation of real-world performance.
The following was provided by Futuremark:
Consistency Test
The PCMark 8 Consistency test measures the performance consistency and degradation tendency of a storage system.
The Storage test workloads are repeated. Between each repetition, the storage system is bombarded with a usage that causes degraded drive performance. In the first part of the test, the cycle continues until a steady degraded level of performance has been reached.
Our Latest Editorials Article Coverage
- Building the Ultimate Home Entertainment Server with an ASUSTOR NAS and Viper Gaming NVMe SSDs
- PS5, Xbox Scarlett SSD may use Optane-like ReRAM to supercharge speeds
- Investigation: m.2 Heatsinks, are they worth it?
- Thunderbolt 3 Cable Roundup: Do they differ?
- Alienware 15 R3 Laptop Storage Performance Investigation
In the second part, the recovery of the system is tested by allowing the system to idle and measuring the performance with long intervals.
The test reports the performance level at the start, the degraded steady-state and the recovered state, as well as the number of iterations required to reach the degraded state and the recovered state.
Adaptivity Test
The Adaptivity test measures the "learning" capabilities of the storage system.
The Storage test workloads are repeated and the results are observed. The test continues until a steady state of performance has been reached.
The benchmark reports the performance level at the start and in the steady state, as well as the number of iterations required to reach the state. Today, we're publishing a handful of products that we've run through the new Consistency test and expanding upon the information used in the blog post.
Benchmarks - Test System Setup
Desktop Test System

All tests were on our primary SSD test system that uses an Intel Core i7 Haswell processor and an ASUS Z87 motherboard.
Let's take a look at how the new test works.
1. Precondition phase
1. Write to the drive sequentially through up to the reported capacity with random data, write size of 256*512=131072 bytes.
2. Write it through a second time (to take care of overprovisioning).
2. Degradation phase
1. Run writes of random size between 8*512 and 2048*512 bytes on random offsets for 10 minutes.
2. Run performance test (one pass only). The result is stored in secondary results with name prefix degrade_result_X where X is a counter.
3. Repeat 1 and 2 for 8 times, and on each pass increase the duration of random writes by 5 minutes
3. Steady state phase
1. Run writes of random size between 8*512 and 2048*512 bytes on random offsets for final duration achieved in degradation phase.
2. Run performance test (one pass only). The result is stored in secondary results with name prefix steady_result_X where X is a counter.
3. Repeat 1 and 2 for 5 times.
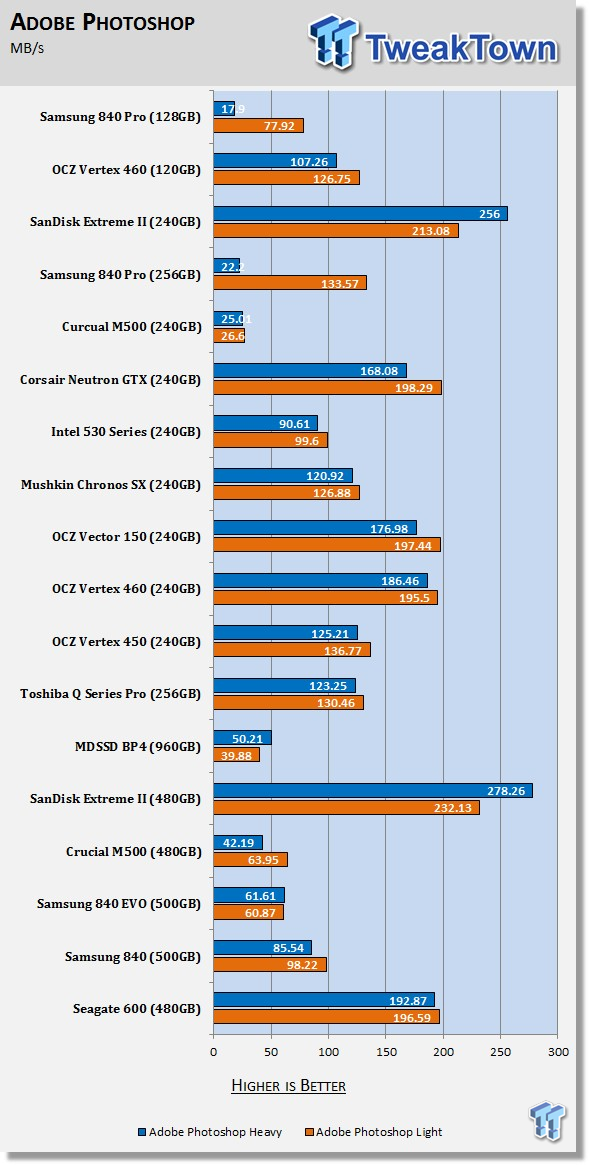
The first page of our results comes from the steady state phase and this shows worst-case performance for a consumer. Other tests in the past used 4K writes to show worst case performance, but we feel that workload is better suited for enterprise workloads and do not represent conditions a consumer SSD will encounter.
1. Recovery phase
1. Idle for 5 minutes.
2. Run performance test (one pass only). The result is stored in secondary result with name recovery_result_X where X is a counter.
3. Repeat 1 and 2 for 5 times.
Our second two results come from the recovery phase. The first shows performance just 5 minutes after the steady state tests. Each test run does take around an hour and twenty minutes, so simply stating 5 minutes later isn't accurate for each of the ten tests.
The third test shows recovery performance after five test runs with five minutes between each test. If you leave your computer on all of the time, this is the level of performance you should expect from your drive. The drive is able to recover on its own. This is the amount of degraded performance for most of us.
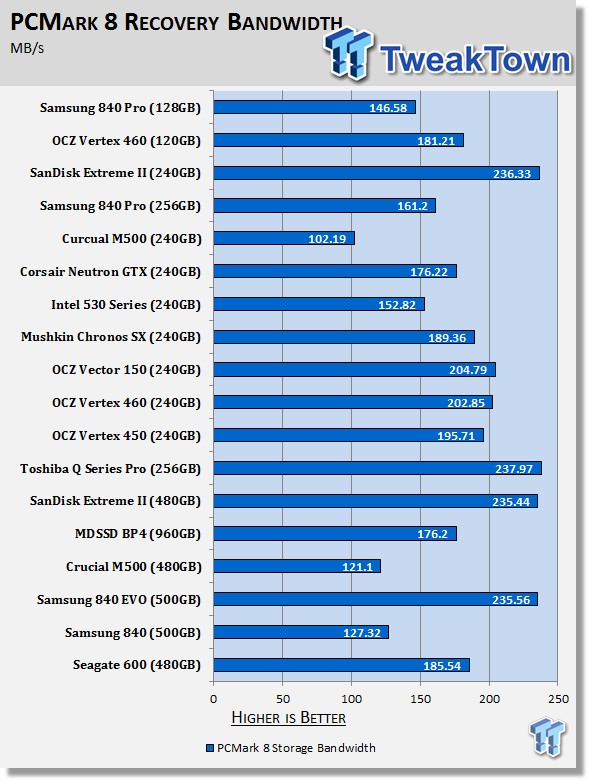
Benchmarks - PCMark 8 Steady State Worst Case
Version and / or Patch Used: 2.0.0
Developer Homepage: http://www.futuremark.com
Product Homepage: http://www.futuremark.com/products/pcmark8
Note: PCMark 8's Storage benchmark is ideal for testing the performance of SSDs, HDDs, and hybrid drives. Using traces recorded from Adobe Creative Suite, Microsoft Office, and a selection of popular games, PCMark 8 Storage highlights real-world performance differences between storage devices.


PCMark 8 Storage Bandwidth

The last set of tests in the steady state phase shows us worst-case performance for the drives tested.
Benchmarks - PCMark 8 5 Minute Recoveryheading
Version and / or Patch Used: 2.0.0
Developer Homepage: http://www.futuremark.com
Product Homepage: http://www.futuremark.com/products/pcmark8
Note: PCMark 8's Storage benchmark is ideal for testing the performance of SSDs, HDDs, and hybrid drives. Using traces recorded from Adobe Creative Suite, Microsoft Office, and a selection of popular games, PCMark 8 Storage highlights real-world performance differences between storage devices.


PCMark 8 Storage Bandwidth

The five-minute recovery test shows us a couple of interesting things. The first is the obvious: the lower capacity drives have fewer pages to recovery, so they will rebound faster than a much larger drive. The second is that some drives are more aggressive at garbage collection than others.
Benchmarks - PCMark 8 Final Recoveryheading
Version and / or Patch Used: 2.0.0
Developer Homepage: http://www.futuremark.com
Product Homepage: http://www.futuremark.com/products/pcmark8
Note: PCMark 8's Storage benchmark is ideal for testing the performance of SSDs, HDDs, and hybrid drives. Using traces recorded from Adobe Creative Suite, Microsoft Office, and a selection of popular games, PCMark 8 Storage highlights real-world performance differences between storage devices.


PCMark 8 Storage Bandwidth
The final recovery phase is where I think most of us are at with our computer use. I keep my notebook on all of the time, but I have a lot of data on the drive as well. My drive recovers the best it can with flash fresh and is ready to receive new data. Of the three benchmark tests we're showing today, this is the one I think we need to pay the closest attention to.
With that said, are the results what you expected to see based on previous reviews and what you've read in the past? You can answer below in the comments section.
Final Thoughts
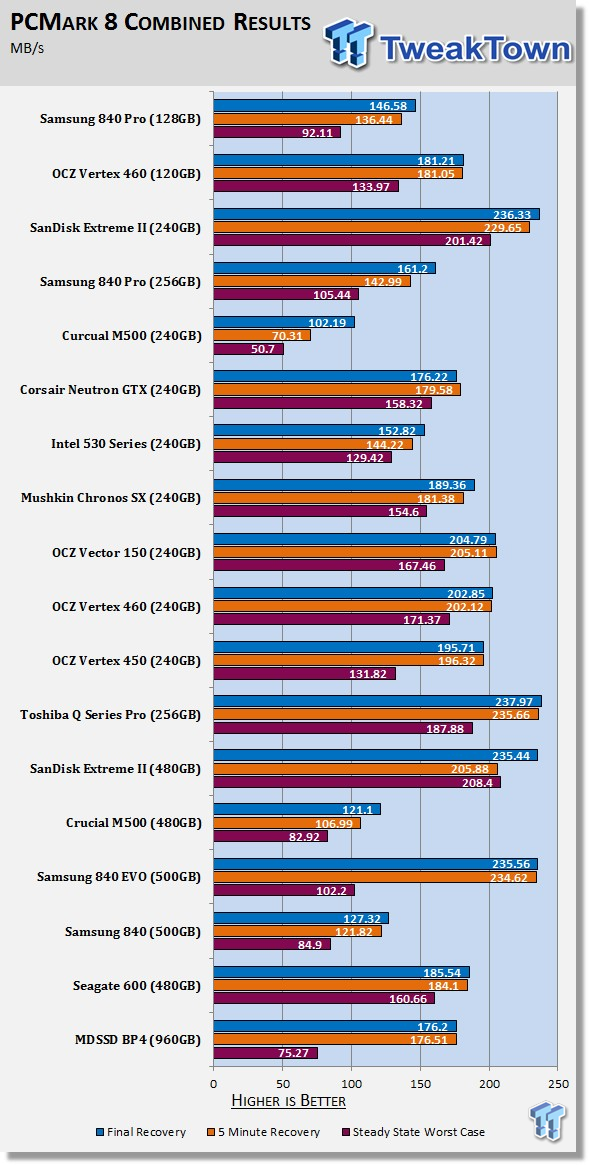
One final chart to look at. Here we see the average of all the tests in one chart. We can see the drives that drop in performance more than others, which drives recover faster, the performance after a large amount of idle time, and, finally, we get to see which drives offer solid performance regardless of wear state.
Of the drives tested, the Toshiba Q Series Pro (256GB), Sandisk Extreme II (240GB / 480GB), and Samsung 840 EVO (500GB) really stand out as the top performers. At this time, we don't have every drive tested nor do we have every capacity size tested. We do have the largest collection of consumer SSDs in the world, so each month we'll update the charts and release a new report based on our findings.
Over the next 45 days, we know of at least six new SSDs coming to market, many from the leaders in the SSD market. We expect the new drives to shake up the market in both performance and price.
Sadly, due to the length of this test and our other long tests, such as the notebook battery life test, we may not always be able to include this data in our standard reviews. When time allows, we will include the test.
Let us know your thoughts by commenting below. We look forward to hearing what you have to say.
 Phison E37T SSD Controller Exclusive Preview - The Fastest DRAMless SSD Platform Yet
 Seagate FireCuda X1070 4TB SSD Review - A New Mainstream Contender
 ASUSTOR Lockerstor 2 Gen2+ AS6702T v2 NAS Review - Fast Performance
 TERRAMASTER D1 SSD Pro Thunderbolt/USB Portable Enclosure Review - Incredible Potential
 Orico K20 Mini 2TB Magnetic Portable SSD Review - Ultra-Thin MagSafe Drive
 Intel Arc desktop GPUs are here to stay, according to an Intel exec
 Capcom still has secret games planned for this year, and is thinking about turning Pragmata into a franchise
 Xbox will 'reset' in the next 100 days, CEO to focus on affordable products and smart investments
 NVIDIA's Jensen Huang meets T1 Esports team and Faker, gifts a signed RTX 5090
 Valve confirms how much more powerful the Steam Machine is than the Steam Deck
 Steam Machine price is 'nowhere near' what Valve originally planned
 Noctua's Pulsar Feinmann F01 gaming mouse is coming soon, and it's got an embedded fan for the sweaty gamer
 AMD denies rumors of not bringing FSR 4.1 to RDNA 3.5 integrated GPUs, decision still up in the air
 Xbox 'must have exclusive content,' CEO Asha Sharma says exclusives to be selected on thoughtful case-by-case basis
 Valve reveals Steam Machine launch window, confirms easy compatibility with Steam Deck verified games
 Asetek Forte S-Series Racing Simulator Bundle Review
 Razer Pro Type Ergo Wireless Split Ergonomic Keyboard Review - Built for Comfort and Support
 ASUS ROG Strix Morph 96 Wireless Gaming Keyboard Review - Great Performance, More Affordable
 SAPPHIRE Radeon RX 9070 GRE PULSE OC Review - A New 1440p Challenger Has Arrived
 NZXT H6 RGB+ Compact Dual-Chamber Chassis Review
 ASRock Radeon RX 9070 GRE Steel Legend Review - The RDNA 4 Mid-Range Reshuffle
 ASRock Z890 Taichi Aqua Motherboard Review - Flagship features without the flagship price
 GIGABYTE Z890I AORUS Ultra Motherboard Review - Mini-ITX with surprisingly good thermals
 Lian Li HYDROSHIFT II 360P OLED Curved Liquid CPU Cooler Review
 The PowerToys utilities I keep enabled on every Windows 11 PC, and the ones I turned off within a week
 TweakTown's Best of Computex 2026 Awards - The Best Hardware, Gaming Gear, and AI
 USB Ports Not Working in Windows 11? Try These Fixes
 ASUS WiFi Routers and Networking Solutions Deliver Long-term Security and Reliability with No Additional Cost
 Second Monitor Not Detected in Windows 11? Try These Fixes
 Turn Your Old Smartphone Into a Dedicated Webcam for Your Windows PC
 The Send To menu is the right-click feature on Windows 11 that nobody bothers to customize
 Windows 11 will not let you pin a folder to the taskbar, but a 30-second workaround does
 ASUS ProArt Displays Unlock Creativity with Professional Monitors for Everyone