


Our Verdict
Introduction, Drive Specifications, Pricing & Availability
When Samsung launched the 960 EVO over a year ago, it was by far the highest performing consumer TLC SSD ever made. However, the competition was not only able to catch the 960 EVO over time, they have been able to surpass the 960 EVO. Case-in-point would be the newest Western Digital Black and Sandisk Extreme Pro NVMe SSDs.
The 970 EVO has been a long time coming. Normally before any competitor has a chance to pull even or take the crown from Samsung, they release something new and disruptive that keeps the performance crown firmly in their camp. Not so this time around.
For the first time, Samsung has serious competition on the consumer TLC front. Samsung knows this and has come to the battle armed with a new NVMe controller, 64-layer 3-bit V-NAND, a new NVMe driver, and new "Intelligent TurboWrite" algorithms that take the EVO series to new performance heights. But is it enough?
Samsung's new slogan is "Unreal Performance, Realized". The 970 EVO is powered by Samsung's brand new "Phoenix" NVMe controller. Phoenix, like its predecessor "Polaris" sports a 5-core ARM-based processor. One core is dedicated to host communication and the other four to the NAND array. Phoenix features increased core-clock speeds and enhanced thermal capabilities over Polaris.
Like its predecessor, the 960 EVO, the 970 EVO features a layer of copper film in the label on the back of the drive's PCB which helps dissipate heat faster. In addition, the Phoenix controller has a new nickel coating allowing it to dissipate more heat, which in turn helps maintain peak performance better than ever before.
The 970 EVO's improved thermals mean that Samsung's Dynamic Thermal Guard (DTG) trigger point doesn't kick in until 14 seconds later than it does on the 960 EVO.
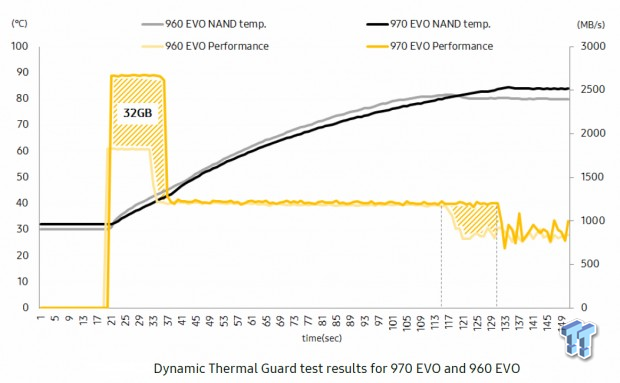
DTG triggering 14 seconds later than before allows the 970 EVO to transfer approximately 26% (approximately 32GB) more sequential write data without throttling than was possible with the 960 EVO.
Our Latest SSD Review Coverage
- Phison E37T SSD Controller Exclusive Preview - The Fastest DRAMless SSD Platform Yet
- Seagate FireCuda X1070 4TB SSD Review - A New Mainstream Contender
- Micron 3610 2TB SSD Review - DRAMless QLC at 11,000 MB/s
- SK hynix Platinum P51 2TB SSD Review - A Powerful Gen5 Alternative
- Biwin Black Opal X570 Pro 8TB SSD Review - Massive Capacity with Elite Performance
Samsung's latest generation 64-layer 3-bit V-NAND is faster and far more enduring than previous 48-layer 3-bit V-NAND. Samsung has increased the 970 EVO's endurance rating by 50% at each capacity point over the 960 EVO. Additionally, Samsung has increased the EVO's warranty period from 3-years to 5-years.
With Samsung's potent "Phoenix" controller powering a 64-layer V-NAND flash array, the 970 EVO delivers performance that is far better than the 960 EVO. The 970 EVO provides up to 32% faster sequential speeds and up to 36% faster random speeds than its predecessor - the 960 EVO.
The 960 EVO's capacity topped out at 1TB, but with the move to 64-layer V-NAND the 970 EVO's highest capacity tops out at 2TB. 2TB on a single-sided M.2 x2280 is industry leading, and so far only Samsung has accomplished this feat in the consumer space.
Samsung remains the only company with total vertical integration in the consumer NAND-based SSD space. This means that every major component (Controller, Flash, DRAM) are Samsung's own. This allows Samsung complete quality control, lower manufacturing costs and faster innovation implementation that simply isn't possible for most other purveyors of NAND-based SSDs.
Samsung's vertical integration extends into the software front as well. Like all Samsung SSDs, the 970 Series is fully compatible with Samsung's own "Magician" SSD toolbox and Samsung migration software. Samsung also provides a proprietary NVMe driver for the 970 EVO. Samsung's NVMe driver 3.0 significantly boosts performance and increases compatibility.
A proprietary NVMe driver makes it possible for Windows 7 users to experience the full performance of Samsung's NVMe SSDs. Full performance for Windows 7 users simply isn't possible without a proprietary NVMe driver. This is because the Windows 7 add-in NVMe driver is incapable of delivering full NVMe performance, or even performance that is anywhere near as good as the Windows 10 NVMe driver.
The 960 EVO was overall the best performing consumer TLC SSD you could buy when it launched over a year ago, but it had one glaring weakness - heavy workload performance. When running extended workloads that induce steady-state, such as PCMark 8 Extended, the 960 EVO could not keep pace with most SSDs even if they were inferior overall.
Let's get into the review and see if Samsung has been able to address weak steady-state performance and if the 970 EVO has what it takes to snatch back the consumer TLC performance crown.
Specifications, Features and Availability
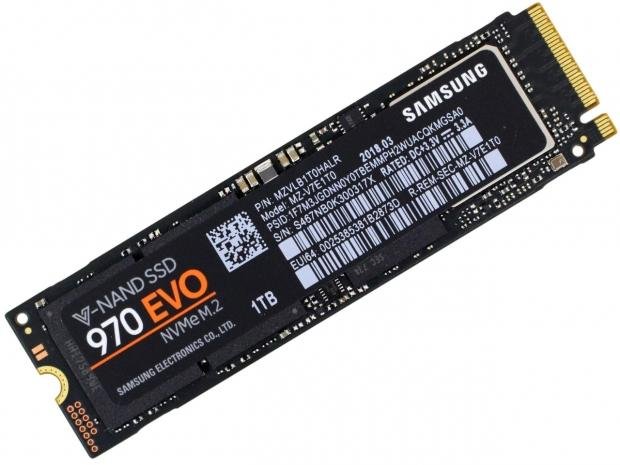
Samsung 970 EVO NVMe 1TB M.2 PCIe NVMe SSD
Samsung's 970 EVO series is available at four capacity points: 250GB, 500GB, 1TB and 2TB
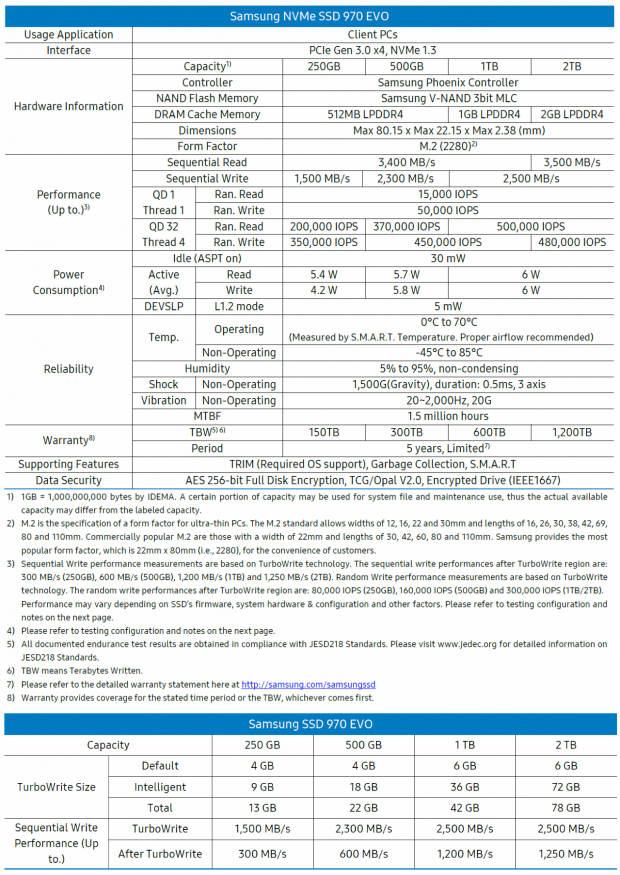
The 1TB 970 EVO we have on the bench sports the following factory specifications:
- Sequential Read: up to 3,400 MB/s
- Sequential Write: up to 2,500 MB/s
- Max 4K Random Read Speed: up to 500,000 IOPS
- Max 4K Random Write Speed: up to 450,000 IOPS
- 4K QD1 Random Read Speed: up to 15,000 IOPS
- 4K QD1 Random Write Speed: up to 50,000 IOPS
- Endurance: up to 600 TBW
- MTBF: 1.5 Million Hours
- Warranty: 5-Year Limited Warranty
MSRP Samsung 970 EVO Series:
250GB = $119.99
500GB = $229.99
1TB = $449.99
2TB = $849.99
Availability: May 2018
Features: TRIM (Required OS support), Garbage Collection, S.M.A.R.T Monitoring, Samsung NVMe Driver 3.0.
Data Security Features: AES 256-bit Full Disk Encryption, TCG/Opal V2.0, Encrypted Drive (IEEE1667).
Available Free Software: Samsung Magician SSD Toolbox, Samsung Data Migration Tool and Samsung NVMe driver 3.0.
Samsung, as they always do, provide value-add software for your 970 EVO - available free via download. Samsung's Magician SSD Toolbox allows you to monitor the drive, tune your OS for optimized SSD usage, update firmware, Secure Erase, and test performance.
Samsung's Data Migration software makes it as easy as a couple of mouse clicks to migrate your Operating System to your new 970 EVO SSD. Samsung's NVMe driver 3.0 provides better performance, better data security and higher compatibility.
Drive Details
Samsung 970 EVO 1TB M.2 PCIe NVMe SSD
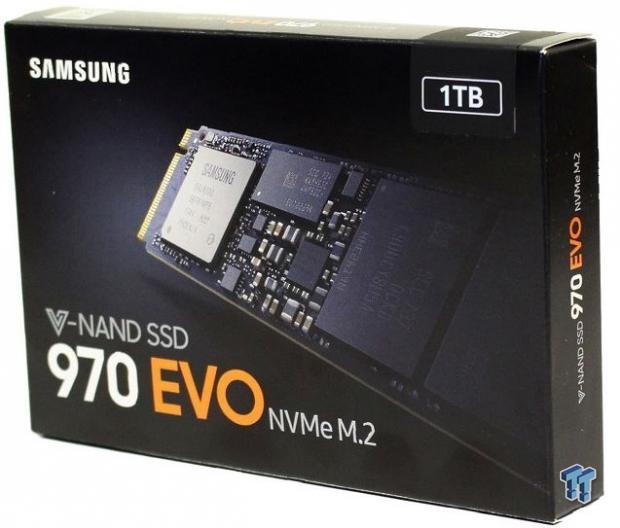
The 970 EVO ships in familiar looking packaging. There is an image of the enclosed SSD on the front. Capacity, model, and V-NAND architecture are advertised here.
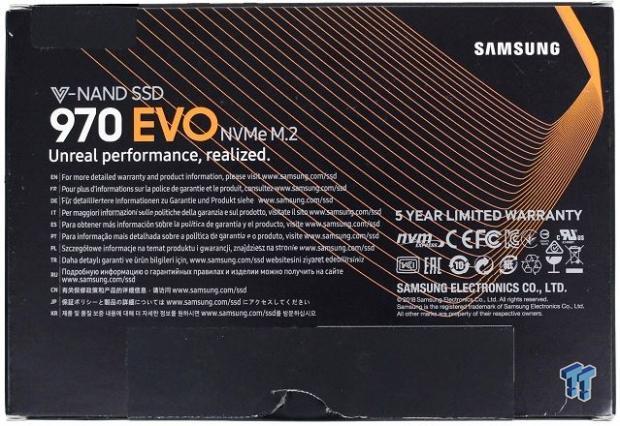
The back of the packaging advertises Samsung's new slogan and 5-year warranty.

The drive is cradled in a thick plastic protective carrier.
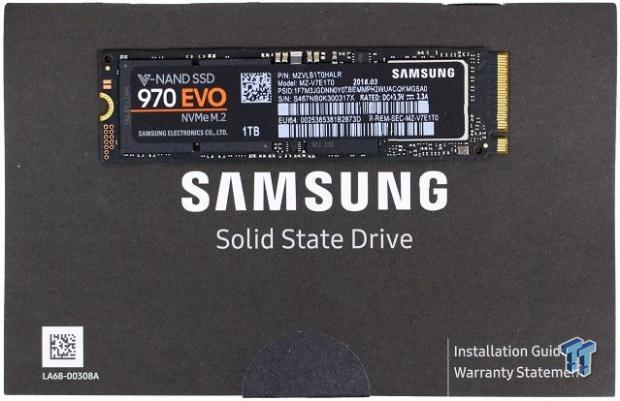
Included with the drive is a printed installation guide and warranty statement.
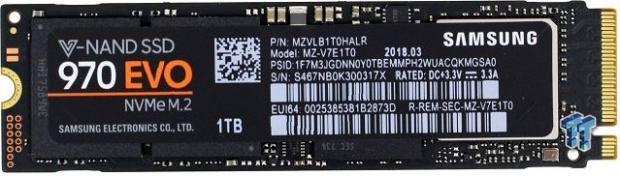
The component side of the PCB has a manufacturer label covering the major components.
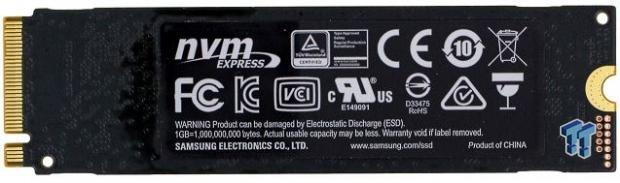
The back of the PCB is devoid of components. This is where Samsung's exclusive copper infused thermal label is applied.
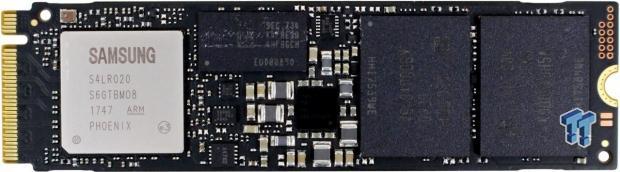
Removing the manufacturer label reveals Samsung's nickel plated "Phoenix" five-core 8-channel NVMe controller, a 1024MB Samsung DDR4 package and two 512GB 64-layer V-NAND 3-bit flash packages.
Test System & Drive Properties
Jon's Consumer Z270 PCIe SSD Review Test System Specifications
- Motherboard: ASRock Z270 Taichi - Buy from Amazon
- CPU: Intel Core i7 7700K @ 5.0GHz - Buy from Amazon / Read our review
- Cooler: Swiftech H2O-320 Edge - Buy from Amazon / Read our review
- Memory: Corsair Vengeance LPX DDR4 16GB 3000MHz - Buy from Amazon
- Video Card: Onboard Video
- Case: IN WIN X-Frame - Buy from Amazon / Read our review
- Power Supply: Seasonic Platinum 1000 Watt Modular - Buy from Amazon / Read our review
- OS: Microsoft Windows 10 Professional 64-bit - Buy from Amazon
- Drivers: MS Win 10 NVMe driver
We would like to thank ASRock, Crucial, Intel, Corsair, RamCity, IN WIN, and Seasonic for making our test system possible.
Drive Properties
Samsung 970 EVO 1TB M.2 PCIe NVMe SSD OS Disk 75% Full
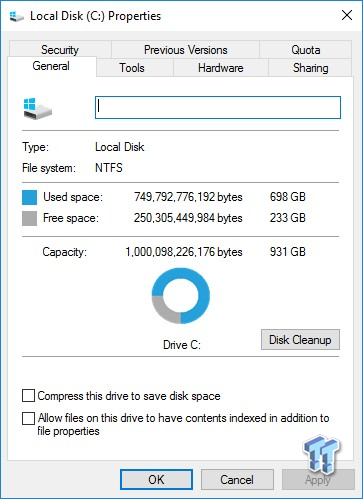
The majority of our testing is performed with the test subject as our boot volume. Our boot volume is 75% full for all OS Disk "C" drive testing to replicate a typical consumer OS volume implementation. We feel that most of you will be utilizing your SSDs for your boot volume and that presenting you with results from an OS volume is more relevant than presenting you with empty secondary volume results.
System settings: Cstates and Speed stepping are both disabled in our systems BIOS. Windows High-Performance power plan is enabled. We are utilizing Windows 10 Pro 64-bit OS (Build 14393) for testing except for our MOP (Maxed-Out Performance) benchmarks where we switch to Windows Server 2008 R2 64-bit. Empty Windows 10 benchmark screenshots will also be shown on our MOP page.
Please note: When comparing our results to those of other review sites, look at page 10 Maxed Out Performance-Windows 10 which is done with the disk empty.
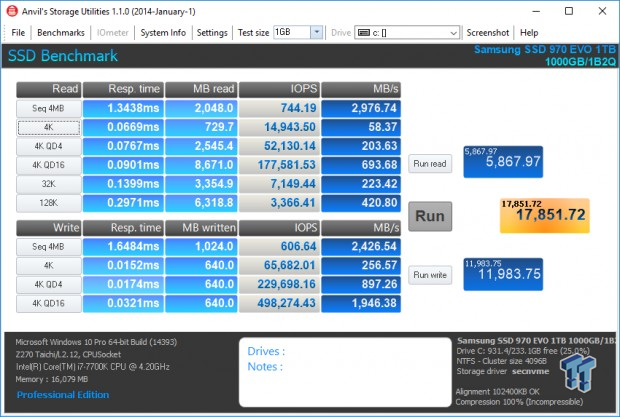
Synthetic Benchmarks - ATTO & Anvil Storage Utilities
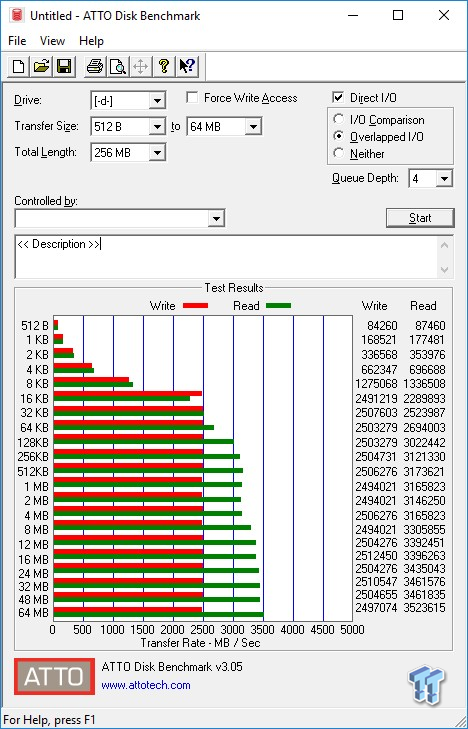
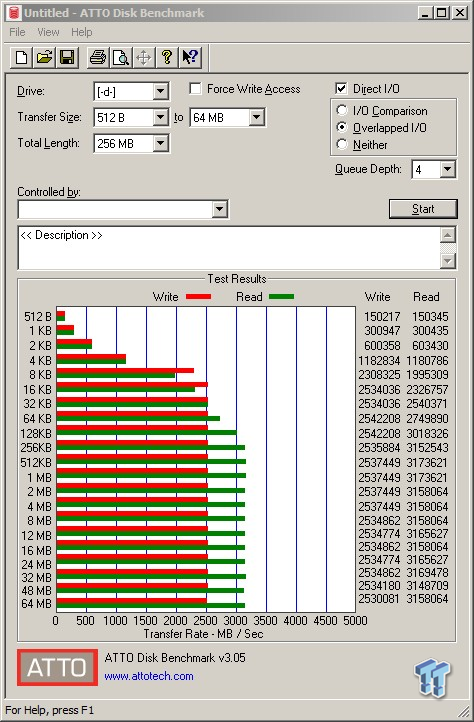
ATTO
Version and / or Patch Used: 3.05
ATTO is a timeless benchmark used to provide manufacturers with data used for marketing storage products. When evaluating ATTO performance we focus on the drive's performance curve.
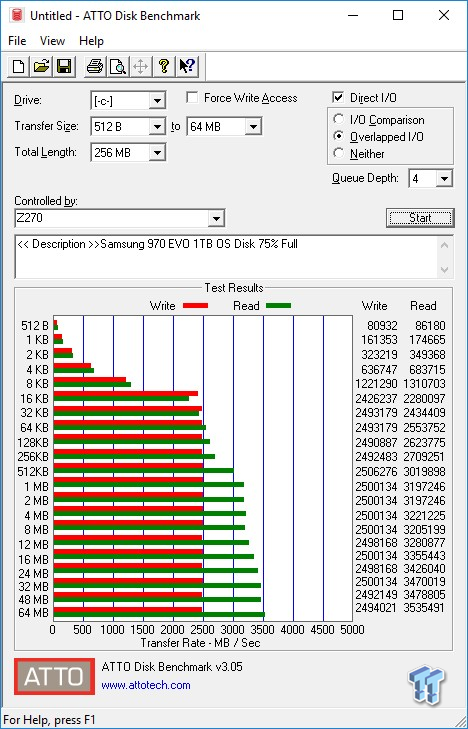
We are able to attain factory max sequential performance specifications despite this test running at only QD4.
Sequential Write
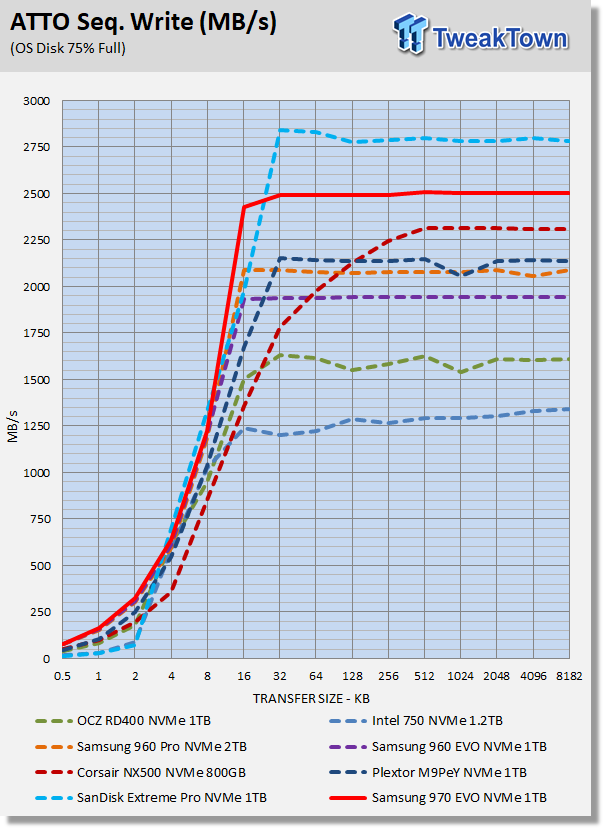
Overall, this is the best performance curve we've seen from any flash-based SSD. The 970 EVO doesn't max out as high as WD/Sandisk's Extreme Pro, but that's not what we are looking for. We are looking for as vertical of a performance curve as possible, and this is where the 970 EVO is delivering the best we've seen. Lab record.
Sequential Read
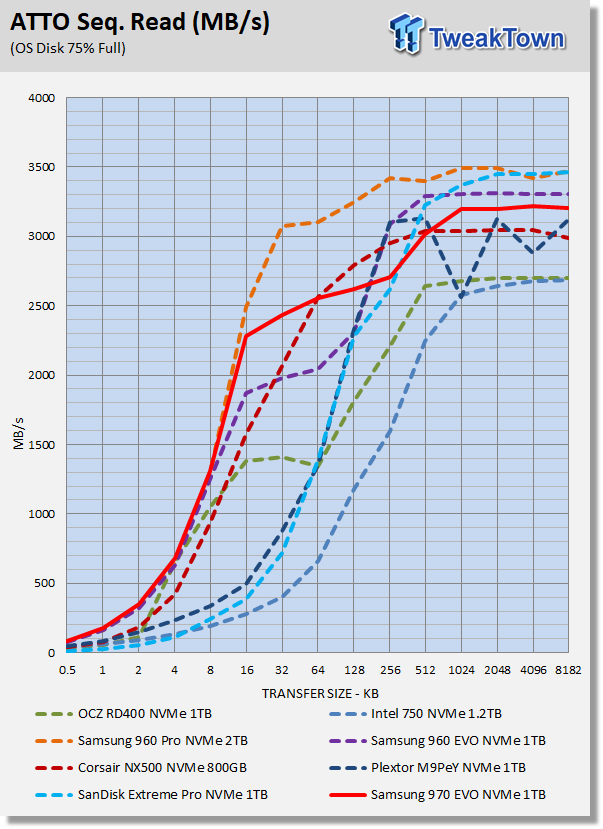
The 970 EVO's small-file performance gives us exactly what we are looking for. However, at transfer sizes larger than 16KB, the 970 EVO drops off a bit exactly like the 960 EVO does. Our chart only goes up to 8MB transfer size, so while we can see from the benchmark screenshot that the 970 EVO exceeds 3500MB/s it is not reflected on our chart.
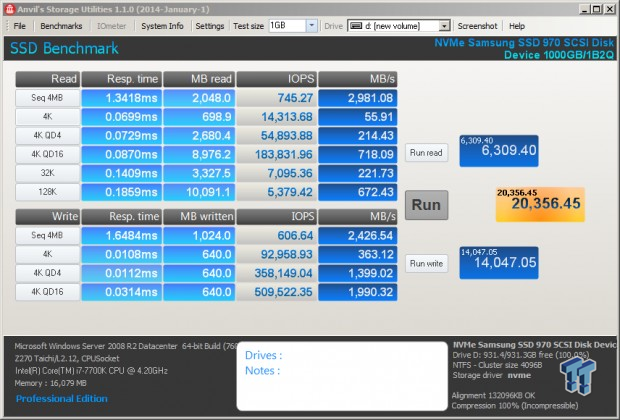
Anvil Storage Utilities
Version and / or Patch Used: 1.1.0
Anvil's Storage Utilities is a storage benchmark designed to measure the storage performance of SSDs. The Standard Storage Benchmark performs a series of tests; you can run a full test or just the read or write test, or you can run a single test, i.e. 4K QD16. When evaluating performance with Anvils, we focus on total score. When evaluating NVMe SSDs we are typically looking for a minimum total score of over 10K. We place a greater importance on read performance than write performance.
Scoring
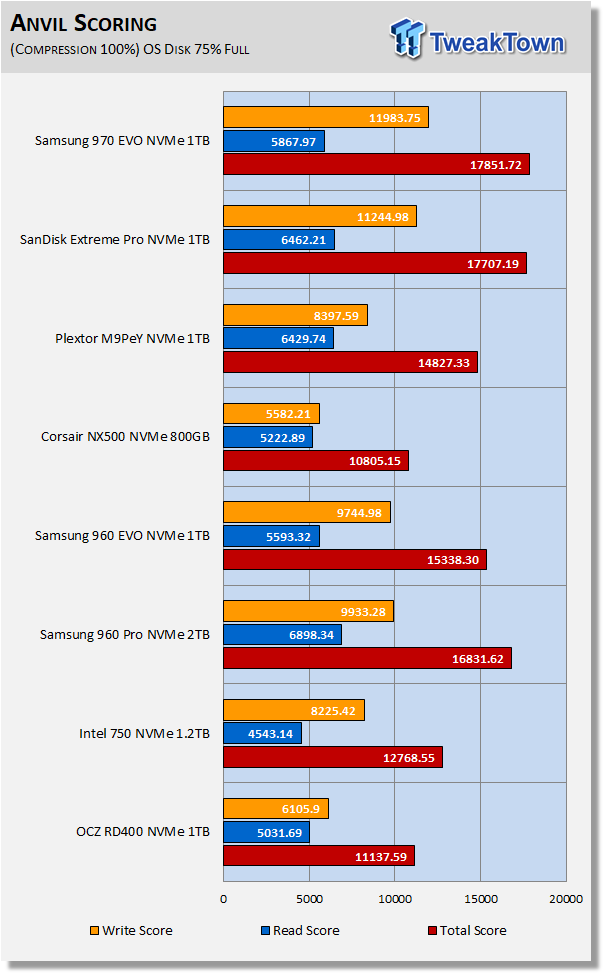
In terms of total score, the 970 EVO 1TB sets a new lab record for flash-based consumer SSDs. The write score is also a new lab record. However, Samsung's 960 Pro still retains the crown for overall synthetic read performance.
(Anvil) Read IOPS through Queue Depth Scale
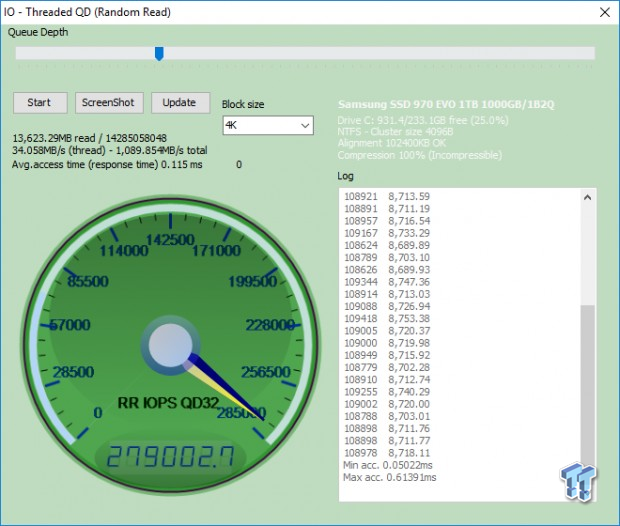
We are hitting 279,000 4K random read IOPS at QD32 with our system disk 75% full.
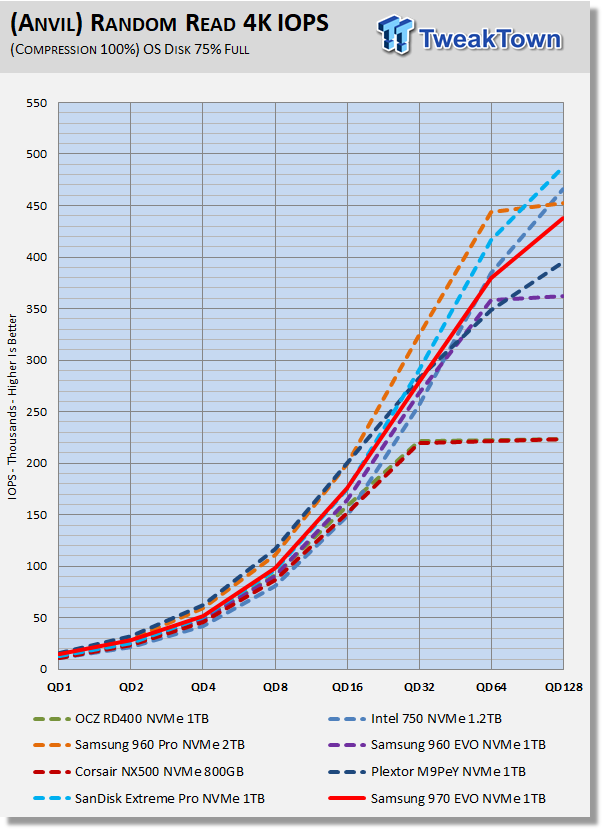
The 970 EVO delivers random read performance that is almost identical to Sandisk's Extreme Pro at queue depths of up 16. At queue depths above 16, the Extreme Pro pulls away. Overall the 970 EVO delivers the fourth best performance curve coming in behind the M9Pe, 960 Pro and the Extreme Pro.
(Anvil) Write IOPS through Queue Scale
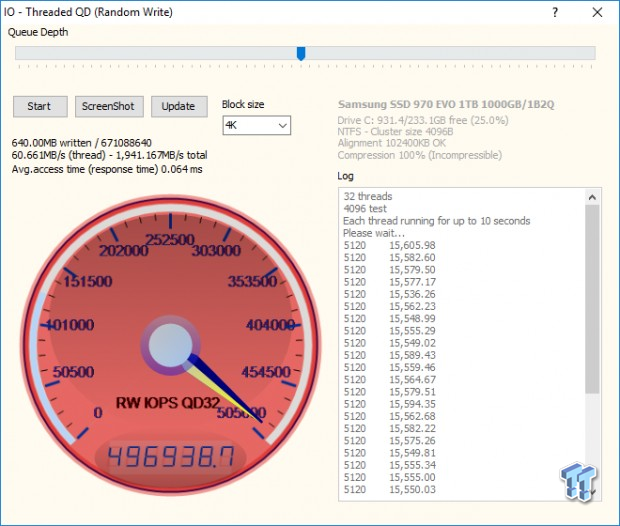
At QD32 with a partition on our drive, and 75% full we are able to easily surpasses factory specs which are given at QD128.
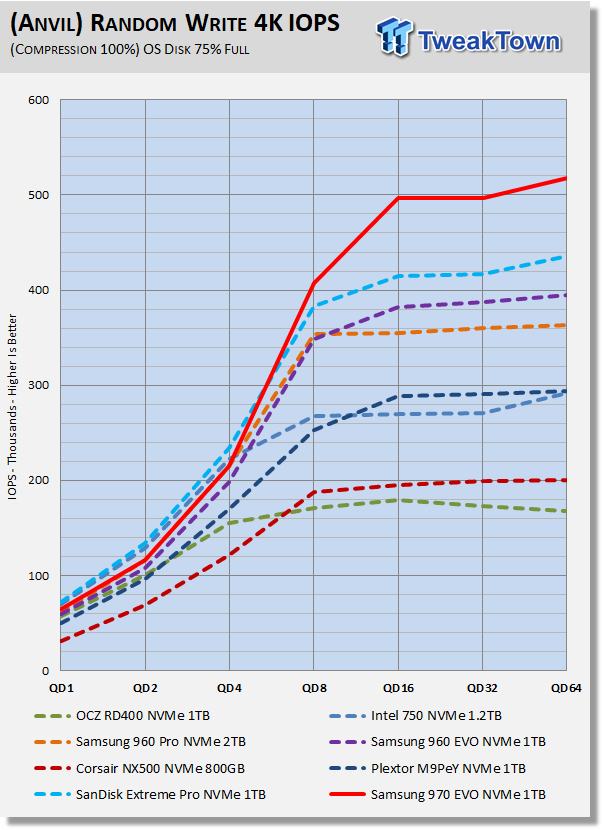
This is another lab record for highest IOPS. However, we value low queue depth random performance more than high queue depth performance. Even though this is the best performance curve we've seen from a Samsung SSD, it's not as good as we are getting from Sandisk's Extreme Pro and Intel's 750.
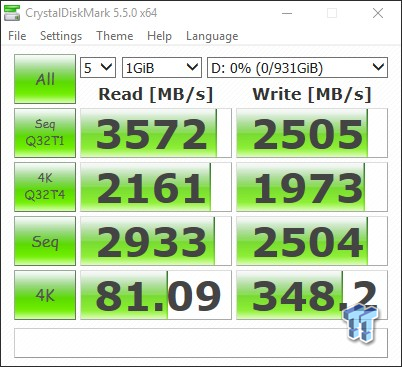
Synthetic Benchmarks - CrystalDiskMark & AS SSD
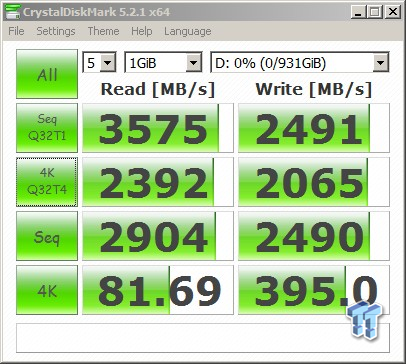
CrystalDiskMark
Version and / or Patch Used: 3.0 Technical Preview
CrystalDiskMark is disk benchmark software that allows us to benchmark 4K and 4K queue depths with accuracy. Note: Crystal Disk Mark 3.0 Technical Preview was used for these tests since it offers the ability to measure native command queuing at QD4. When evaluating CDM results, we focus on 4K random performance at QD1 and QD4.
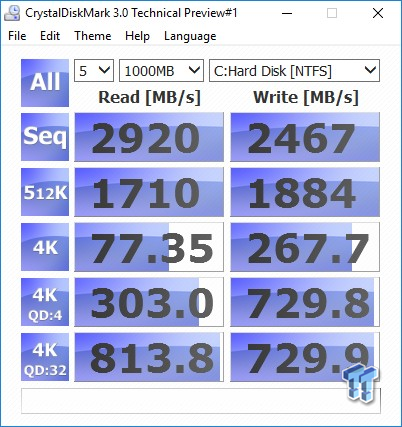
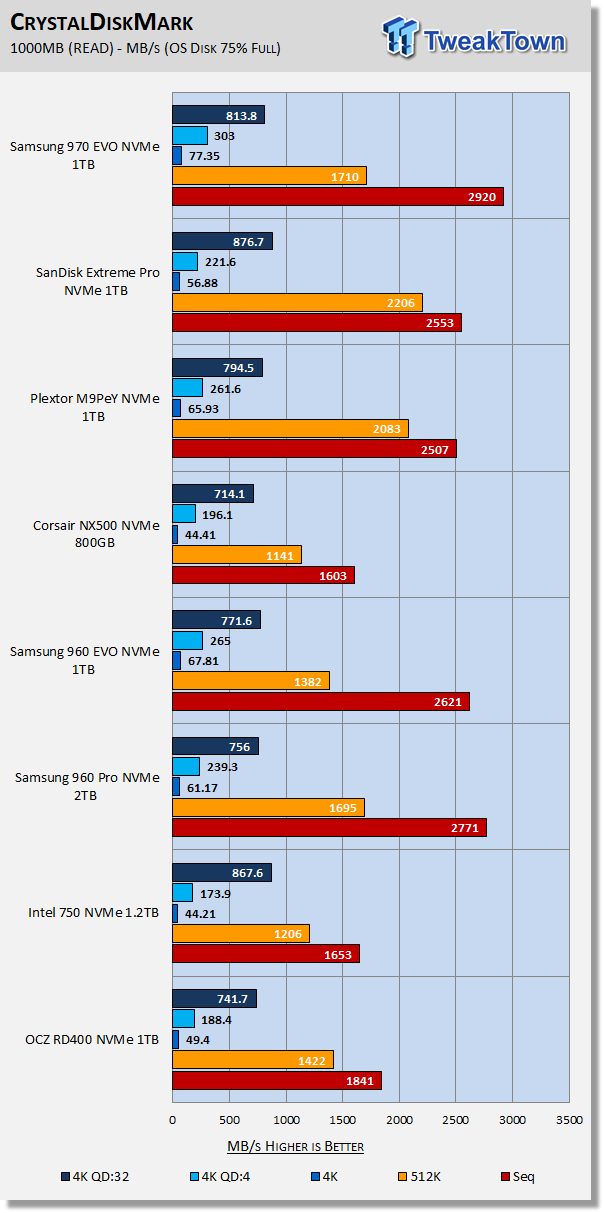
Focusing in on QD1 and QD4 we see our 1TB 970 EVO delivering NAND-based lab records for both. Additionally, the 970 EVO's sequential read performance at QD1 is another lab record. This is what we are looking for most of all - random read performance at low queue depths. This is where performance matters most in an OS environment.
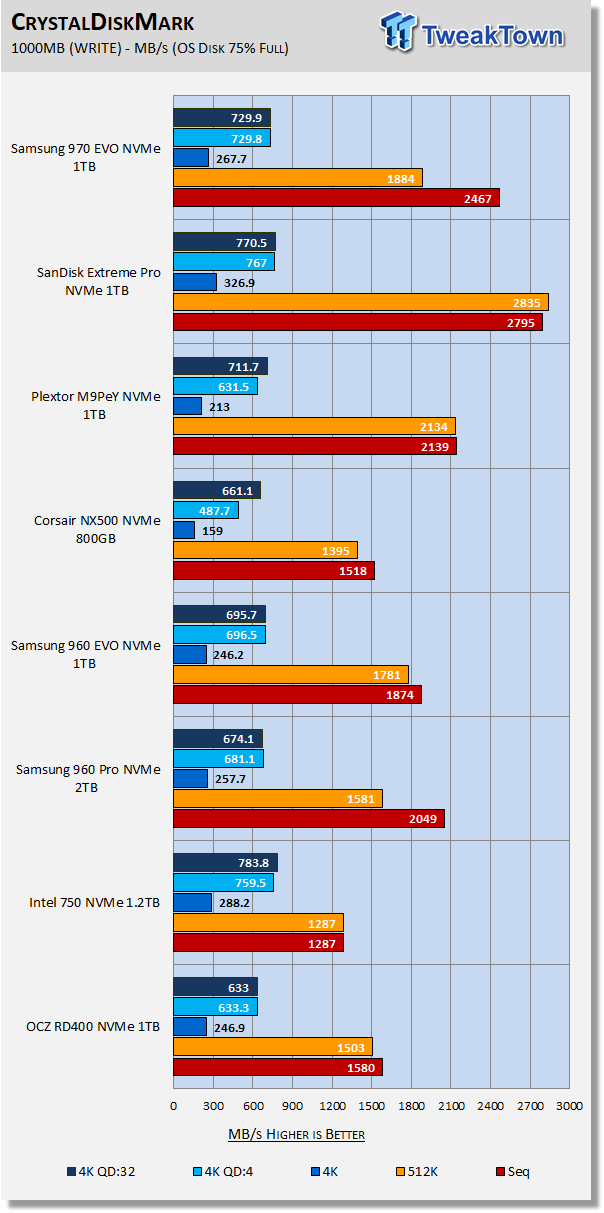
Overall, this is the second best CDM write performance we've seen from a flash-based consumer SSD. The write-centric Sandisk Extreme Pro remains our champion when writing data at low queue depths.
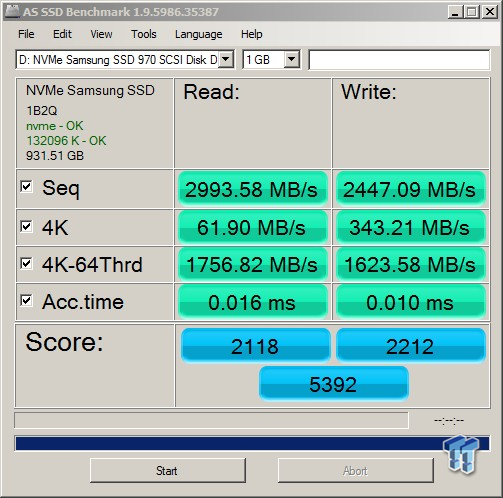
AS SSD
Version and / or Patch Used: 1.8.5611.39791
AS SSD determines the performance of SSDs. The tool contains four synthetic as well as three practice tests. The synthetic tests are to determine the sequential and random read and write performance of the SSD. We evaluate AS SSD performance in terms of overall score. We are looking for a minimum score of 2,000 when evaluating NVMe SSDs.
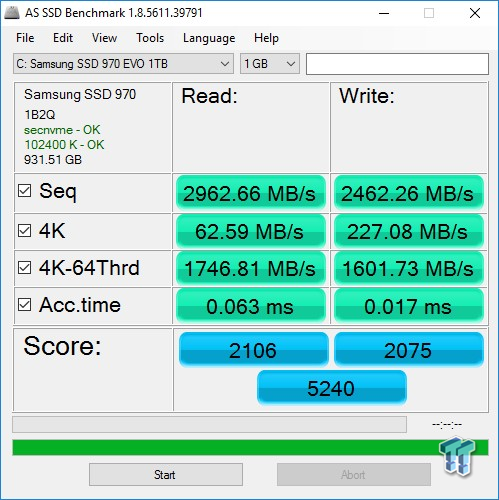
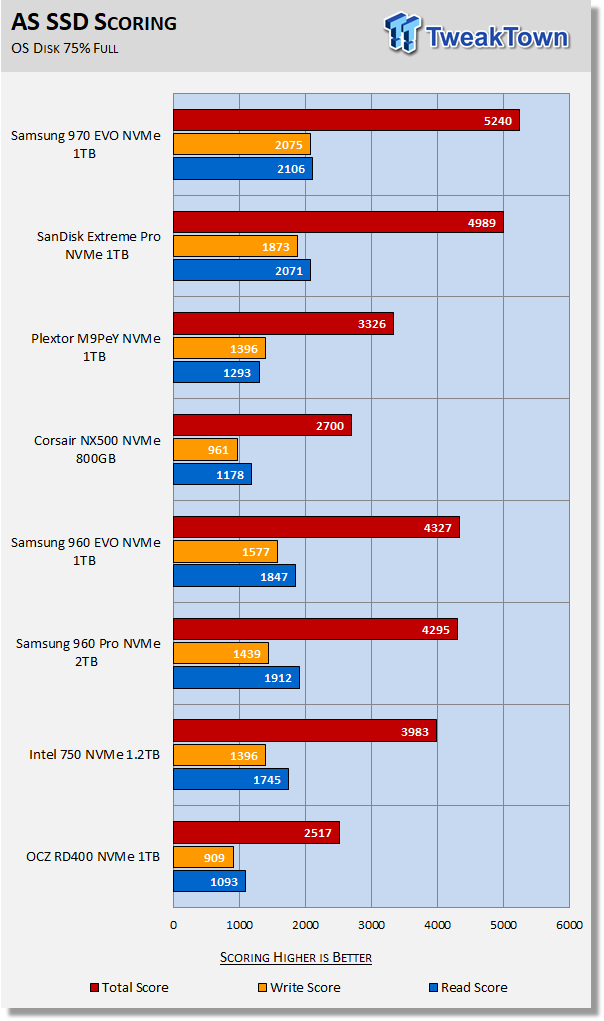
AS SSD is a demanding test, but Samsung's 970 EVO makes short work of it. Another lab record goes to the 970 EVO 1TB with a massive score of over 5,200. Keep in mind that this is our system disk and it is 75% full.
Benches (OS) - Vantage, PCMark 7, PCMark 8 & SYSmark 2014 SE
Moderate Workload Model
We categorize these tests as indicative of a moderate workload environment.
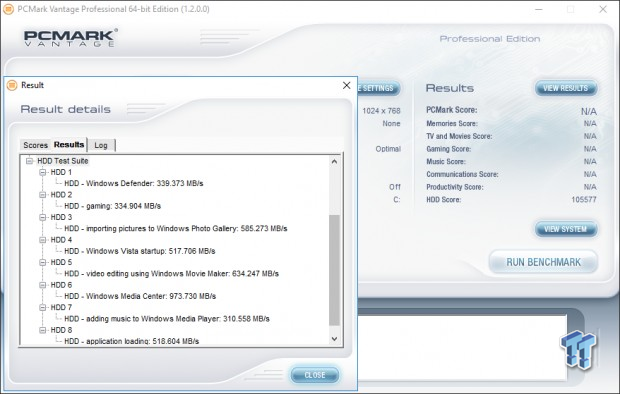
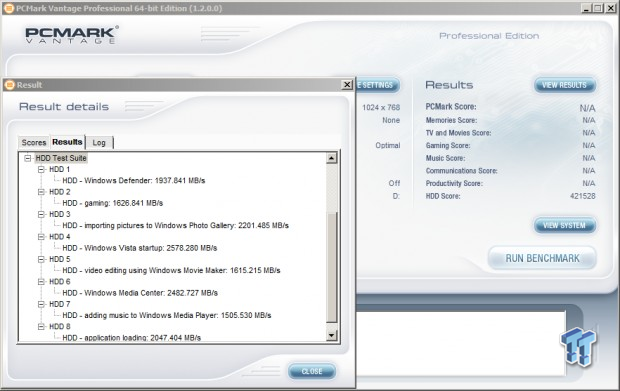
PCMark Vantage - Hard Disk Tests
Version and / or Patch Used: 1.2.0.0
The reason we like PCMark Vantage is because the recorded traces are played back without system stops. What we see is the raw performance of the drive. This allows us to see a marked difference between scoring that other trace-based benchmarks do not exhibit. An example of a marked difference in scoring on the same drive would be empty vs. filled vs. steady state.
We run Vantage three ways. The first run is with the OS drive 75% full to simulate a lightly used OS volume filled with data to an amount we feel is common for most users. The second run is with the OS volume written into a "Steady State" utilizing SNIA's consumer guidelines. Steady-state testing simulates a drive's performance similar to that of a drive that been subjected to consumer workloads for extensive amounts of time. The third run is a Vantage HDD test with the test drive attached as an empty, lightly used secondary device.
OS Volume 75% Full - Lightly Used

OS Volume 75% Full - Steady State
Secondary Volume Empty - FOB

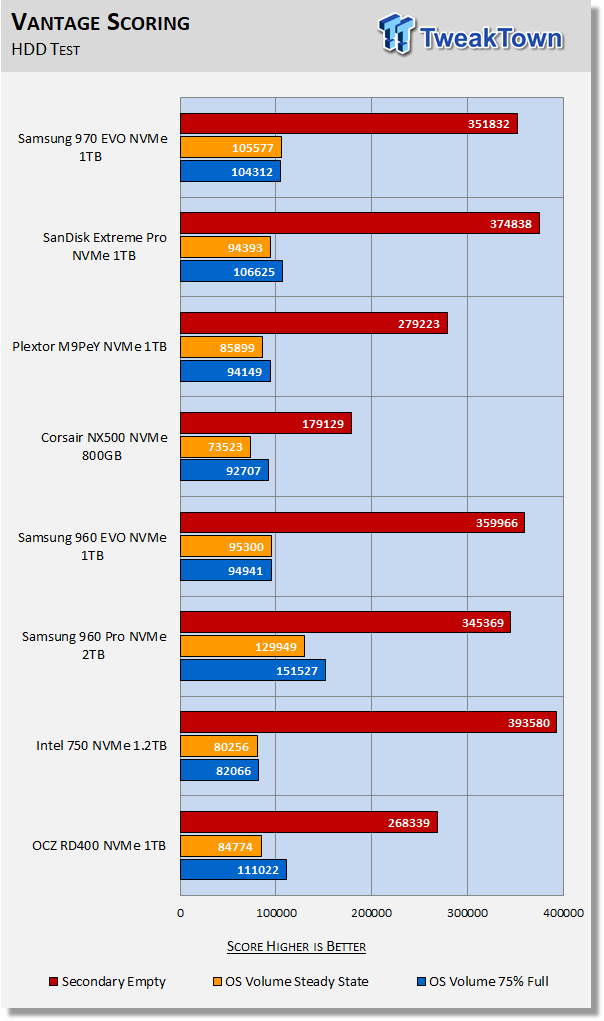
The important scores to pay attention to are "OS Volume Steady State" and "OS Volume 75% full." These two categories are most important because they are indicative of typical consumer user states. When a drive is in a steady state, it means garbage collection is running at the same time it's reading/writing.
Focusing in on steady-state performance, we find the 970 EVO delivering the second-best performance for a flash-based SSD. Like its predecessor, the 970 EVO remains the only SSD to actually deliver better performance in a steady-state than when lightly used and 75% full. The 970 EVO shows a nice increase of 10K over the 960 EVO. This is a lab record for a TLC SSD in steady-state.
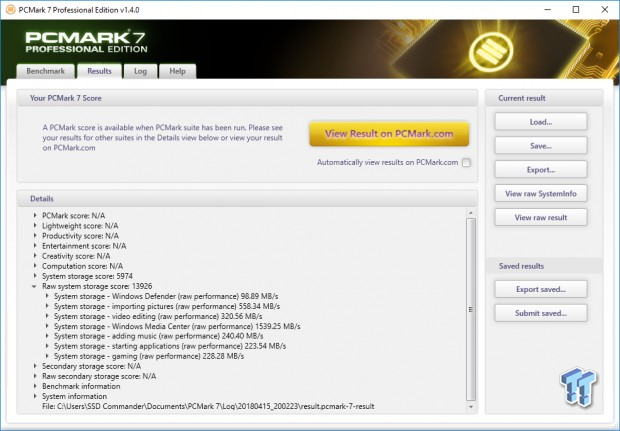
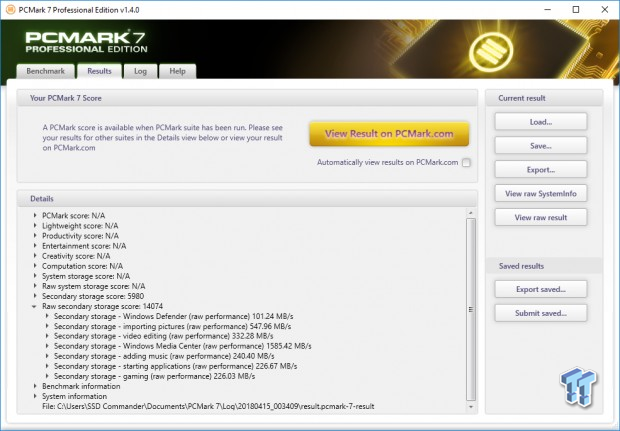
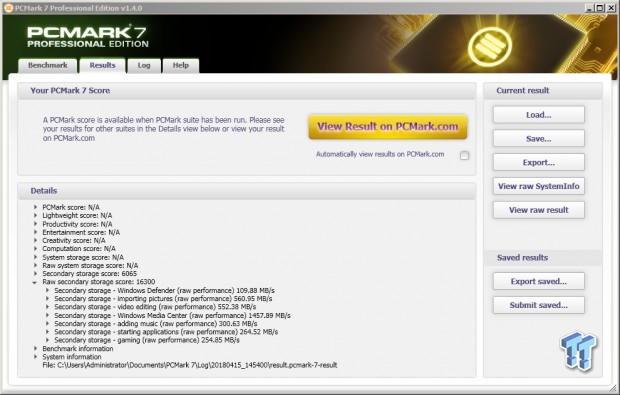
PCMark 7 - System Storage
Version and / or Patch Used: 1.4.0
We will look to Raw System Storage scoring for evaluation because it's done without system stops and, therefore, allows us to see significant scoring differences between drives. When evaluating NVMe SSDs we are looking for a minimum score of 11,000
OS Volume 75% Full - Lightly Used
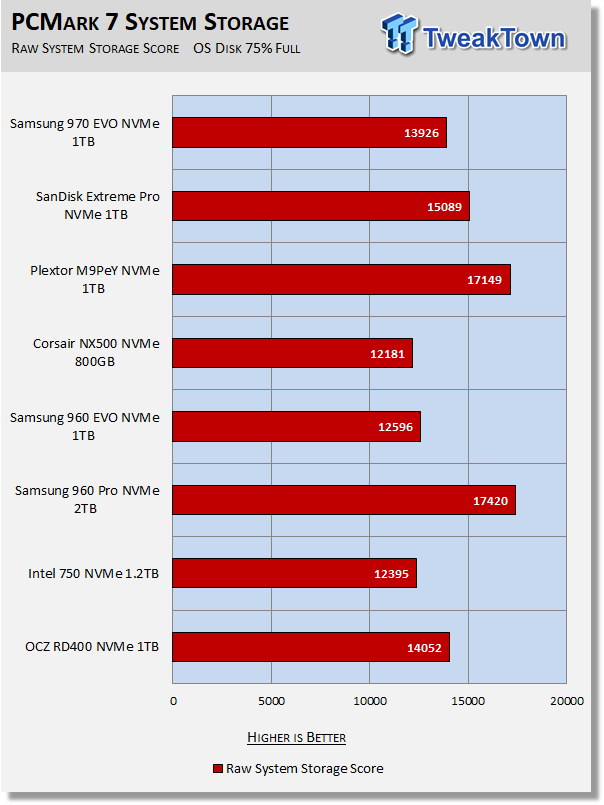
The 970 EVO delivers a far better score than the 960 EVO, but it's nothing to write home about. For reasons unknown, the EVO Series has always had a tough time with this test. The 960 Pro remains our lab champion.
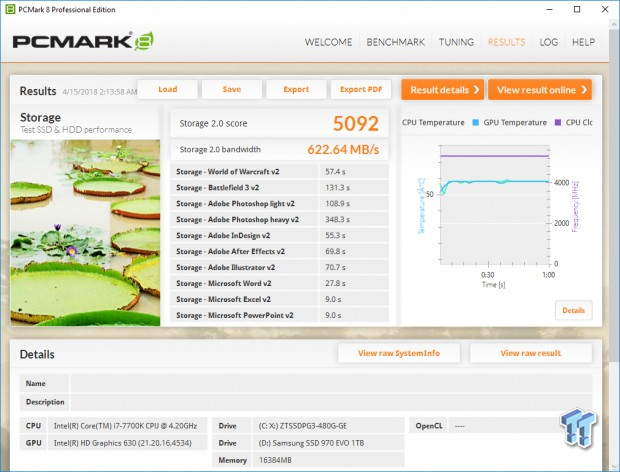
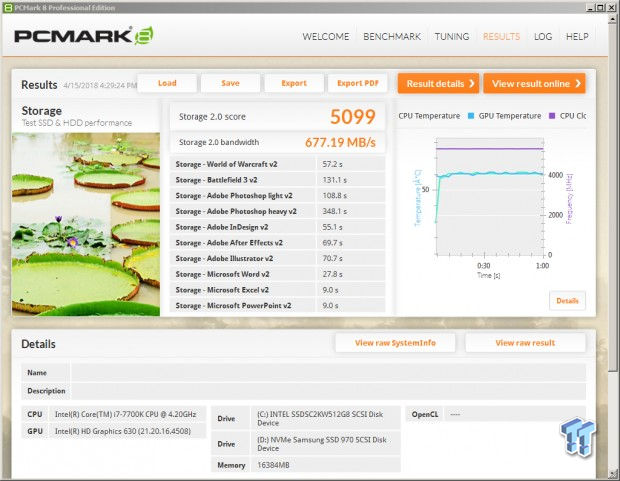
PCMark 8 - Storage Bandwidth
Version and / or Patch Used: 2.4.304
We use PCMark 8 Storage benchmark to test the performance of SSDs, HDDs, and hybrid drives with traces recorded from Adobe Creative Suite, Microsoft Office, and a selection of popular games. You can test the system drive or any other recognized storage device, including local external drives. Unlike synthetic storage tests, the PCMark 8 Storage benchmark highlights real-world performance differences between storage devices.
OS Volume 75% Full - Lightly Used
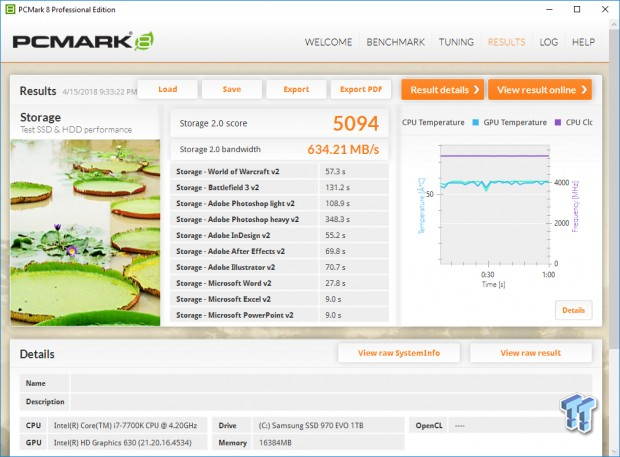
PCMark 8 is the most intensive moderate workload simulation we run. With respect to moderate consumer type workloads, this test is what we consider the best indicator of a drive's performance.
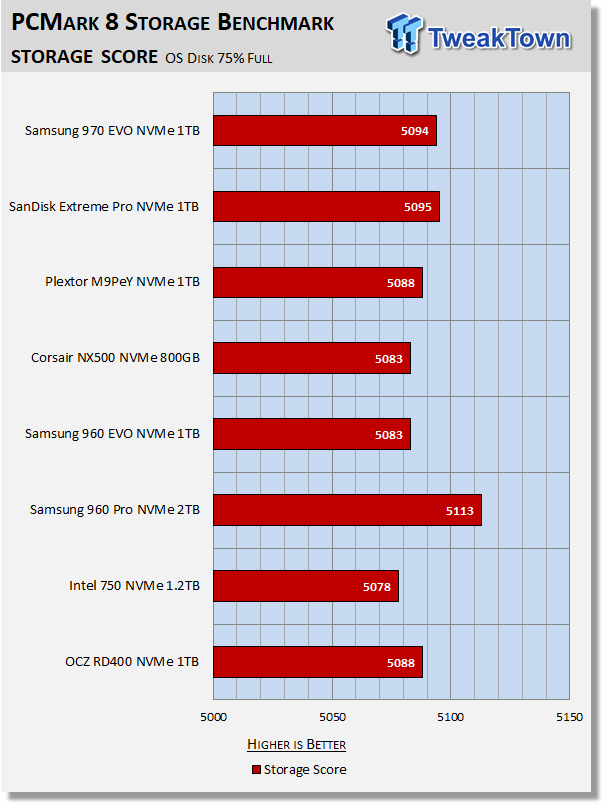
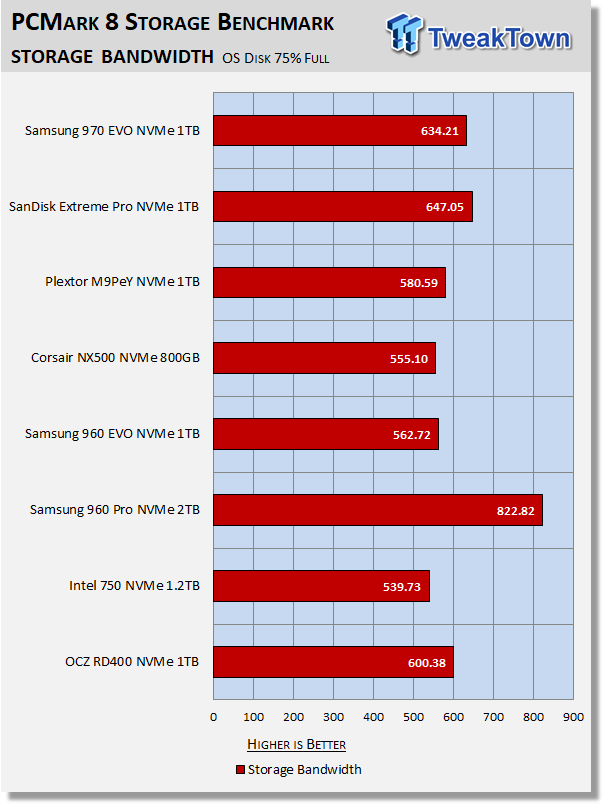
We again see a nice performance increase over the 960 EVO. However, the Sandisk Extreme Pro just edges it out to retain the PCMark 8 TLC performance crown.
BAPCo SYSmark 2014 SE Application Performance
Version and / or Patch Used: 2.0.0.70
SYSmark 2014 SE is considered the gold standard for testing system performance because it is an application-based benchmark. This test gives us the ultimate in real-world results because it utilizes actual applications running on the system, instead of playing back recorded traces. If you want to know what kind of impact a particular SSD will have on your system's overall performance; this test will show you.
Our systems are much more powerful than the calibration system (1000-point baseline) used by BAPCo, so we ran an OCZ TL100 120GB SATA III SSD to establish a comparison point relative to our test systems. We will be running this test going forward and we will add drives to our chart as we test them.
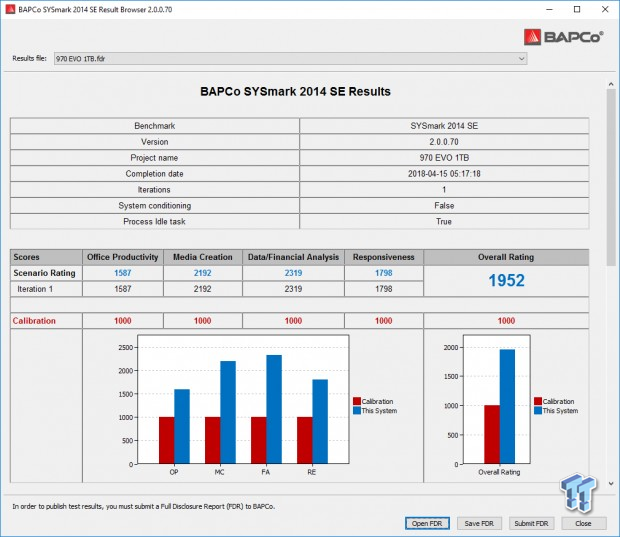
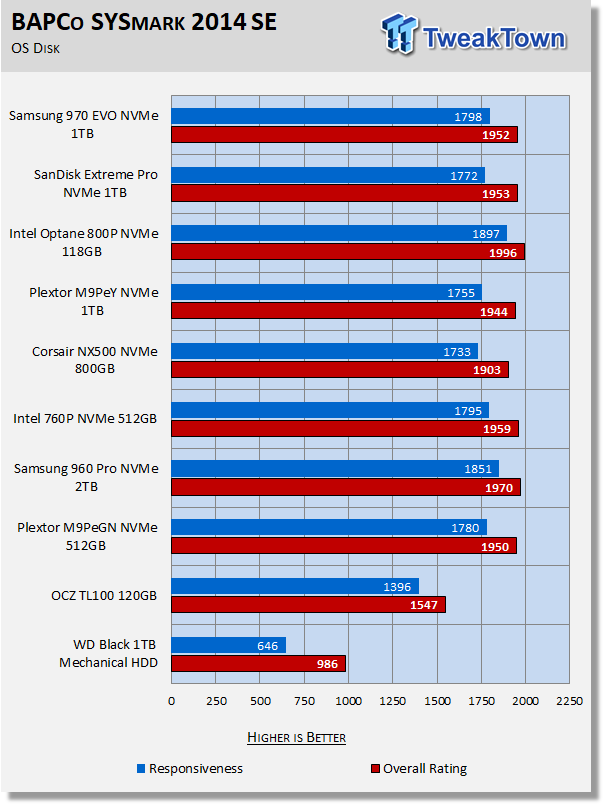
This lineup is a bit different than the others we've used for our test pool to this point. This is because these are the only SSDs we've run on our new Z270 storage testing platform. With all other benchmarks, there is very little difference between our Z170 and Z270 platforms. However, with SYSMark there is a marked difference due to increased CPU performance.
Responsiveness is our main focus when evaluating the results of this test. As we see it, this is a big win for the 970 EVO. It is showing itself to be the most responsive TLC SSD that we've tested to date while running actual consumer workloads. Keep in mind that a few points are a big deal with this testing.
Benchmarks (Secondary) - IOPS, Response & Transfer Rate
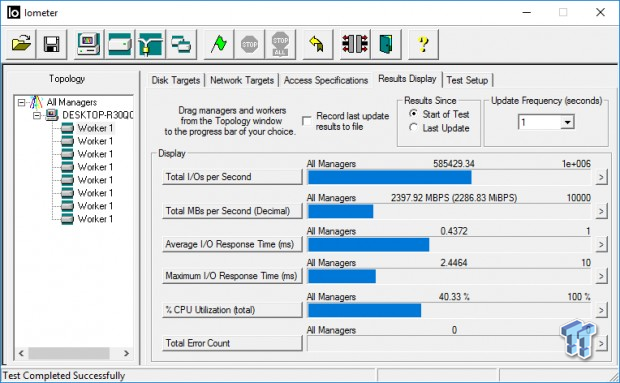
Iometer - Maximum IOPS
Version and / or Patch Used: Iometer 2014
We use Iometer to measure high queue depth performance. (No Partition)
Max IOPS Read
Max IOPS Write
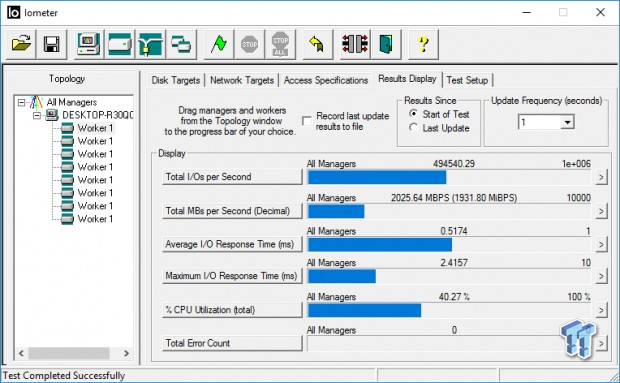
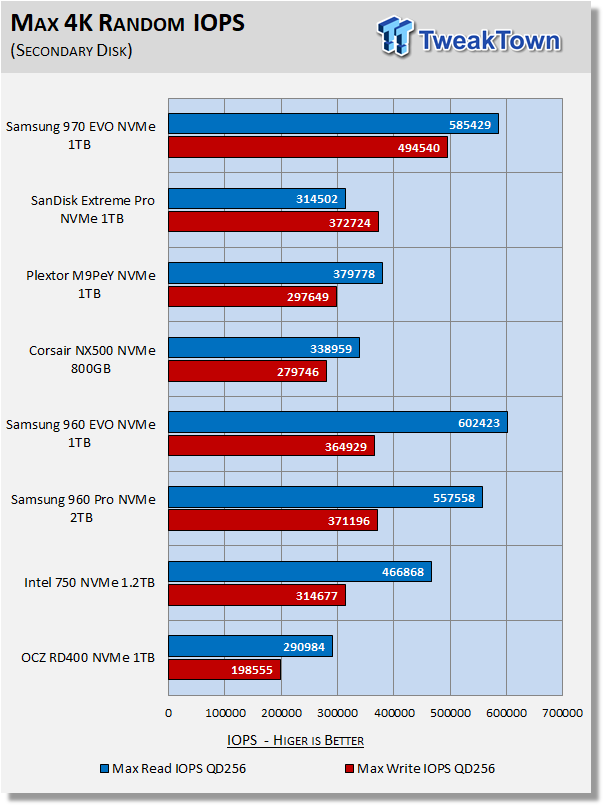
We test NVMe SSDs using eight threads at QD32 (QD256). We do this because we want to see what the drive can generate at its maximum attainable queue depth.
Another lab record goes to the 970 EVO. This time for the highest write IOPS from any flash-based consumer SSD we've tested.
Iometer - Disk Response
Version and / or Patch Used: Iometer 2014
We use Iometer to measure disk response times. Disk response times are measured at an industry accepted standard of 4K QD1 for both write and read. Each test runs twice for 30 seconds consecutively, with a 5-second ramp-up before each test. We partition the drive/array as a secondary device for this testing.
Avg. Write Response
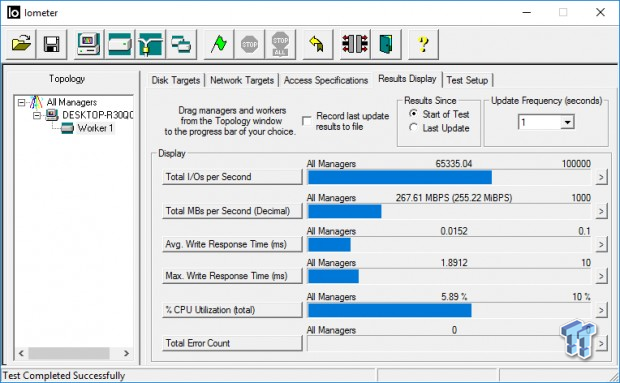
Avg. Read Response
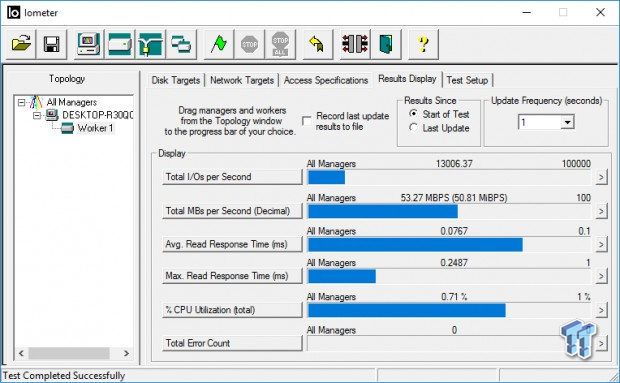
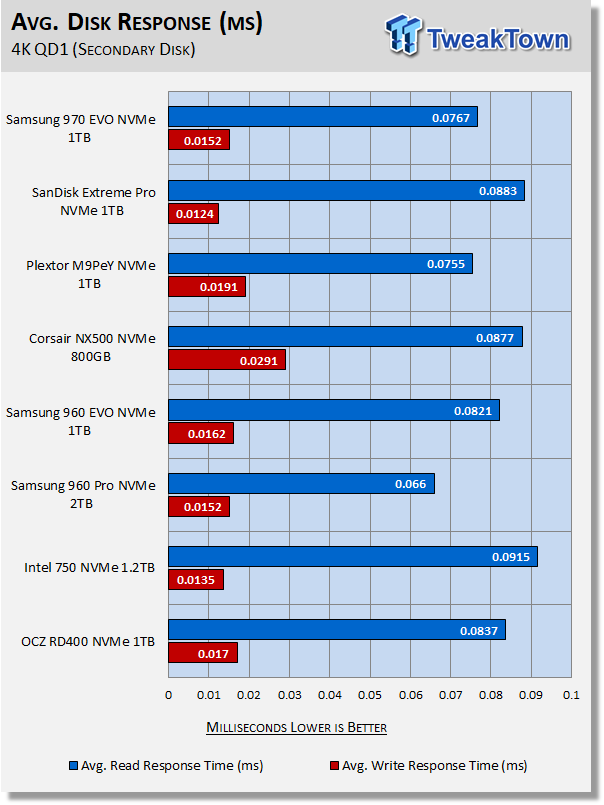
The 970 EVO displays significantly better-read response than its main competitor the Sandisk Extreme Pro/WD_BLACK. The Sandisk Extreme Pro does deliver by far the best write response we've seen from any SSD including Optane, but read response is more important. Plextor's M9Pe delivers the best-read response we've seen from any TLC SSD and remains lab champion in that category.
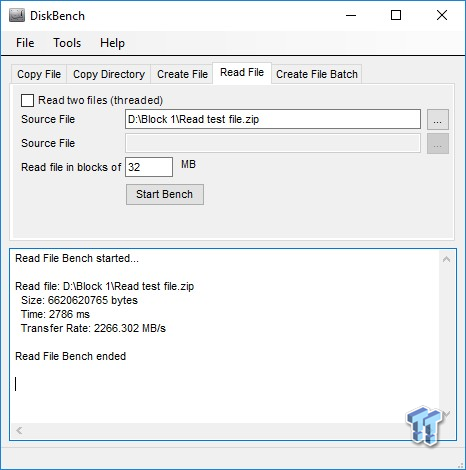
DiskBench - Transfer Rate
Version and / or Patch Used: 2.6.2.0
We use DiskBench to time a 28.6GB block (9,882 files in 1,247 folders) composed primarily of incompressible sequential and random data as it's transferred from our Toshiba RD400 1TB NVME SSD to our test drive. We then read from a 6GB zip file that's part of our 28.6GB data block to determine the test drive's read transfer rate. Our system is restarted prior to the read test to clear any cached data, ensuring an accurate test result. We consider write transfers to be more important than read transfers.
Write Transfer Rate
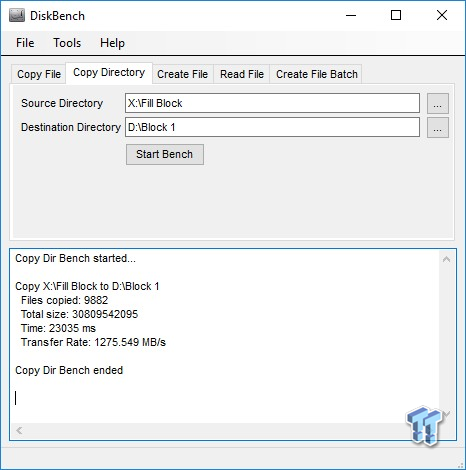
Read Transfer Rate
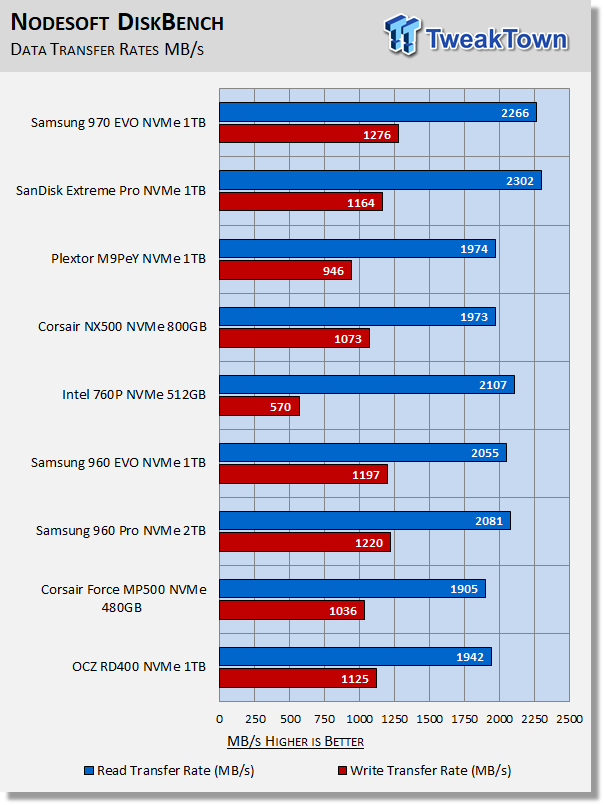
We recently upgraded our test system to Windows 10 build 14393. With that upgrade, write transfer rates almost doubled. The reason for this, as far as we know, is that CPU power switching modes have been relaxed on the latest version of Windows 10. We included the NVMe drives we've tested to date on this build of Windows 10. If you needed a good reason to upgrade to a newer version of Windows 10; this is a good reason.
Another lab record falls to the 1TB 970 EVO. Samsung's 970 EVO delivers the highest write transfer rate for any consumer SSD we've ever tested, including the mighty MLC powered Samsung 960 Pro 2TB.
Benchmarks (Secondary Volume) - PCMark 8 Extended
Futuremark PCMark 8 Extended
Heavy Workload Model
PCMark 8's consistency test simulates an extended duration heavy workload environment. PCMark 8 has built-in, command line executed storage testing. The PCMark 8 Consistency test measures the performance consistency and the degradation tendency of a storage system.
The Storage test workloads are repeated. Between each repetition, the storage system is bombarded with a usage that causes degraded drive performance. In the first part of the test, the cycle continues until a steady degraded level of performance has been reached. (Steady State)
In the second part, the recovery of the system is tested by allowing the system to idle and measuring the performance after 5-minute long intervals. (Internal drive maintenance: Garbage Collection (GC)) The test reports the performance level at the start, the degraded steady-state, and the recovered state, as well as the number of iterations required to reach the degraded state and the recovered state.
We feel Futuremark's Consistency Test is the best test ever devised to show the true performance of solid state storage in an extended duration heavy workload environment. This test takes on average 13 to 17 hours to complete and writes somewhere between 450GB and 14,000GB of test data depending on the drive. If you want to know what an SSDs steady state performance is going to look like during a heavy workload, this test will show you.
Here's a breakdown of Futuremark's Consistency Test:
Precondition phase:
1. Write to the drive sequentially through up to the reported capacity with random data.
2. Write the drive through a second time (to take care of overprovisioning).
Degradation phase:
1. Run writes of random size between 8*512 and 2048*512 bytes on random offsets for 10 minutes.
2. Run performance test (one pass only).
3. Repeat 1 and 2 for 8 times, and on each pass increase the duration of random writes by 5 minutes.
Steady state phase:
1. Run writes of random size between 8*512 and 2048*512 bytes on random offsets for 50 minutes.
2. Run performance test (one pass only).
3. Repeat 1 and 2 for 5 times.
Recovery phase:
1. Idle for 5 minutes.
2. Run performance test (one pass only).
3. Repeat 1 and 2 for 5 times.
Storage Score, Storage Bandwidth
PCMark 8's Consistency test provides a ton of data output that we use to judge a drive's performance.
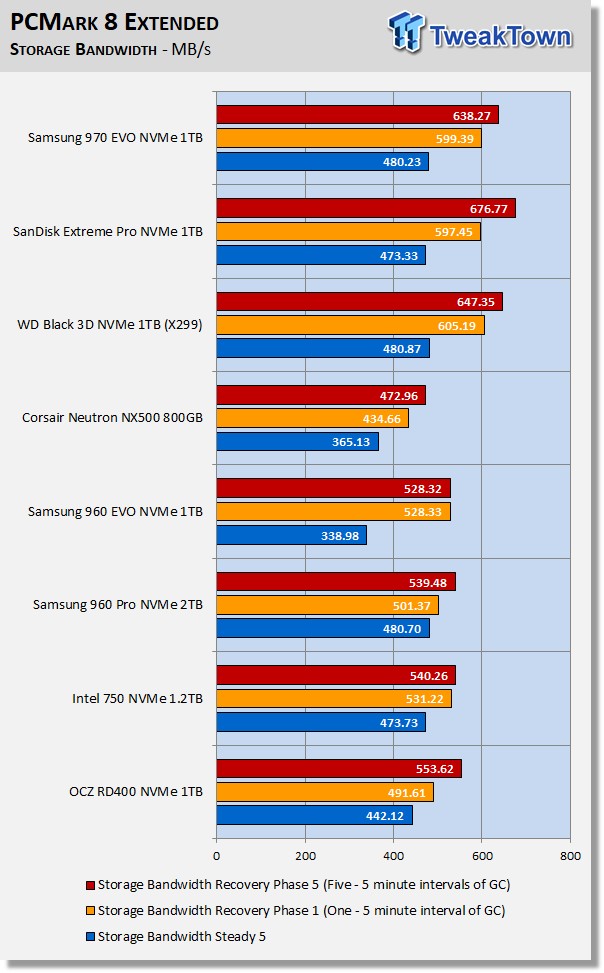
We consider steady-state bandwidth (the blue bar) our test that carries the most weight in ranking a drive/arrays heavy workload performance. Performance after Garbage Collection (GC) (the orange and red bars) carries the most weight when evaluating moderate consumer workload performance.
This lineup is a bit different because we didn't test some of the drives that appear on our other charts with this test. With Samsung's new "Phoenix" controller in play, we wanted to see how it - paired with a 64-layer V-NAND TLC flash array would handle this test.
The first thing we notice is a massive improvement in steady-state performance. The 960 EVO had mediocre steady-state performance, but the 970 EVO chews through as good as any flash-based consumer SSD we've tested to date.
The 970 EVO and WD offerings deliver similar performance before recovery. The WD offerings recover a bit better, but we will need to dig a bit deeper into the charts below to render a decision as to which is better overall.
Storage Bandwidth Per Phase
We chart our test subject's storage bandwidth as reported at each of the test's 18 trace iterations. This gives us a good visual perspective of how our test subjects perform as testing progresses. This chart sheds more light on how the drives perform as they progress through the testing phases.
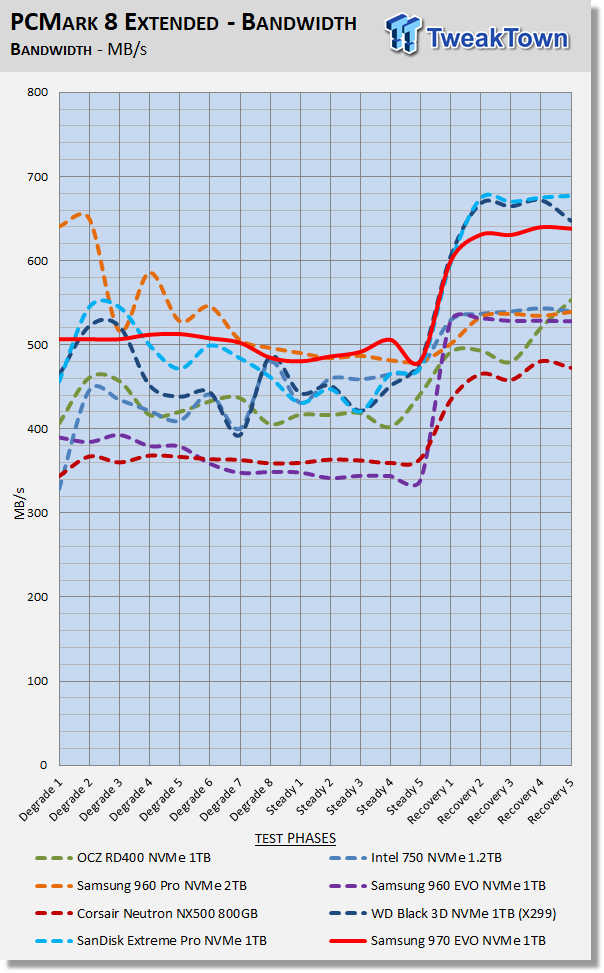
When we look at all the phases on this graph it is clear that the 970 EVO is performing far better than the WD offerings during heavy workloads. We are looking for as flat of line at a high rate as possible and in this regard, the 970 EVO delivers the goods as good or better than any flash-based SSD we've tested to date.
Total Access Time (Latency)
We chart the total time the disk is accessed as reported at each of the test's 18 trace iterations. This helps shed some light on how the drive performs at each of the 18 phases of this test.
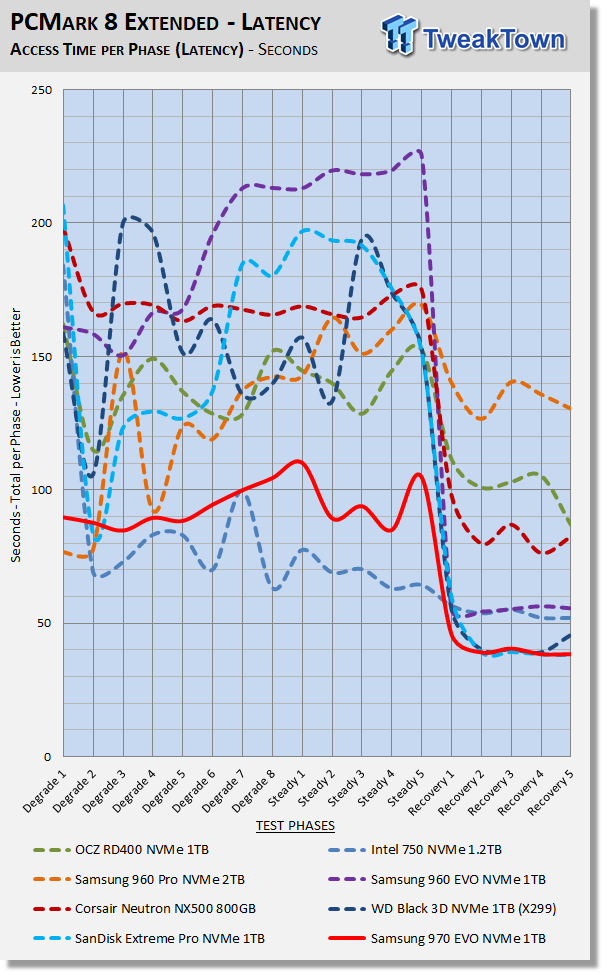
Latency is much more important than bandwidth, and this is where we really see a huge advantage over the WD offerings. Overall, the 970 EVO delivers consistently lower latency when in a degrade/steady-state than the rest of the drive's in our test pool, with the exception of Intel's 750. Certainly, far and away the best we've seen from any consumer TLC SSD.
Disk Busy Time
Disk Busy Time is how long the disk is busy working. We chart the total time the disk is working as reported at each of the tests 18 trace iterations.
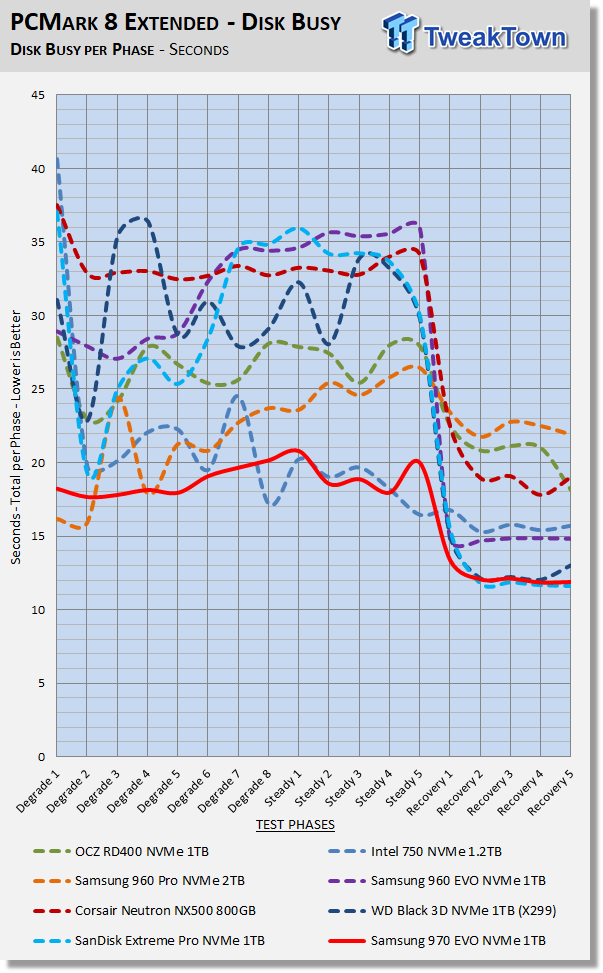
The 970 EVO works less and gives more than any of the competitors in our test pool. Now that is impressive.
Data Written
We measure the total amount of random data that our test drive/array is capable of writing during the degradation phases of the consistency test. Pre-conditioning data is not included in the total. The total combined time that degradation data is written to the drive/array is 470 minutes. This can be very telling. The better a drive/array can process a continuous stream of random data; the more data will be written.
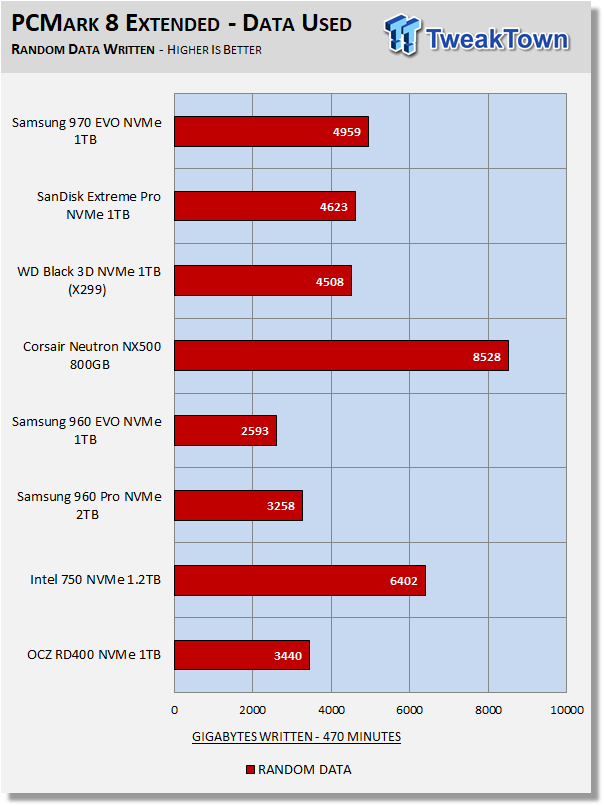
The 970 EVO works less and still writes more data than the WD offerings. Notice the massive improvement over the 960 Series. The NX500 and the Intel 750 have a large amount of overprovisioning which is why they both write more data than the 970 EVO.
Benchmarks 70/30 Mixed Workload & Sustained Seq. Write
70/30 Mixed Workload Test (Sledgehammer)
Version and / or Patch Used: Iometer 2014
Heavy Workload Model
This test hammers a drive so hard we've dubbed it "Sledgehammer". Our 70/30 Mixed Workload test is designed to simulate a heavy-duty enthusiast/workstation steady-state environment. We feel that a mix of 70% read/30% write, full random 4K transfers best represents this type of user environment. Our test allows us to see the drive enter into and reach a steady state as the test progresses.
Phase one of the test preconditions the drive for 1 hour with 128K sequential writes at QD32. Phase two of the test runs a 70% read/30% write at QD32, full random 4K transfer workload on the drive for 1 hour. We log and chart (phase two) IOPS data at 5-second intervals for 1 hour (720 data points). 60 data points = 5 minutes.
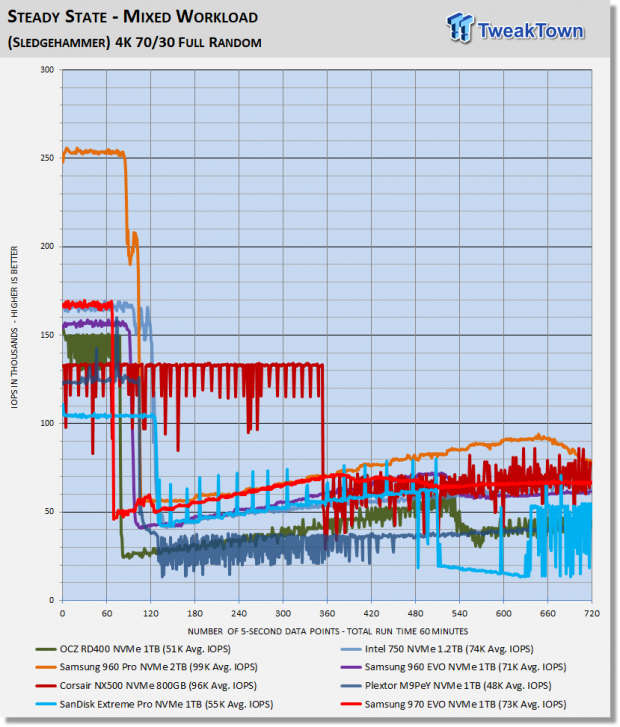
What we like about this test is that it reflects reality. Everything lines up, as it should. Consumer drives don't outperform Enterprise-Class SSDs that were designed for enterprise workloads. Consumer drives based on old technology are not outperforming modern Performance-Class SSDs, etc.
Here again, the 970 EVO proves itself to be the best performing TLC SSD when running heavy workloads. Almost 50% better than its main competitor from Western Digital. And, the 970 EVO is giving us what we want to see - tight, consistent and predictable performance. The EVO Series are the only consumer TLC SSDs that deliver tight consistency when running this test.
Sustained Sequential Write
Version and / or Patch Used: Iometer 2014
Heavy Workload Model
We write to the drive for 1 hour with 128K sequential writes at QD32. We log and chart megabytes per second data at 5-second intervals for 1 hour (720 data points). 60 data points = 5 minutes.
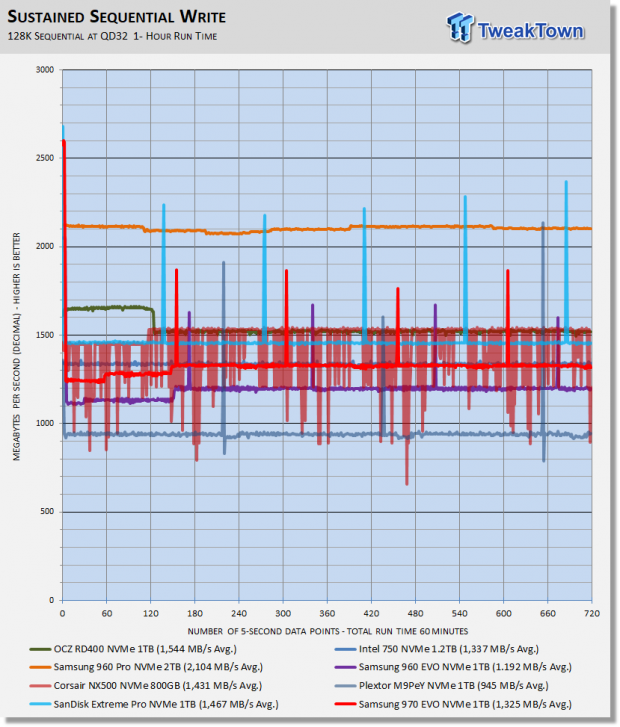
1,325 MB/s sustained sequential write is really good for a TLC SSD. It's better than Samsung's factory spec of 1,200 MB/s after TurboWrite. The write-centric Sandisk Extreme Pro does a bit better and thus retains the sustained sequential write crown for consumer TLC SSDs.
Maxed-Out Performance (MOP)
This testing is just to see what the drive is capable of in an FOB (Fresh Out of Box) state under optimal conditions. We are utilizing empty volumes running on Windows 10 64-bit and Windows Server 2008 R2 64-bit for this testing.
Windows 10 MOP
Samsung 970 EVO 1TB M.2 PCIe NVMe SSD


Windows Server 2008 R2 MOP
Samsung 970 EVO 1TB M.2 PCIe NVMe SSD
Final Thoughts
To this point, with every iteration of the EVO series, Samsung has been able to maintain a clear performance advantage over the competition. However, this time it's not so clear-cut as we are accustomed to seeing. As we see it, Western Digital's newest NVMe offerings are a serious threat to Samsung's performance domination on the TLC front.
The reason why Samsung always held a clear performance advantage over their competitors was due in main part to Samsung's superior V-NAND flash. Samsung's TLC flash is possibly still the best, but we aren't so sure about that anymore. Toshiba and Intel/Micron's 64-layer TLC flash is really good. So good that Samsung's clear lead has almost, if not completely evaporated.
Last month Western Digital actually snatched the TLC performance crown from Samsung with their second generation WD_BLACK and Extreme Pro. In-fact it may go back even further than that because it could be argued that Plextor did it with their M9Pe series powered by 64-layer BiCS 3 TLC flash. Then there is SMI coming on strong with their SM2262 controller paired with IMFT 64-layer TLC flash.
This is actually what we have wanted to see for a long time. True competition that will turn into a battle for the lowest price. Samsung is aware of this as evidenced by their lower than normal MSRP pricing for the 970 EVO. It is priced identically to WD's newest offerings at each similar capacity point, and that's not something we've seen before.
So, is Samsung's 970 EVO the best performing TLC SSD on the market? In our opinion, the answer is yes. Here's why. First off, the 1TB 970 EVO set many lab records which cannot be ignored. The 970 EVO and Western Digital's latest and greatest perform very close to one another when running moderate workloads, and synthetic benchmarks. So, we need to analyze heavy consumer workloads for our answer.
When we analyze heavy consumer/workstation type workloads, the 970 EVO is clearly superior to any other consumer-based TLC on the market. It delivered almost 50% better performance than the WD offerings when running our 70/30 workload testing. That is huge. It delivers superior performance to all other consumer TLC SSDs when running in a steady-state. Additionally, it is the most responsive TLC SSD we've tested to date per SYSmark 2014 SE.
These reasons are why we are handing back the consumer TLC performance crown to Samsung. However, like we stated previously, Samsung's clear TLC performance lead over the competition is gone. We had to break it down further than ever before to feel comfortable in stating that the 970 EVO is the best performing TLC-based SSD available at this time. But who knows, that could change with a simple firmware update from WD or SMI.
Because TweakTown tests SSDs with the drive running as our system (OS) disk, we are in a relatively unique position to comment on what matters most - actual user experience. The user experience delivered via the 970 EVO is outstanding. Everything about the way your system performs when running a 970 EVO as your system disk is Tier-1. This is why Samsung's 1TB 970 EVO is TweakTown recommended.
Pros:
- Overall Performance
- High Endurance
- Value
- Included Software
Cons:
- None
 Phison E37T SSD Controller Exclusive Preview - The Fastest DRAMless SSD Platform Yet
 Seagate FireCuda X1070 4TB SSD Review - A New Mainstream Contender
 ASUSTOR Lockerstor 2 Gen2+ AS6702T v2 NAS Review - Fast Performance
 TERRAMASTER D1 SSD Pro Thunderbolt/USB Portable Enclosure Review - Incredible Potential
 Orico K20 Mini 2TB Magnetic Portable SSD Review - Ultra-Thin MagSafe Drive
 The Legend of Zelda: Ocarina of Time fan remake for PC no longer in development
 Epic Games Store is being rebuilt to deliver up to 6.5X faster performance
 Anthropic says blocking China from Claude cost it hundreds of millions
 Microsoft adds 'Xbox Handheld' as new platform for Xbox, joining consoles and PC
 Diablo IV and Lord of Hatred DLC soft confirmed for the Nintendo Switch 2
 NVIDIA's AI agents taught robots to install GPUs into motherboards without any human help
 Another AMD AM5 CPU has reportedly swelled and died, this time a Ryzen 9 9900X less than a year old
 Valve just told Half-Life 3 dataminers it knows exactly what they are doing with new Dota 2 variable name
 Destiny 2 situation not result of Sony revenge plot, decisions are entirely financial
 PCCooler CPS RZ820 Display Review: a flagship-level CPU air cooler with an LCD screen
 Speed Racer (2008) 4K Ultra HD Blu-ray Review: a stunning remaster of the cult classic
 MOAIPLAY ORA PRO G1 850W ATX 3.1 PSU Review: high efficiency and 10-year warranty for $119.99
 Navman MiVue Smart True 4K Surround Dashcam Review - Seeing In All Directions At Once
 IQUNIX Magi96 Pro Aluminum Low Profile Mechanical Keyboard Review - Premium Build, Satisfying Sound
 Asetek Forte S-Series Racing Simulator Bundle Review
 Razer Pro Type Ergo Wireless Split Ergonomic Keyboard Review - Built for Comfort and Support
 ASUS ROG Strix Morph 96 Wireless Gaming Keyboard Review - Great Performance, More Affordable
 SAPPHIRE Radeon RX 9070 GRE PULSE OC Review - A New 1440p Challenger Has Arrived
 I stopped Windows 11 notifications from interrupting me with Do Not Disturb, Focus, and a priority list
 I read the Windows Backup app screen carefully, and it does not back up what most people think
 Low Sound Volume on Windows 11? How to fix audio issues and restore normal volume
 8 Critical Warning Signs You Should Never Ignore in Windows 11
 This Windows security feature protects Documents from ransomware, but it is off by default
 Windows 11 already has a voice typing tool, and it is the one most people are not using
 Quick Assist is the only remote-support tool I open when a relative calls about their PC
 The PowerToys utilities I keep enabled on every Windows 11 PC, and the ones I turned off within a week
 TweakTown's Best of Computex 2026 Awards - The Best Hardware, Gaming Gear, and AI