The Bottom Line
Introduction, Drive Specifications, Pricing and Availability
The day is coming sooner rather than later when all but long-term cold storage will be solid-state. Soon every PC will ship with an SSD onboard. Today, Samsung hits a new milestone by delivering the first ever 2TB consumer SSD's. This high capacity is facilitated by Samsung's groundbreaking 3D V-NAND Technology. Exotic SATA-based SSD's with a capacity of this magnitude have, until now, been extremely poor performers and very cost prohibitive. Today Samsung is changing everything.
Last year at Flash Memory Summit, we heard rumor of a 2TB Samsung SSD in the works. We also heard that a SATA SSD with this high of a capacity requires a re-engineered controller because just slapping a bunch of flash on current controllers would result in performance that Samsung considers sub-par. Samsung's engineering department has been hard at work developing a controller capable of powering a full two terabytes of flash at SATA speeds comparable to or greater than their current flagship SATA-based SSD's.
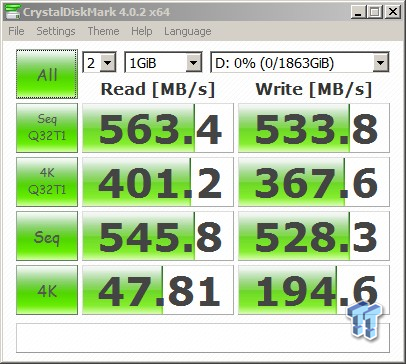
Samsung's newest controller is designated MHX. The MHX is capable of delivering the same best-in-class sequential read/write performance as the 850 EVO/Pro 1TB SSD, but with 2TB of flash, while at the same time improving on random performance. Our testing shows a huge improvement in random 4K QD1 read/write performance on the 2TB 850 PRO. At capacity points of 1TB and under, the 850 EVO delivers markedly superior 4K QD1 random read/write performance to that of the 850 PRO. Samsung's MHX controller changes that, with the introduction of the 2TB 850 PRO. The 2TB 850 PRO now delivers the same insane QD1 4K random performance as the 850 EVO. We are able to hit 4K QD1 random read/write speeds of 45/195 MB/s with the 2TB 850 PRO running under optimal conditions. This is a massive improvement.
Samsung's 850 Series SSD's are about more than just class-leading performance and unrivaled capacity. Equipped with Samsung's cutting-edge 3D V-NAND, the 850 Series SSD's are all about endurance; even 3-bit per cell Samsung 3D V-NAND has twice the endurance of conventional 2D planar type flash. Backing up this claim is Samsung's industry-leading TBW (Total Bytes Written) warranty for both the 850 EVO and PRO. 3D flash inherently delivers superior endurance because with 3D flash, density increases aren't coming via lithography shrinkage. With 3D flash increased density is facilitated by going vertical using larger lithography flash which inherently is capable of enduring far more P/E (Program/Erase) cycles than smaller nodes. 3D flash is also more power efficient than planar type flash, which is a great benefit for today's mobile computing devices.
Samsung is in a unique position, because they manufacture all of the components utilized on their SSD's. This allows Samsung to offer lower cost and higher quality products than the majority of their competition. In addition, there is no wait time for implementation of new technologies developed in-house which means that Samsung SSD's are perpetually on the cutting-edge of new technology.
There you have our brief run-down of Samsung's latest and greatest, now let's take a close look at the performance of both of these SATA III Behemoth's.
Specifications Samsung 850 EVO and PRO 2TB SSD

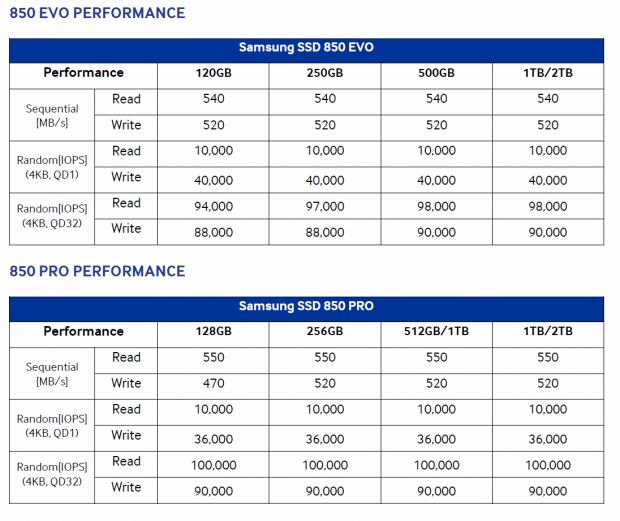
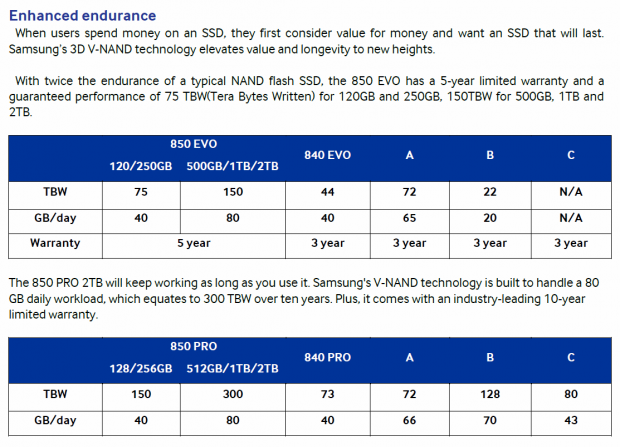
Samsung's 850 EVO SATA III 2.5" FF SSD is available in 5 capacities: 120GB, 250GB, 500GB, 1TB, and 2TB. Sequential read performance for the 850 EVO is listed as up to 540MB/s. Sequential write performance is listed as up to 520 MB/s. Sequential write performance varies by capacity outside of the drives TurboWrite layer.
The 850 EVO delivers up to 98,000 random read IOPS and 90,000 random write IOPS at QD32. QD1 random performance is rated at up to 10,000/40,000 IOPS. LBA addressing is handled by a single LPDDR Samsung DRAM package that varies in density by capacity. The two smaller capacities are warranted for up to 75 terabytes TBW (Total Bytes Written) and the 500GB -2TB drives for 150 terabytes TBW, or five years, whichever comes first.
Power consumption for the 2TB 850 EVO is listed at an average maximum of 3.7W read, 4.7W write. Idle power consumption is listed at 60mW max and Device Sleep power consumption is listed at 5mW. The 850 EVO is FDE (Full Disk Encryption) and Encrypted drive capable.
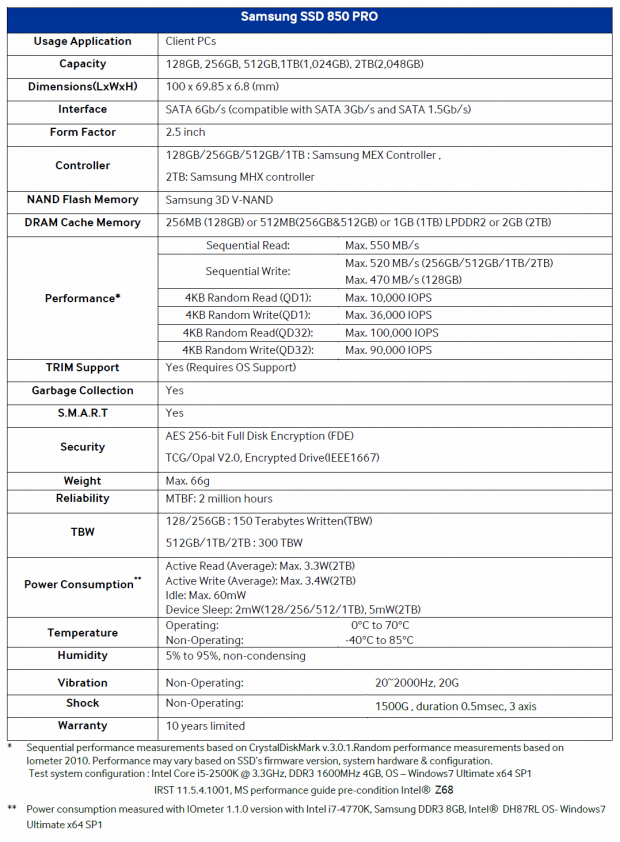
Samsung's 850 PRO SATA III 2.5" FF SSD is available in 5 capacities: 128GB, 256GB, 512GB, 1TB, and 2TB. Sequential read performance for the 850 PRO is listed as up to 550MB/s. Sequential write performance is listed as up to 520 MB/s. Sequential write performance of the 128GB model is up to 470 MB/s.
The 850 PRO delivers up to 100,000 random read IOPS and 90,000 random write IOPS at QD32. QD1 random performance is rated at up to 10,000/36,000 IOPS. LBA addressing is handled by a single LPDDR Samsung DRAM package that varies in density by capacity. The two smaller capacities are warranted for up to 150 terabytes TBW (Total Bytes Written) and the 500GB -2TB drives for 300 terabytes TBW, or 10 years, whichever comes first.
Power consumption for the 2TB 850 PRO is listed at an average maximum of 3.3W read, 3.4W write. Idle power consumption is listed at 60mW max and Device Sleep power consumption is listed at 5mW. The 850 PRO is FDE (Full Disk Encryption) and Encrypted drive capable.
Drive Details
Samsung 850 EVO and Pro 2TB SSD
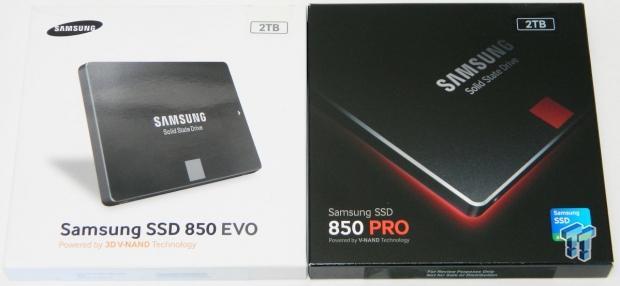
Both drives are packaged as we've come to expect from their respective lineage. The 850 EVO in a white themed box and the 850 PRO in a black themed box.
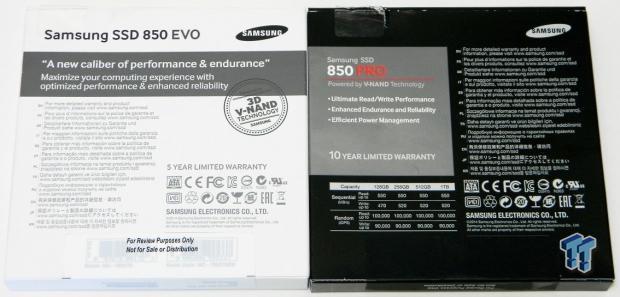
On the rear of the packaging, Samsung advertises the 850 EVO's 5-year limited warranty and the 850 PRO's 10-year limited warranty.
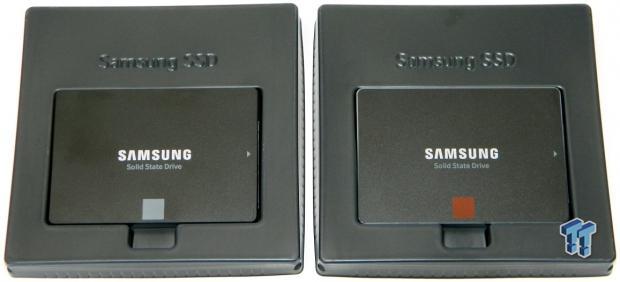
Inside the box, both drives are protected from damage by a black plastic tray.
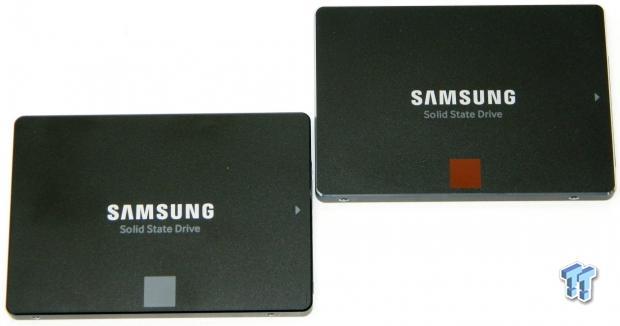
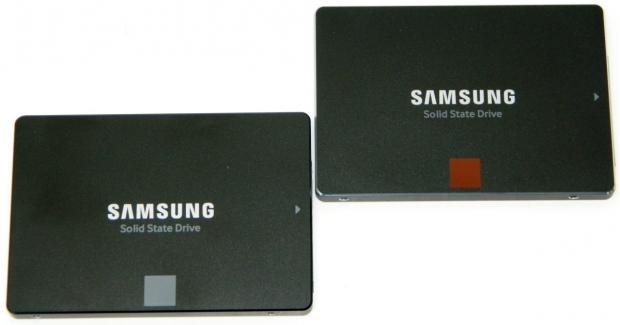
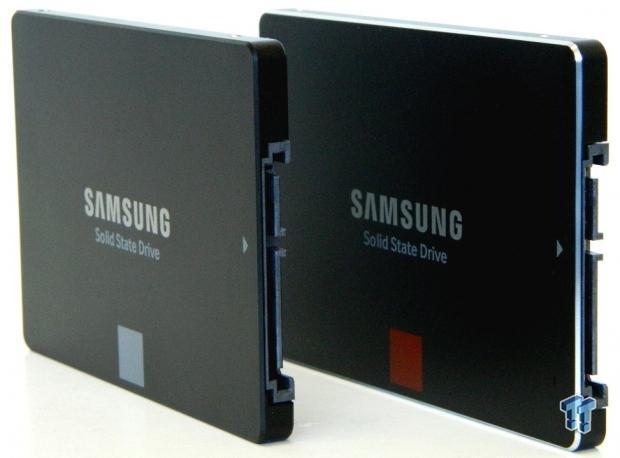
The front half of both drives have a "Samsung" label and a colored square that denotes the series they belong to. Grey for the EVO and dark Red for the PRO.
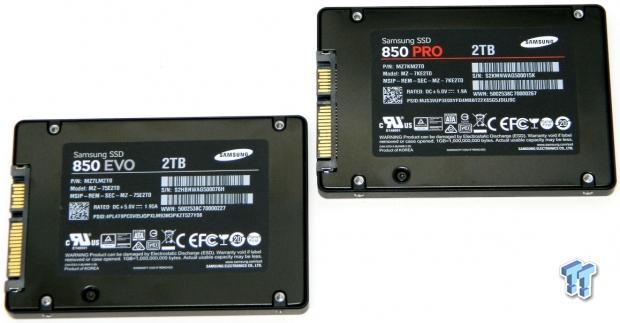
The back half of the drives have a manufacturer's label that lists all the specifics for each model.
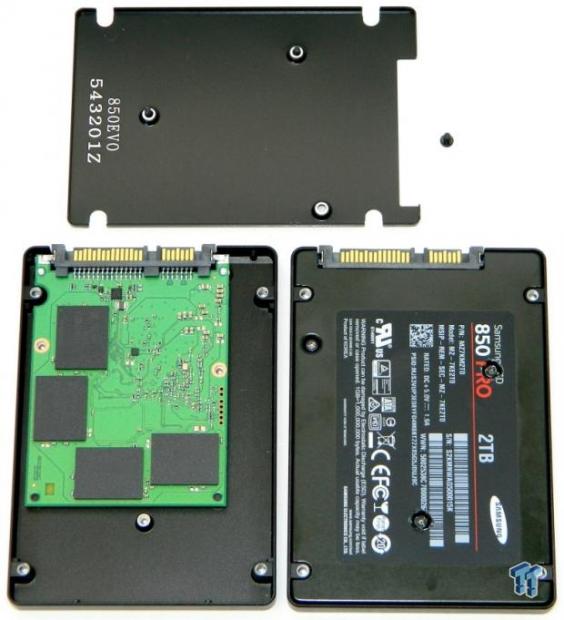
We ran into a problem trying to open the 850 PRO. We couldn't do it because the pentalobe screws stripped. We had no problem opening the EVO with the appropriate pentalobe driver. Sadly, we are only able to show you the internals of the EVO. We will assume they are very similar to one-another.
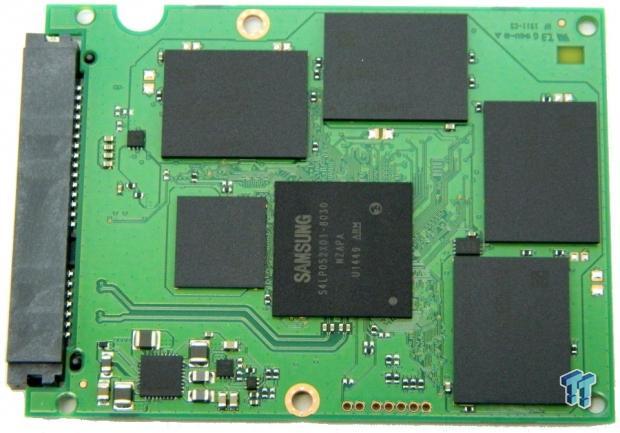
Located on this side of the EVO's internal PCB are located the drive's MHX controller, a single 2GB LPDDR package and four of the drives eight 256GB 3D flash packages.
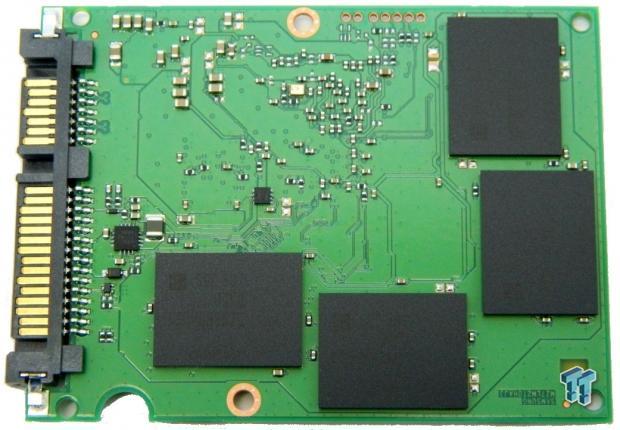
On the opposite side of the PCB are located the remaining four 256GB 3D flash packages.
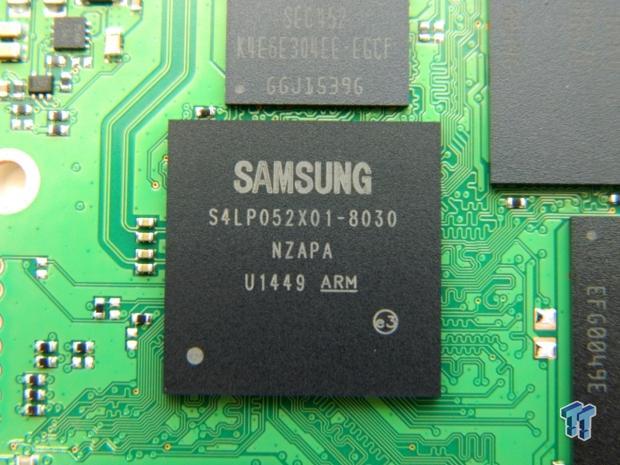
A close-in view of Samsung's ARM-based MHX controller.
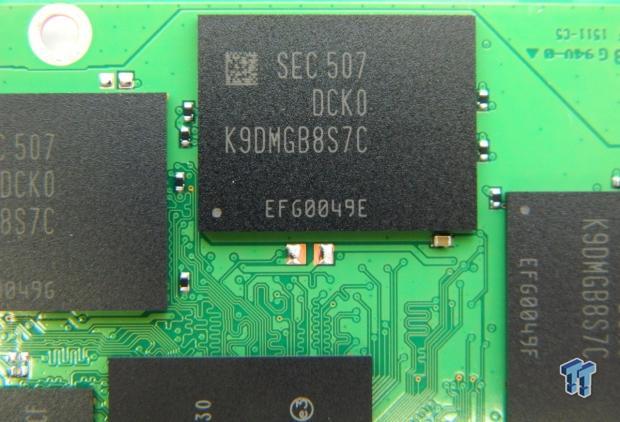
A close-in view of one of eight Samsung 3D V-NAND 256GB flash packages.
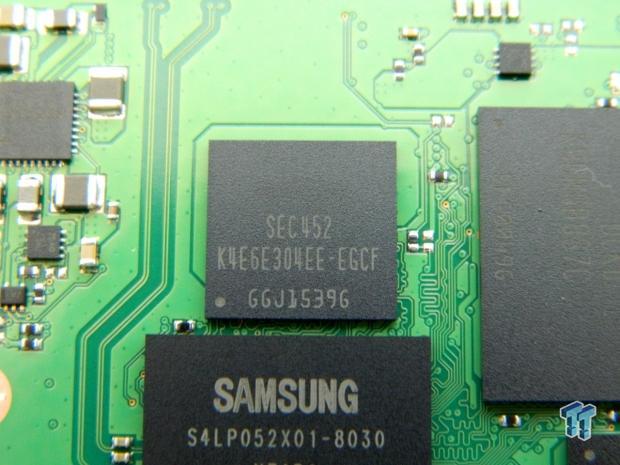
Finally, a close-in view of the drive's 2GB Samsung LPDDR DRAM package.
Test System Setup and Properties
Test System Configuration
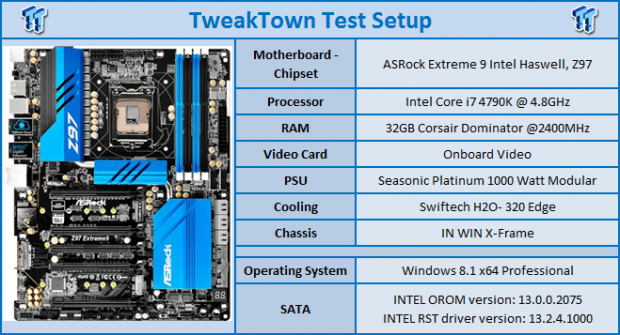
We would like to thank the following companies: ASRock, Crucial, Intel, Corsair, RamCity, IN WIN, and Seasonic for making our test system possible.
Drive Properties
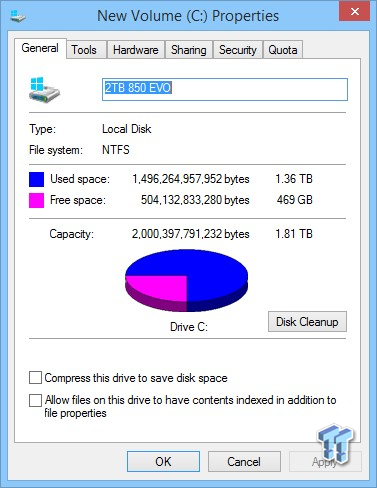
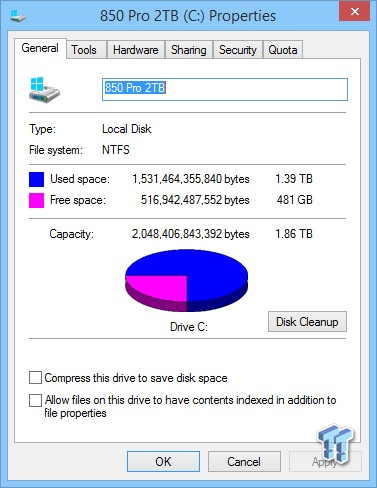
The majority of our testing is performed with our test drive as our boot volume. Our boot volume is 75% full for all OS Disk "C" drive testing to replicate a typical consumer OS volume implementation. We feel that most of you will be utilizing your SSD's for your boot volume and that presenting you with results from an OS volume is more relevant than presenting you with empty secondary volume results.
System settings: Cstates and Speed stepping are both disabled in our systems BIOS. Windows High Performance power plan is enabled. Windows write caching is enabled, and Windows buffer flushing is disabled. We are utilizing Windows 8.1 64-bit for all of our testing except for our MOP (Maxed-Out Performance) benchmarks where we switch to Windows Server 2008 R2 64 Bit.
Note: 850 EVO benchmarks on left, 850 PRO benchmarks on right throughout the review. Click on image to enlarge.
Synthetic Benchmarks - ATTO & Anvil Storage Utilities
ATTO
Version and / or Patch Used: 2.47
ATTO is a timeless benchmark used to provide manufacturers with data used for marketing storage products.
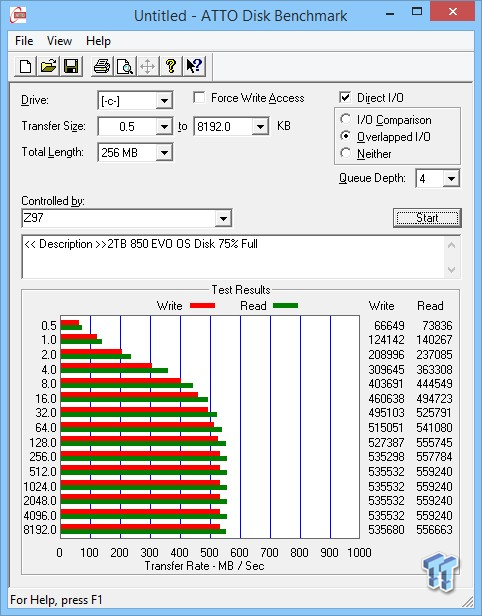
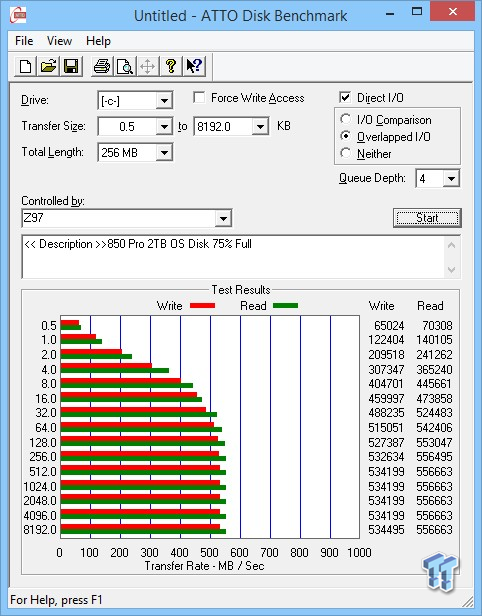
The 850 EVO's sequential read/write transfers max out at 546/523 MB/s, the 850 PRO 543/521 MB/s. Keep in mind these are both OS volumes 75% full, and we are properly converting KB to MB.
Sequential Write
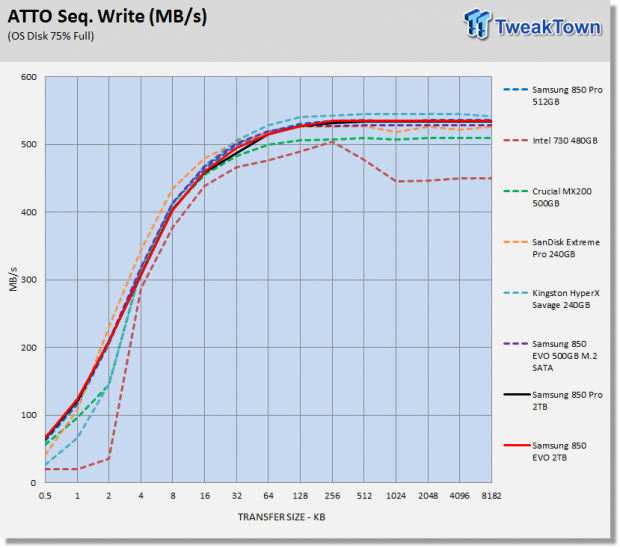
We are charting a 500GB 850 EVO and a 512GB 850 PRO throughout the review to compare against the 2TB version's that are the focus of today's review. The performance of the Samsung drives are very similar and because of that, graphing lines may be layered one over the other on some of our charts.
Sequential Read
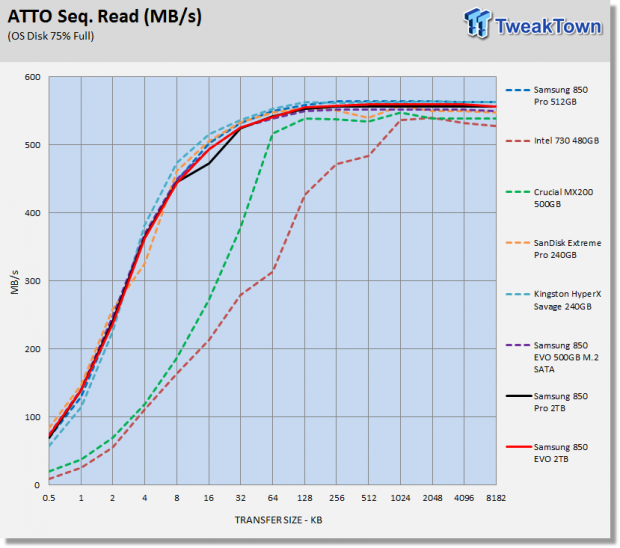
As we would expect to see, the Samsung drives all follow the same performance curve.
Anvil Storage Utilities
Version and / or Patch Used: 1.1.0
Anvil's Storage Utilities is a storage benchmark designed to measure the storage performance of SSD's. The Standard Storage Benchmark performs a series of tests; you can run a full test or just the read or write test, or you can run a single test, i.e. 4k QD16.
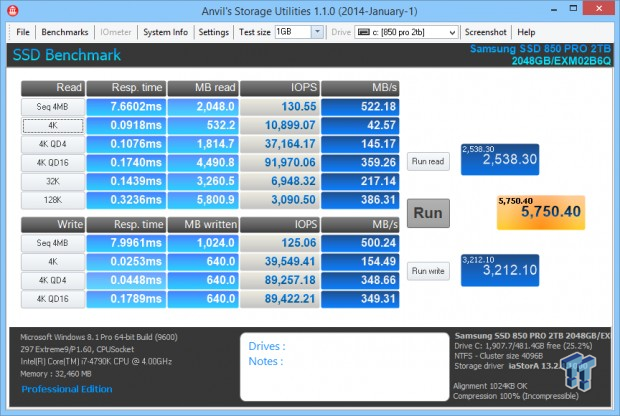
Scoring
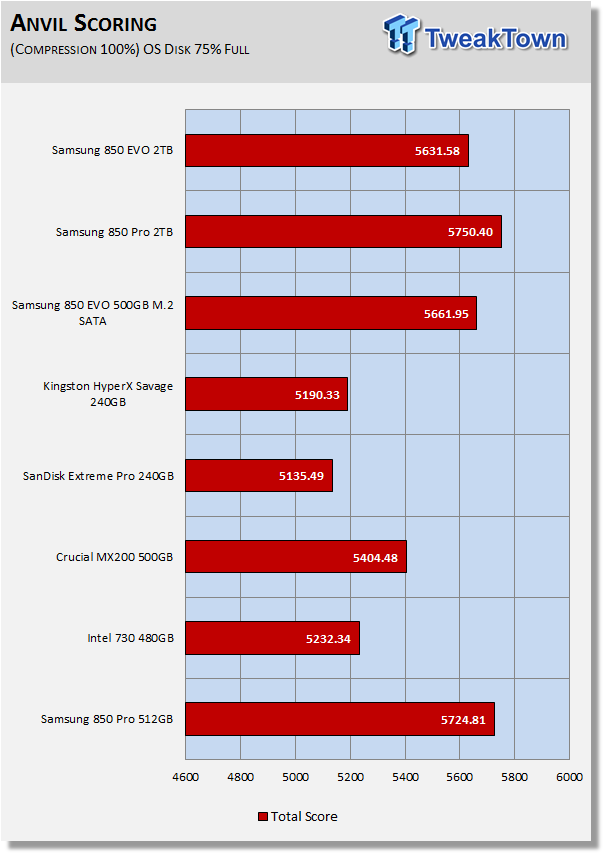
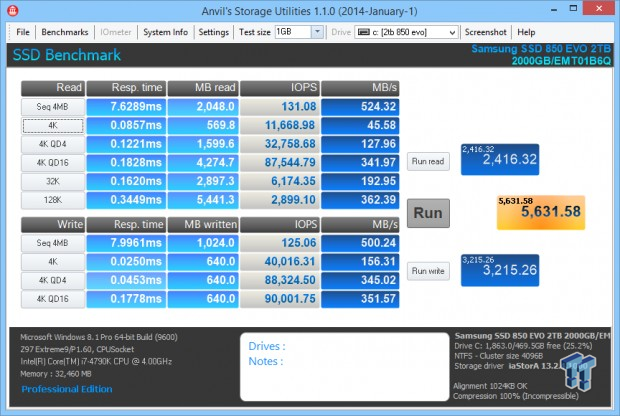
Anvil's scoring gives a good indication of a drives overall performance. The 850 Series drives all outperform the competition by a large margin in this test. The 2TB 850 PRO sets a new lab record for SATA SSD's.
(Anvil) Read IOPS through Queue Depth Scale
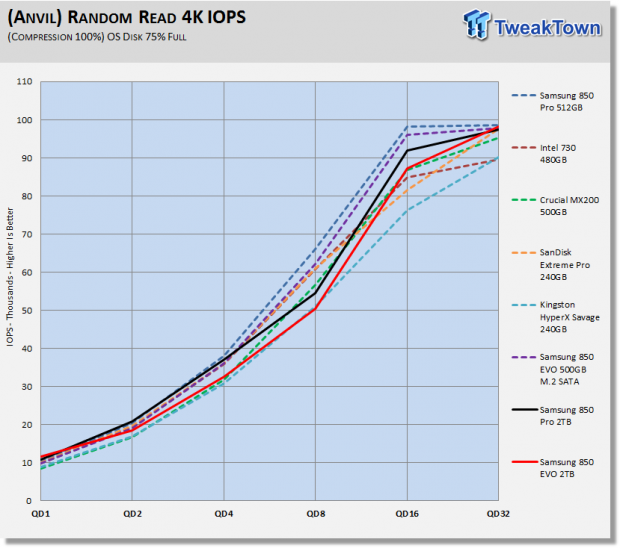
The smaller capacity 850 Series drives are able to slightly outperform the 2TB versions when reading random data.
(Anvil) Write IOPS through Queue Scale
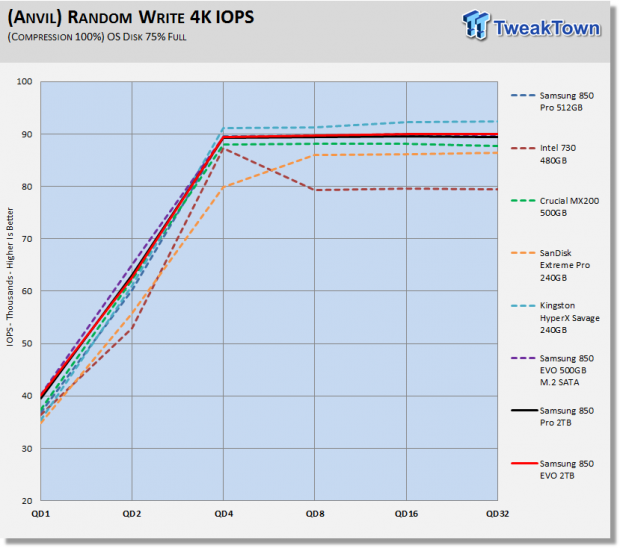
The 500GB M.2 850 EVO is the winner at QD1-2 after that, Kingston's HyperX Savage takes command.
Synthetic Benchmarks - CrystalDiskMark & AS SSD
CrystalDiskMark
Version and / or Patch Used: 3.0 Technical Preview
CrystalDiskMark is disk benchmark software that allows us to benchmark 4k and 4k queue depths with accuracy. Note: Crystal Disk Mark 3.0 Technical Preview was used for these tests since it offers the ability to measure native command queuing at QD4.
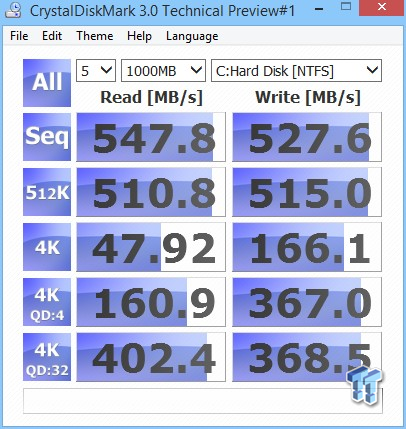
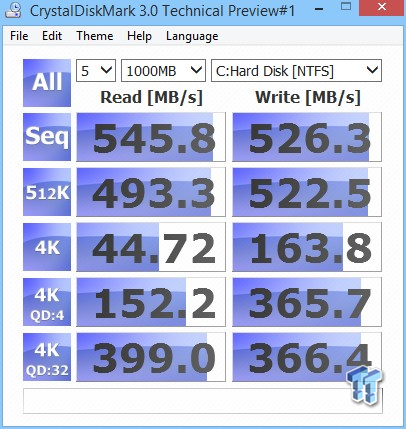
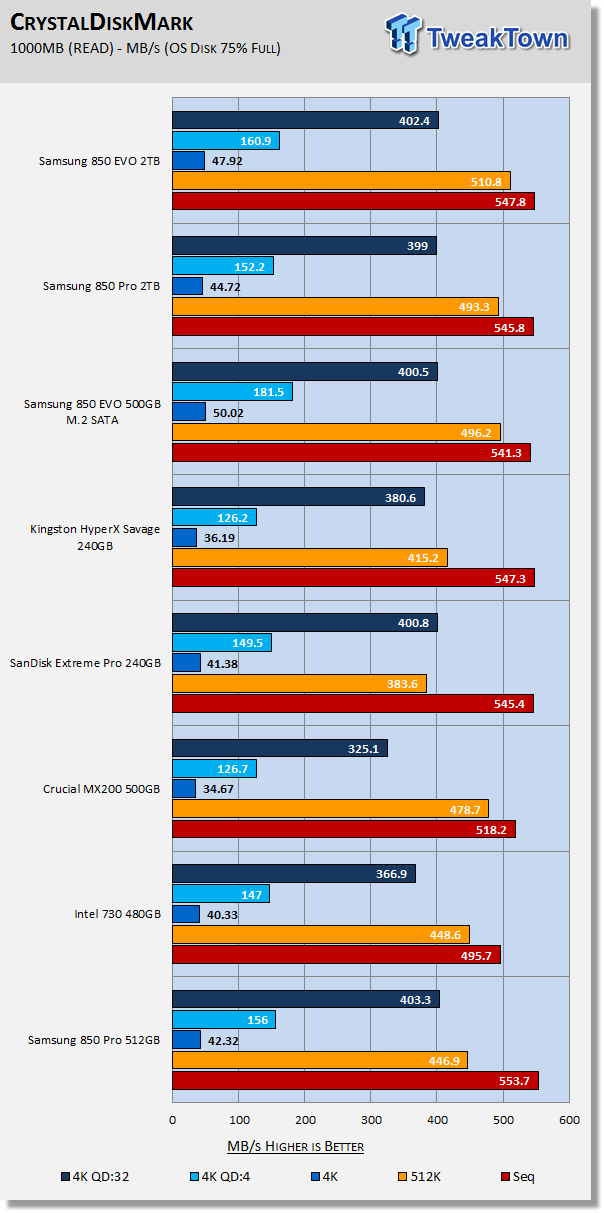
The 500GB 850 EVO M.2 is overall the best performer with the read portion of this test. Note the 2TB 850 PRO has better QD1 performance than the 512GB version. Also of note, the 2TB 850 EVO has by far the best 512K read performance we've seen to date for a SATA-based SSD.
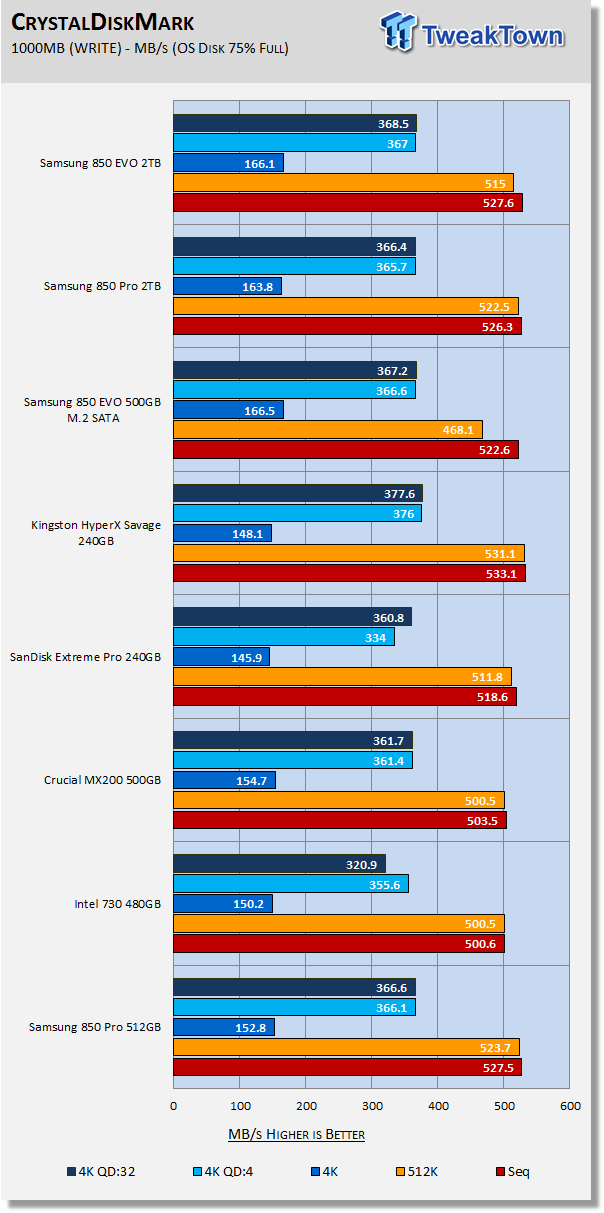
Again we see a boost in 4K QD1 random performance from the 2TB 850 Pro in comparison to the 512GB version. Overall, the 850 EVO's are outperforming the 850 PRO's by a very slim margin.
AS SSD
Version and / or Patch Used: 1.7.4739.38088
AS SSD determines the performance of Solid-State Drives (SSD). The tool contains four synthetic as well as three practice tests. The synthetic tests are to determine the sequential and random read and write performance of the SSD.

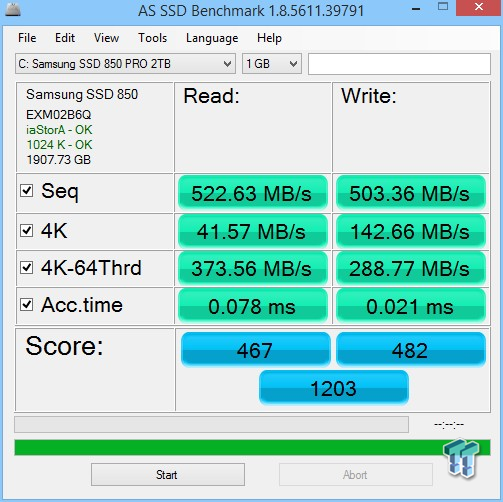
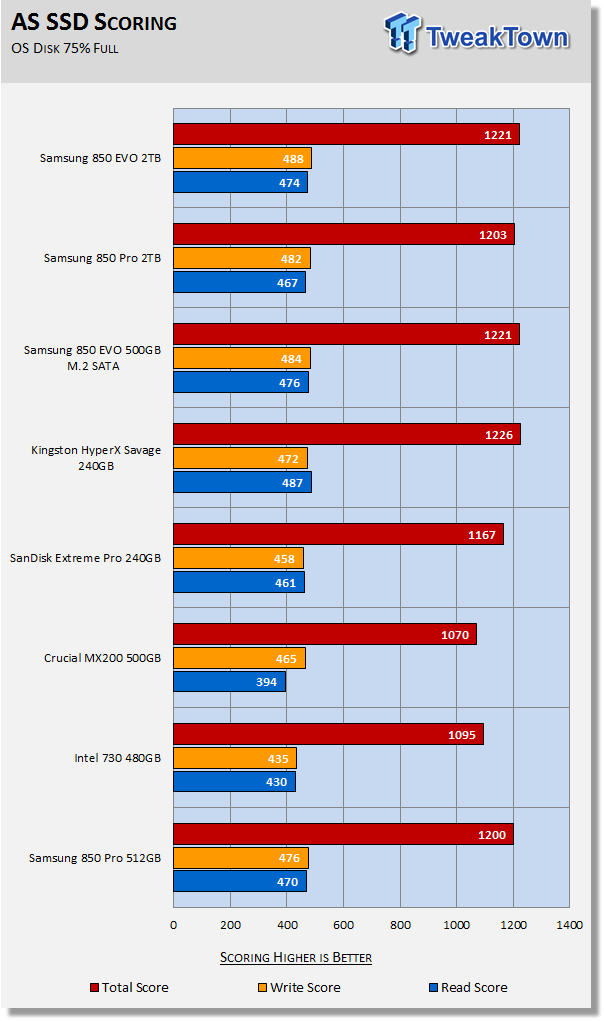
Samsung's TurboWrite emulated SLC technology allows the 850 EVO's to power through this test a little better than the 850 PRO's. Overall scoring is second to Kingston's HyperX Savage.
Benchmarks (Trace Based OS Volume) - PCMark Vantage, PCMark 7 & PCMark 8
Moderate Workload Model
We categorize these tests as indicative of a moderate workload environment.
PCMark Vantage - Hard Disk Tests
Version and / or Patch Used: 1.2.0.0
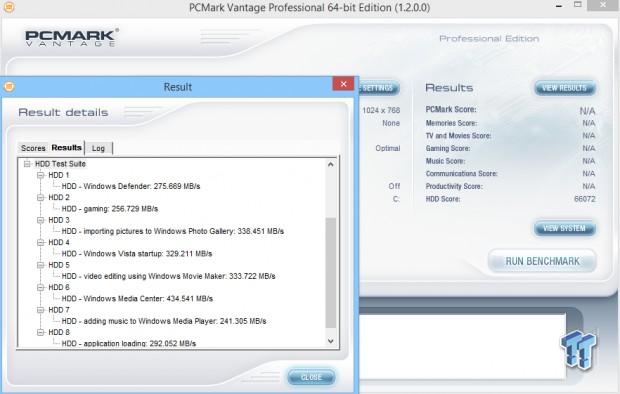
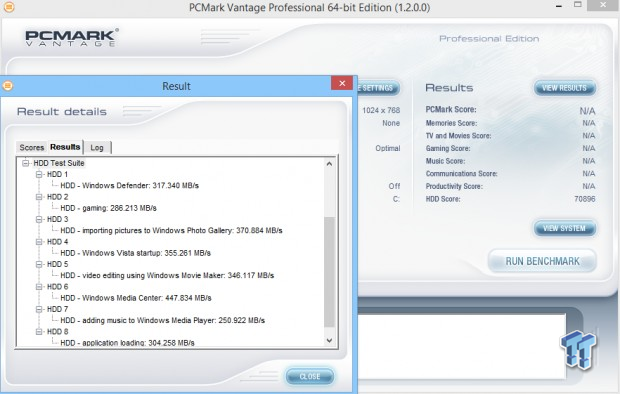
The reason we like PCMark Vantage is because the recorded traces are played back without system stops. What we see is the raw performance of the drive. This allows us to see a marked difference between scoring that other trace-based benchmarks do not exhibit. An example of a marked difference in scoring on the same drive would be empty vs. filled vs. steady state.
We run Vantage three ways. The first run is with the OS drive 75% full to simulate a lightly used OS volume filled with data to an amount we feel is common for most users. The second run is with the OS volume written into a "Steady State" utilizing SNIA's guidelines. Steady state testing simulates a drives performance similar to that of a drive that been subjected to consumer workloads for extensive amounts of time. The third run is a Vantage HDD test with the test drive attached as an empty, lightly used secondary device.
OS Volume 75% Full - Lightly Used
OS Volume 75% Full - Steady State
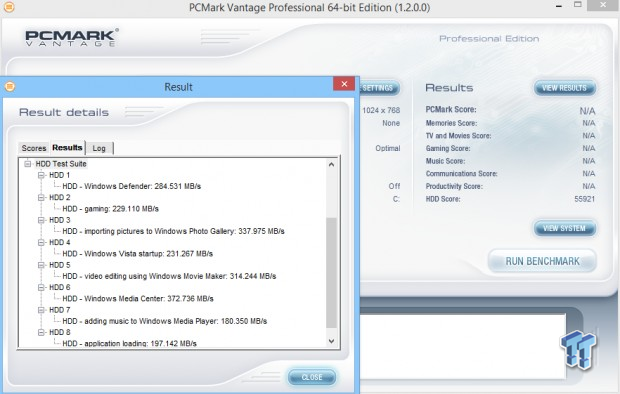
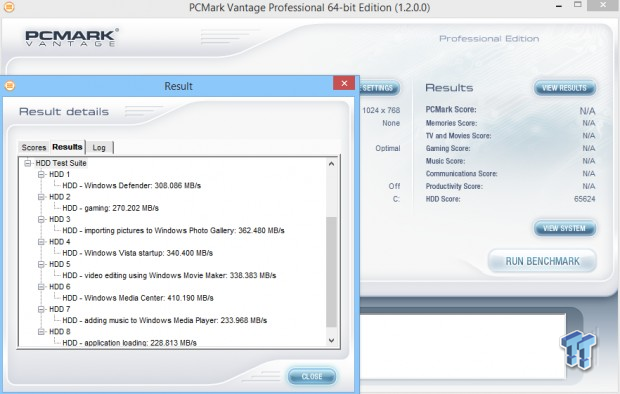
Secondary Volume Empty - FOB
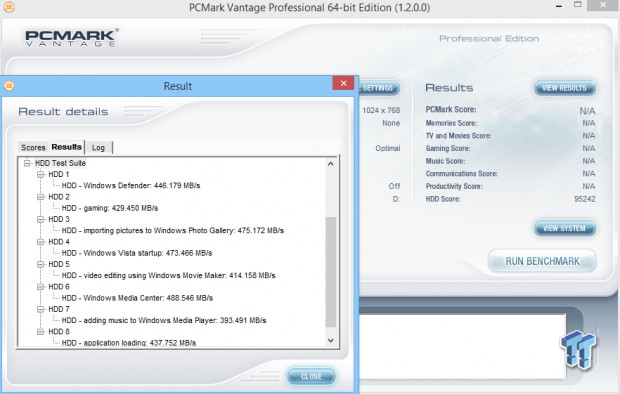
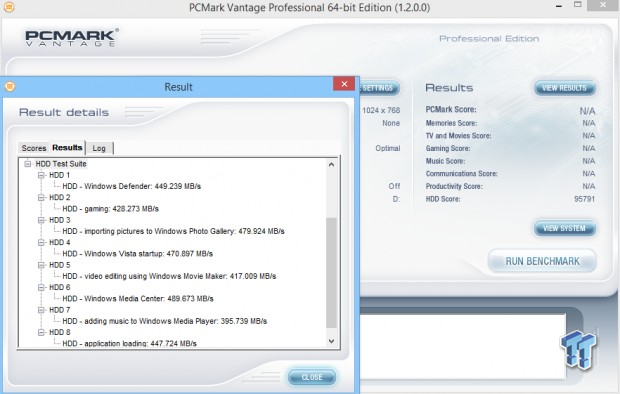
There's a big difference between an empty drive, one that's 75% full/used, and one that's in a steady state.
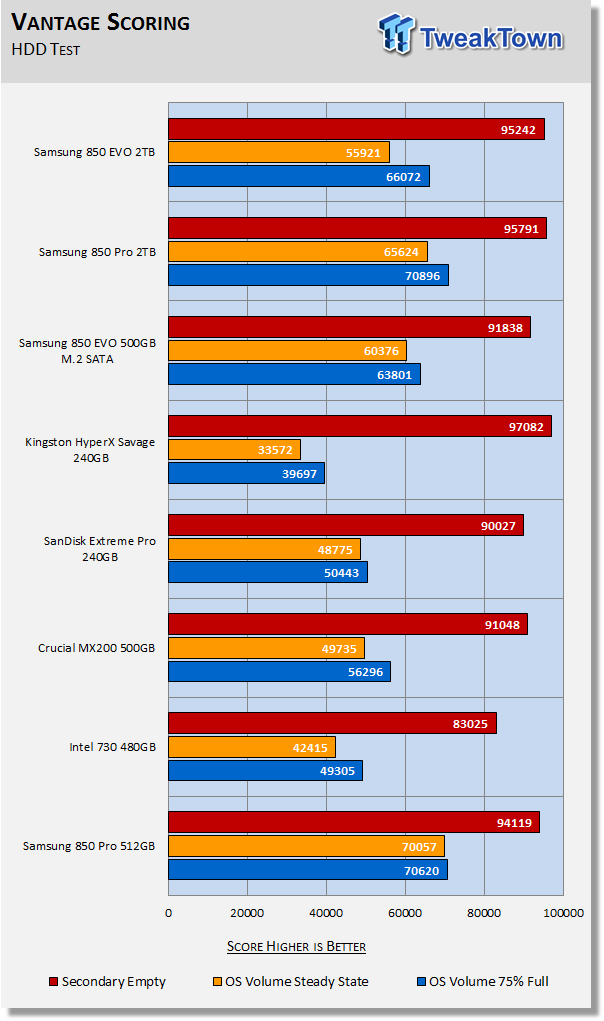
The important scores to pay attention to are "OS Volume Steady State" and "OS Volume 75% full." These two categories are most important because they are indicative of typical of consumer user states. When a drive is in a steady state, it means garbage collection is running at the same time it's reading/writing. This is exactly why we focus on steady state performance.
Samsung's 850 PRO's continue to dominate this testing. The 850 EVO's come in with the second best results for SATA-based SSD's that we've recorded to date.
PCMark 7 - System Storage
Version and / or Patch Used: 1.4.0
We will look to Raw System Storage scoring for an evaluation because it's done without system stops and therefore allows us to see significant scoring differences between drives.
OS Volume 75% Full - Lightly Used
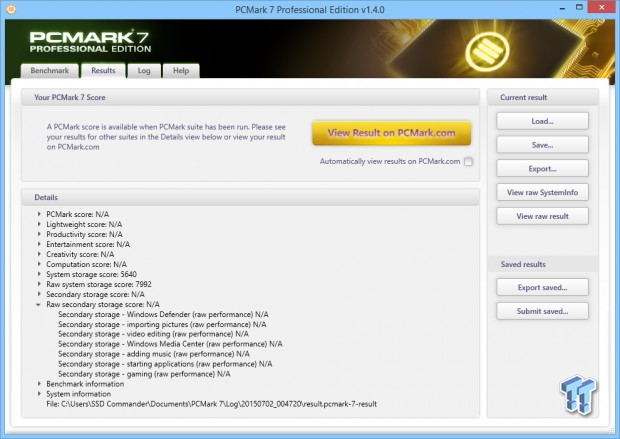
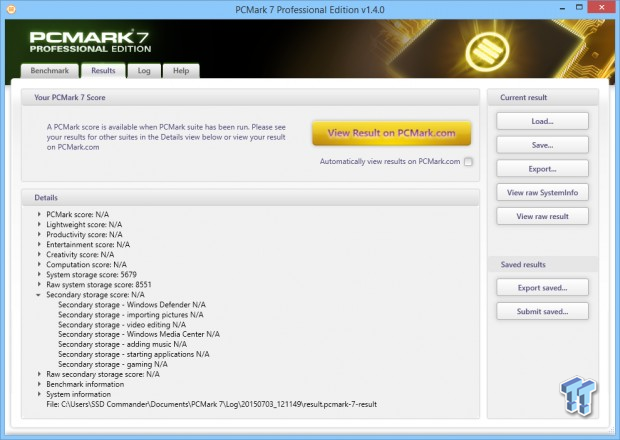
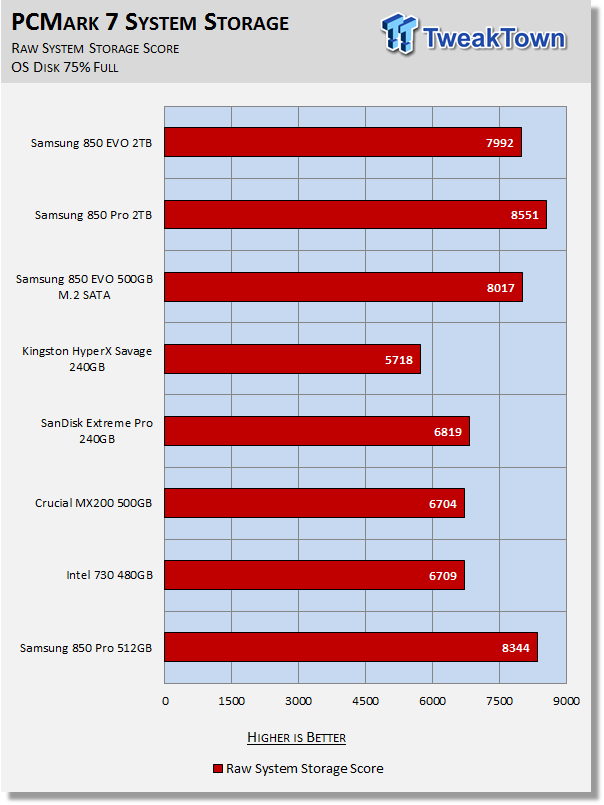
Again, the 850 EVO's come in second to the 850 PRO's. Both Samsung 850 Series drives are able to outperform the competition by a large margin. The 2TB 850 Pro sets another lab record for a SATA-based SSD.
PCMark 8 - Storage Bandwidth
Version and / or Patch Used: 2.4.304
We use PCMark 8 Storage benchmark to test the performance of SSDs, HDDs, and hybrid drives with traces recorded from Adobe Creative Suite, Microsoft Office, and a selection of popular games. You can test the system drive or any other recognized storage device, including local external drives. Unlike synthetic storage tests, the PCMark 8 Storage benchmark highlights real-world performance differences between storage devices.
OS Volume 75% Full - Lightly Used
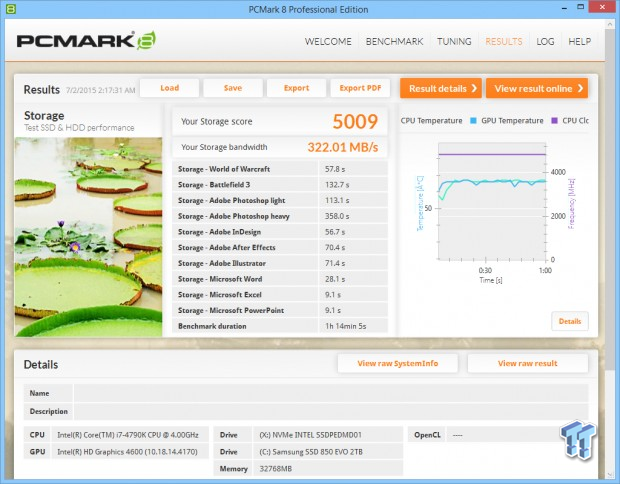
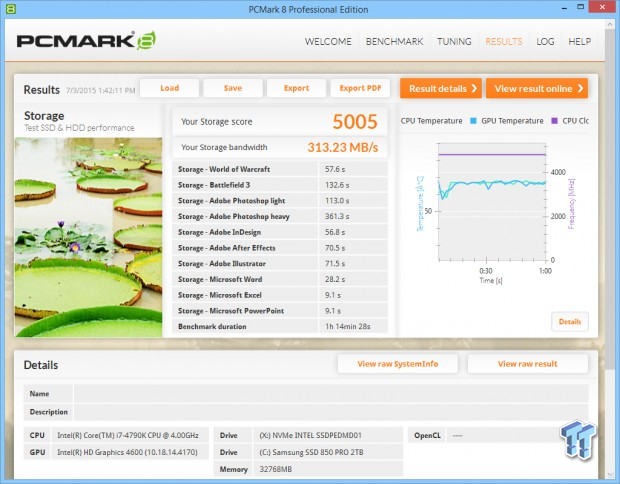
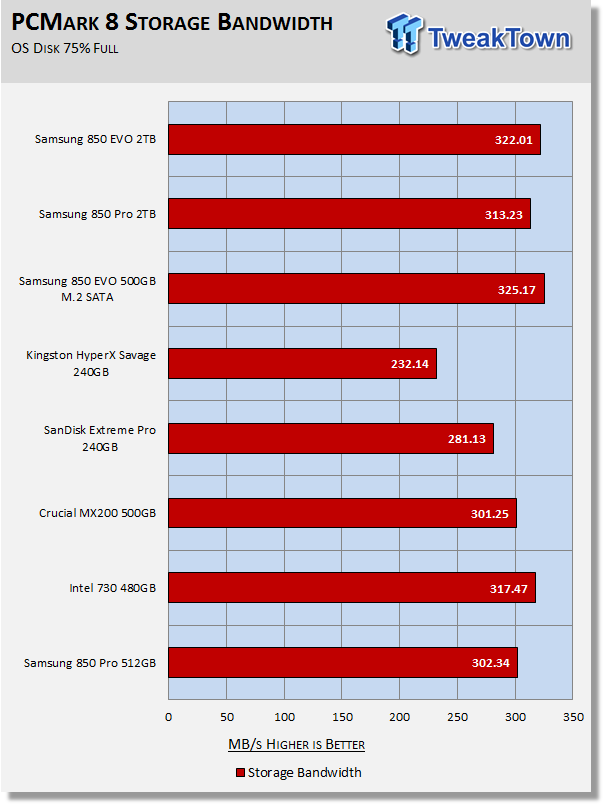
PCMark 8 is the most intensive moderate workload simulation we run. With respect to moderate workloads, this test is what we consider the best indicator of a drives performance and the 500GB 850 EVO M.2 remains our lab champion in this test. The 2TB 850 EVO is hot on its heels though. The 2TB 850 Pro is able to outperform the 512GB 850 Pro in this test.
Benchmarks (Secondary Volume) - Max IOPS, Disk Response & Transfer Rates
Iometer - Maximum IOPS
Version and / or Patch Used: Iometer 2014
We use Iometer to measure high queue depth performance. (No Partition)
Max IOPS Read
Max IOPS Write
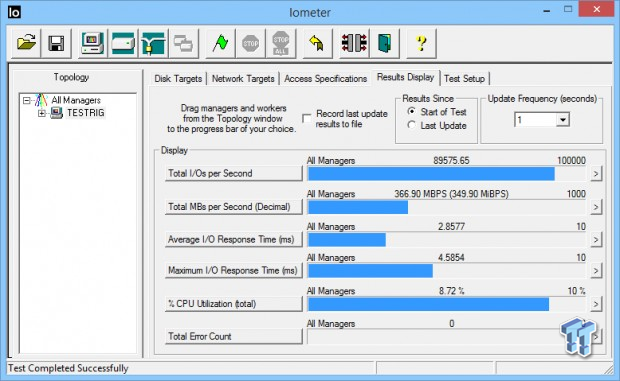
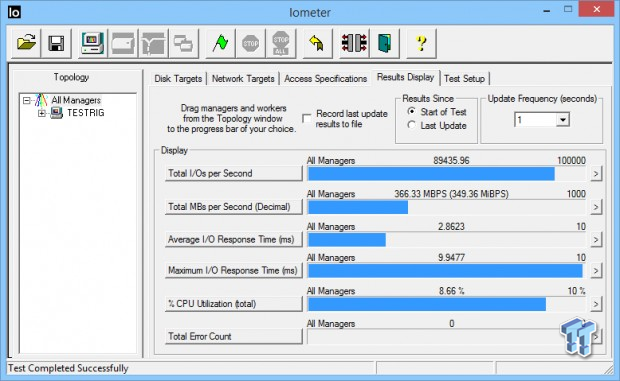
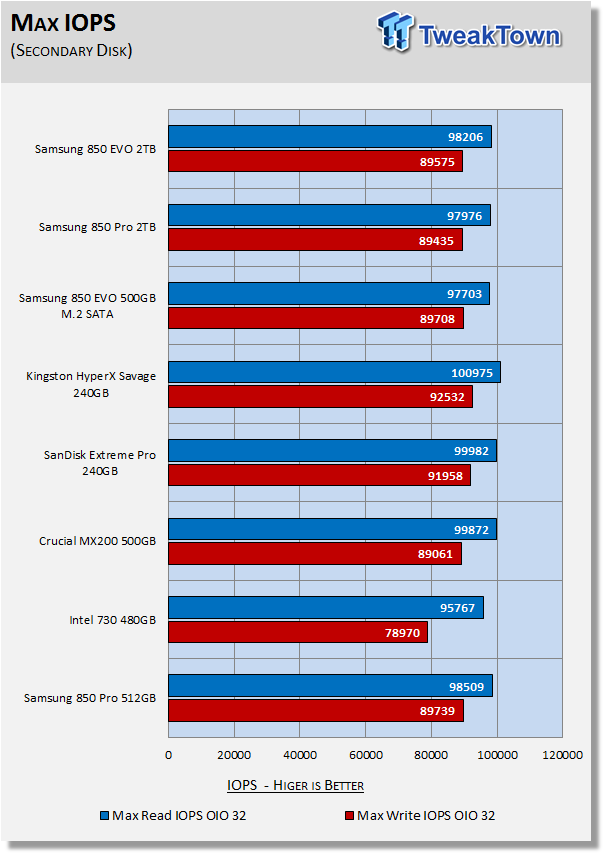
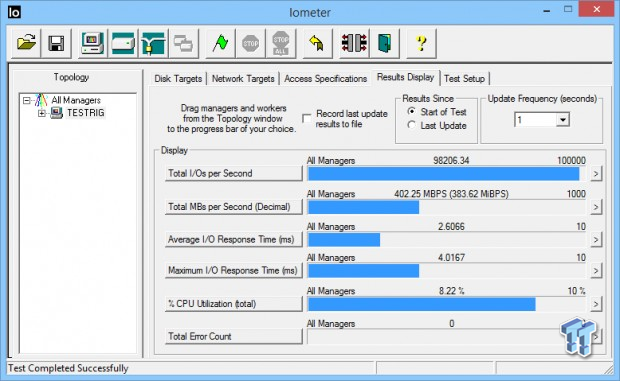
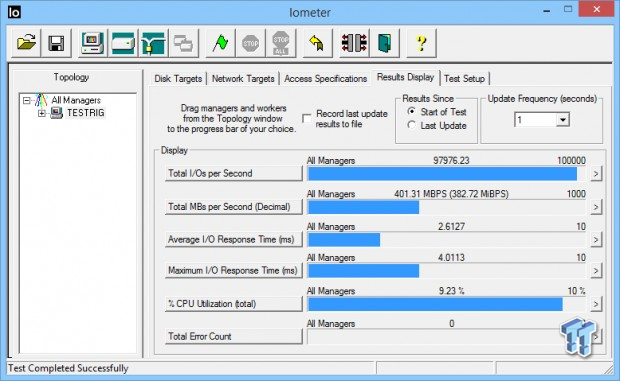
The 2TB EVO is matching and exceeding specification, the 2TB Pro is not quite hitting advertised specs. Kingston's HyperX Savage is the winner of this test.
Iometer - Disk Response
Version and / or Patch Used: Iometer 2014
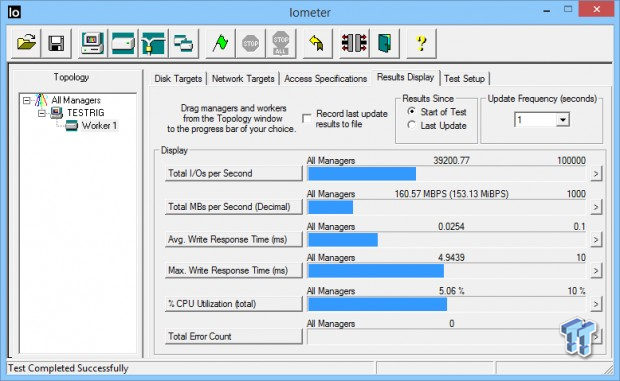
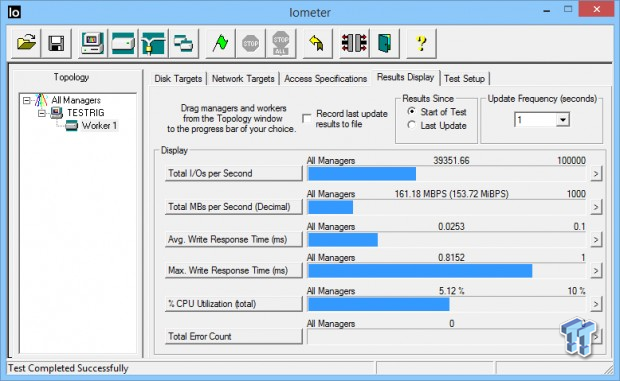
We use Iometer to measure disk response times. Disk response times are measured at an industry accepted standard of 4K QD1 for both write and read. Each test runs twice for 30 seconds consecutively, with a 5-second ramp-up before each test. We partition the drive/array as a secondary device for this testing.
Avg. Write Response
Avg. Read Response
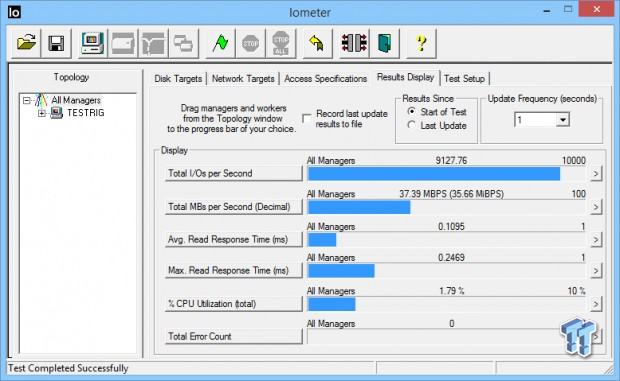
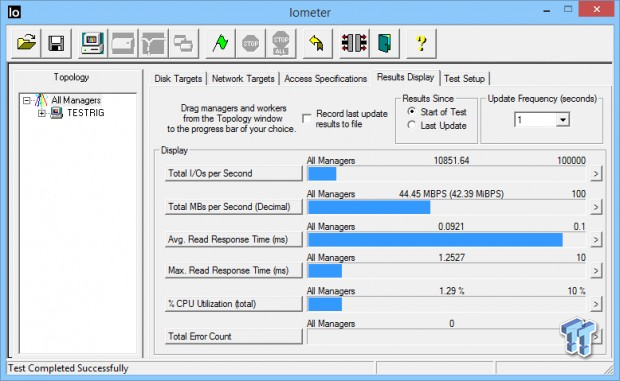
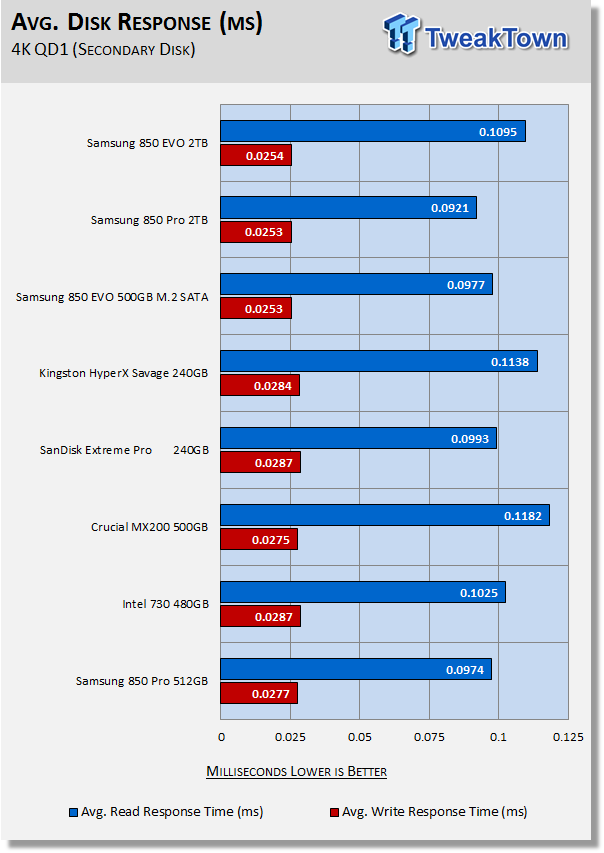
The 2TB PRO has better read/write response times than the 2TB EVO. In both read and write response times the 2TB 850 PRO becomes our single drive SATA lab record holder. Note the improvement of the 2TB 850 PRO over the 512GB version.
DiskBench - Directory Copy
Version and / or Patch Used: 2.6.2.0
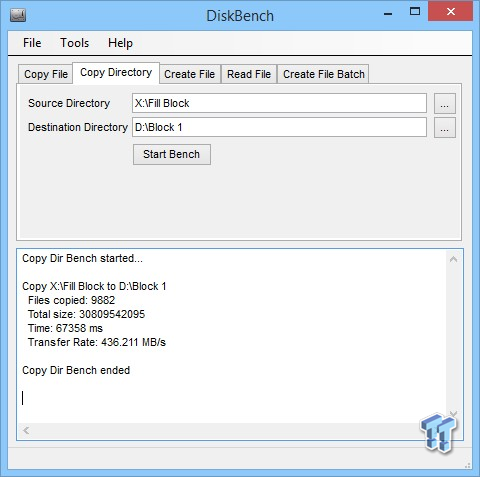
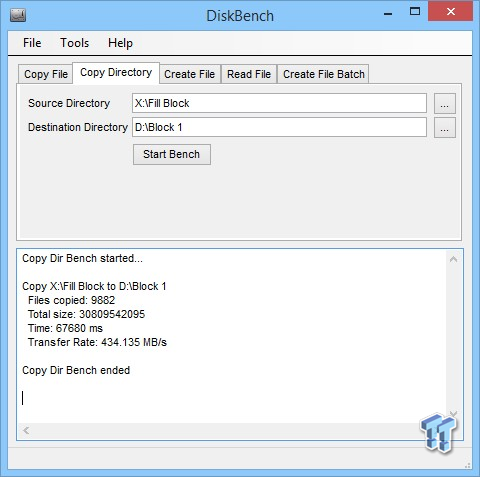
We use DiskBench to time a 28.6GB block (9,882 files in 1,247 folders) composed primarily of incompressible sequential and random data as it's transferred from our DC P3700 PCIe NVME SSD to our test drive. We then read from a 6GB zip file that's part of our 28.6GB data block to determine the test drives read transfer rate. Our system is restarted prior to the read test to clear any cached data, ensuring an accurate test result.
Write Transfer Rate
Read Transfer Rate
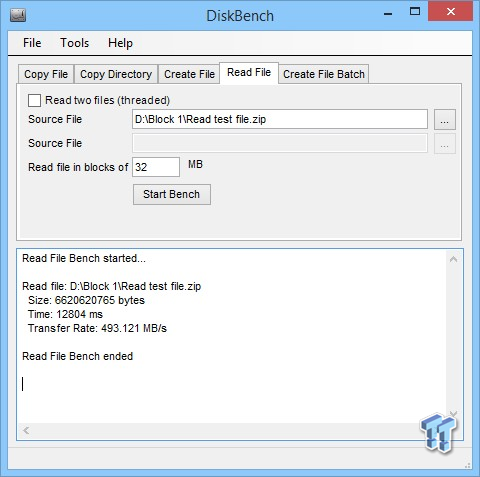
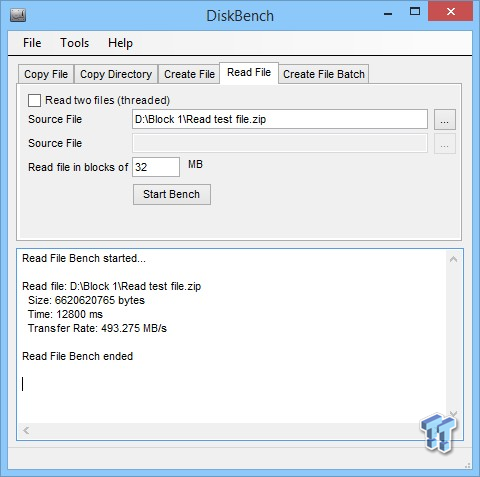

For the most part all of the Samsung drives perform the same. The only stand out in this test is the HyperX Savage's write transfer rate.
Benchmarks (Secondary Volume) - PCMark 8 Extended
Futuremark PCMark 8 Extended
Heavy Workload Model
PCMark 8's consistency test simulates an extended duration heavy workload environment. PCMark 8 has built-in, command line executed storage testing. The PCMark 8 Consistency test measures the performance consistency and the degradation tendency of a storage system.
The Storage test workloads are repeated. Between each repetition, the storage system is bombarded with a usage that causes degraded drive performance. In the first part of the test, the cycle continues until a steady degraded level of performance has been reached. (Steady State)
In the second part, the recovery of the system is tested by allowing the system to idle and measuring the performance after 5-minute long intervals. (Internal drive maintenance: Garbage Collection (GC)) The test reports the performance level at the start, the degraded steady-state, and the recovered state, as well as the number of iterations required to reach the degraded state and the recovered state.
We feel Futuremark's Consistency Test is the best test ever devised to show the true performance of solid-state storage in an extended duration heavy workload environment. This test takes on average 13 to 17 hours to complete, and writes somewhere between 450GB and 14,000GB of test data depending on the drive. If you want to know what an SSD's steady state performance is going to look like during a heavy workload, this test will show you.
Here's a breakdown of Futuremark's Consistency Test:
Precondition phase:
1. Write to the drive sequentially through up to the reported capacity with random data.
2. Write the drive through a second time (to take care of overprovisioning).
Degradation phase:
1. Run writes of random size between 8*512 and 2048*512 bytes on random offsets for 10 minutes.
2. Run performance test (one pass only).
3. Repeat 1 and 2 for 8 times, and on each pass increase the duration of random writes by 5 minutes.
Steady state phase:
1. Run writes of random size between 8*512 and 2048*512 bytes on random offsets for 50 minutes.
2. Run performance test (one pass only).
3. Repeat 1 and 2 for 5 times.
Recovery phase:
1. Idle for 5 minutes.
2. Run performance test (one pass only).
3. Repeat 1 and 2 for 5 times.
Storage Bandwidth
PCMark 8's Consistency test provides a ton of data output that we use to judge a drive's performance.
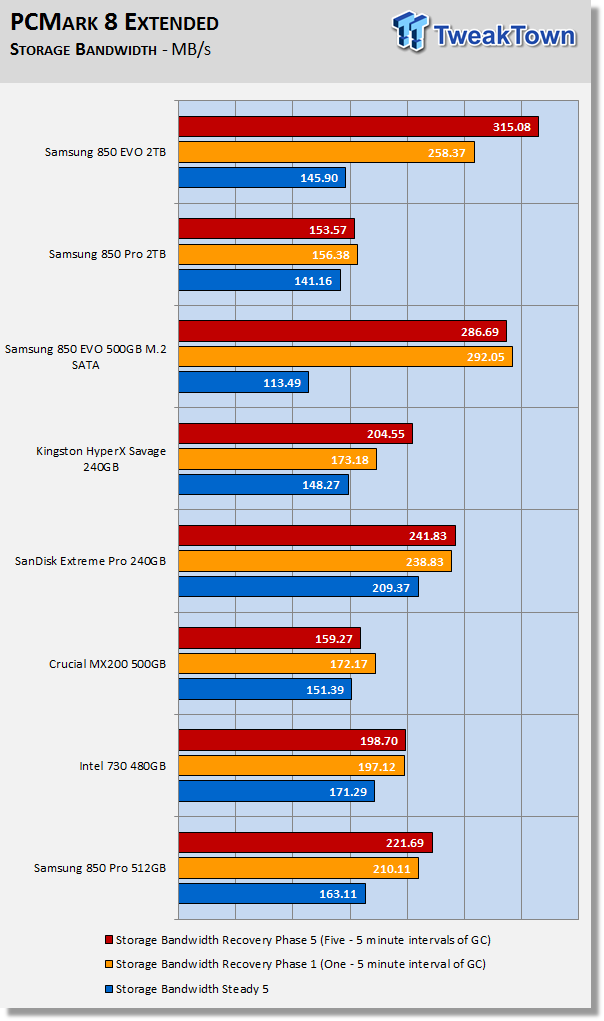
We consider steady state bandwidth (the blue bar) our test that carries the most weight in ranking a drive/arrays heavy workload performance. Performance after Garbage Collection (GC) (the orange and red bars) is what we consider the second most important consideration when ranking a drives performance. Trace based steady state testing is where true high performing SSDs are separated from the rest of the pack.
The 2TB 850 EVO with its massive capacity assisting it is able to outperform the 500GB 850 EVO big time in a steady state. For the 2TB 850 Pro the opposite; the 512GB 850 Pro outperforms the 2TB version in a steady state. We believe Samsung SSD's are shelving drive maintenance commands for idle time so deep steady states suffer a performance hit. This is evidenced by the fact that after a brief 5-minute idle time the 850 EVO's both outperform the rest of the field by a large margin. After five 5 minute intervals of idle time the 2TB 850 EVO sets a new lab record for a SATA SSD. The 850 Pro 2TB doesn't recover.
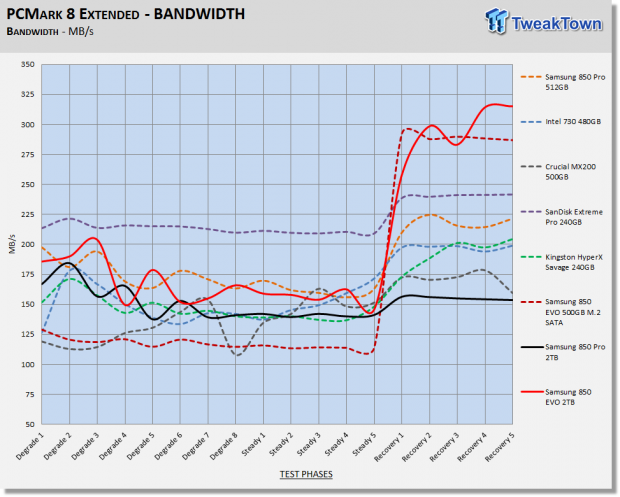
We chart our test subject's storage bandwidth as reported at each of the test's 18 trace iterations. This gives us a good visual perspective of how our test subjects perform as testing progresses.
Total Access Time (Latency)
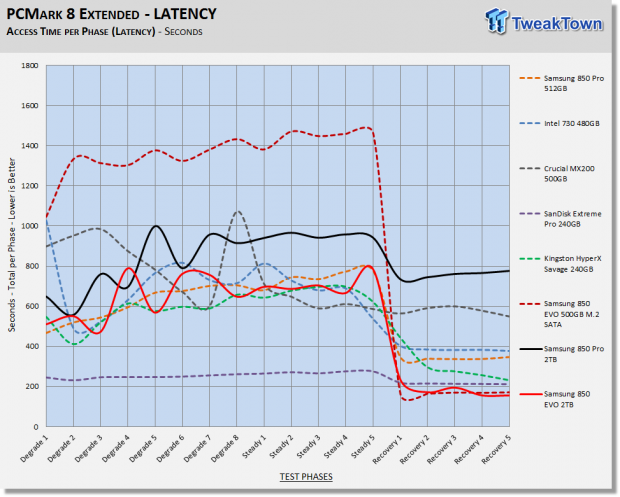
We chart the total time the disk is accessed as reported at each of the test's 18 trace iterations.
Disk Busy Time
Disk Busy Time is how long the disk is busy working. We chart the total time the disk is working as reported at each of the tests 18 trace iterations.
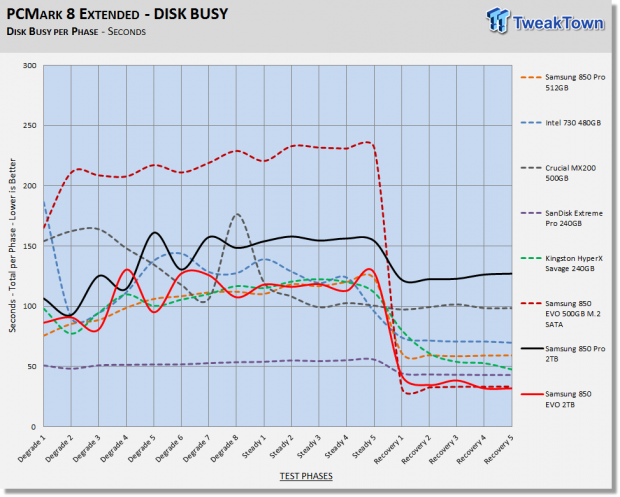
When latency is low, disk busy time is low as well.
Data Written
We measure the total amount of random data that our test drive/array is capable of writing during the degradation phases of the consistency test. Pre-conditioning data is not included in the total. The total combined time that degradation data is written to the drive/array is 470 minutes. This can be very telling. The better a drive/array can process a continuous stream of random data, the more data will be written.
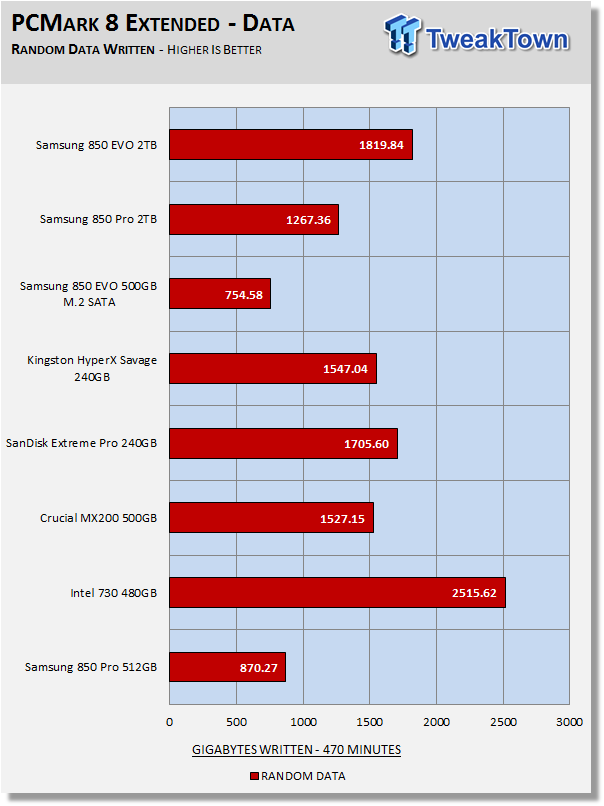
Shelving drive maintenance results in less data being written during the degrade phases of our test. Intel's 730 maintains a much cleaner flash array during the test and is able to write much more random data in the same amount of time.
Benchmarks (Secondary Volume) - 70/30 Mixed Workload
70/30 Mixed Workload Test (Sledgehammer)
Version and / or Patch Used: Iometer 2014
Heavy Workload Model
This test hammers a drive so hard we've dubbed it "Sledgehammer". Our 70/30 Mixed Workload test is designed to simulate a heavy-duty enthusiast/workstation steady-state environment. We feel that a mix of 70% read/30% write, full random 4K transfers best represents this type of user environment. Our test allows us to see the drive enter into and reach a steady state as the test progresses.
Phase one of the test preconditions the drive for 1 hour with 128K sequential writes. Phase two of the test runs a 70% read/30% write, full random 4K transfer workload on the drive for 1 hour. We log and chart (phase two) IOPS data at 5-second intervals for 1 hour (720 data points). 60 data points = 5 minutes.
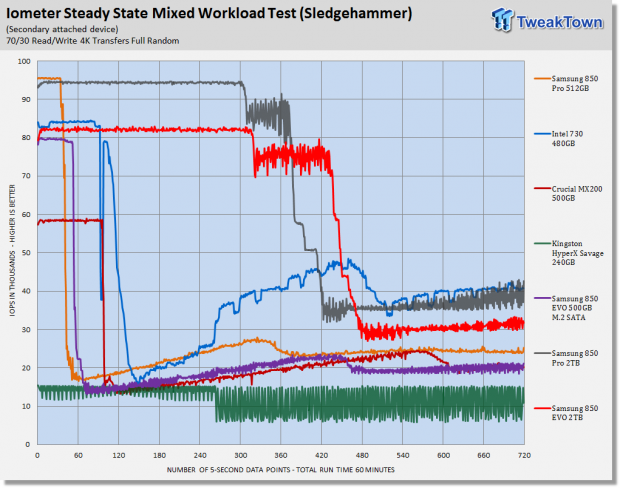
What we like about this test is that it reflects reality. Everything lines up, as it should. Consumer drives don't outperform Enterprise-Class SSD's that were designed for enterprise workloads. Consumer drives based on old technology are not outperforming modern Performance-Class SSD's, etc.
The massive capacity of the 2TB 850 EVO and PRO keep performance high for 25minutes before they begin to enter a steady state. The 2TB 850 Pro reaches a steady state at 35 minutes. The 2TB EVO takes 40 minutes to reach a steady state. Both drives perform much better than their smaller counterparts. The 2TB 850 PRO outperforms the 2TB 850 EVO by about 7000 IOPS in this test.
Maxed-Out Performance (MOP)
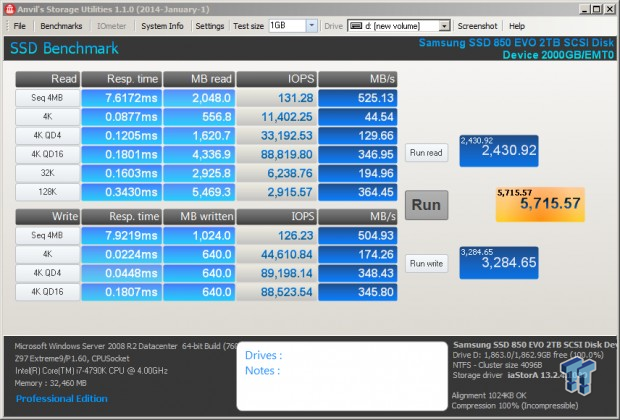
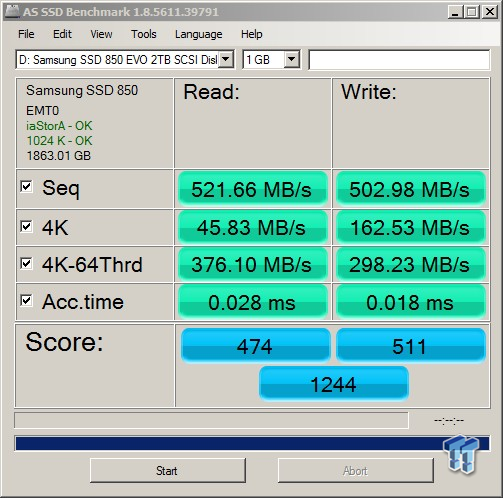
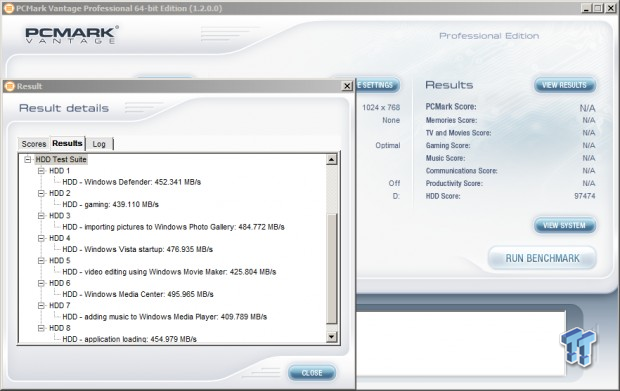
This testing is just to see what the drive is capable of in an FOB (Fresh Out of Box) state under optimal conditions. We are utilizing Windows Server 2008 R2 64-bit for this testing. Same Hardware, just an OS change.
Samsung 850 EVO 2TB
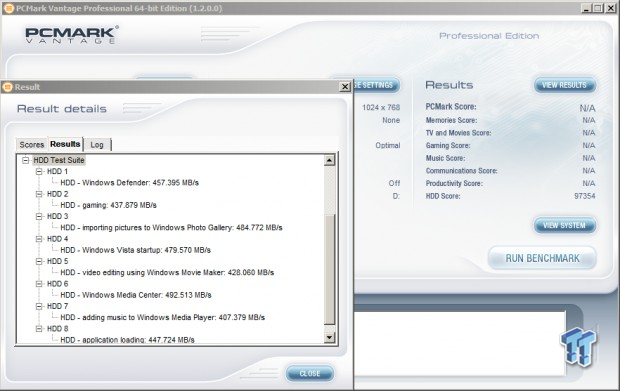
Samsung 850 PRO 2TB
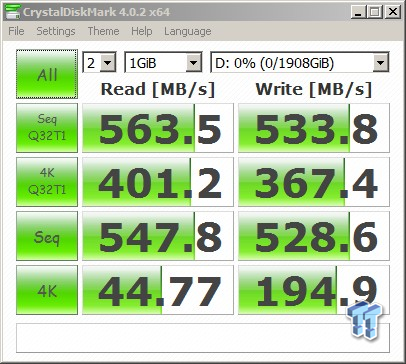
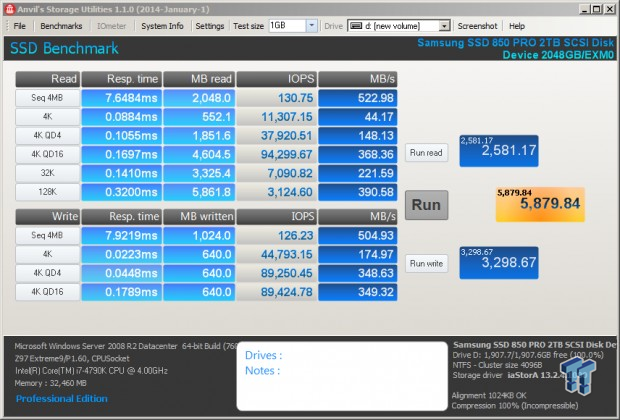
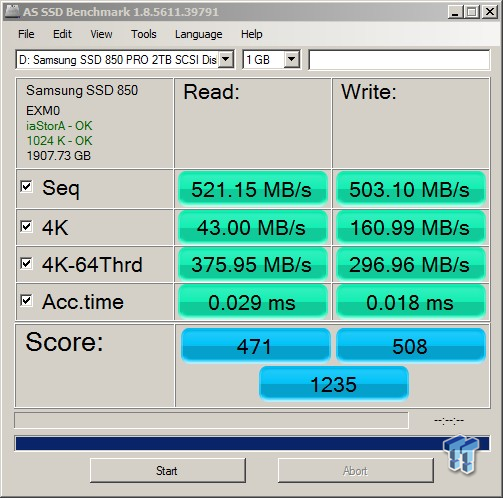
Final Thoughts
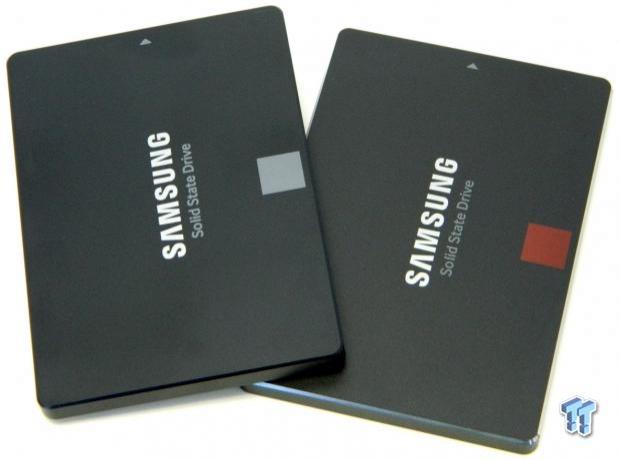
Samsung's SSD's are completely in-house products. Samsung flash, Samsung controller, and Samsung DRAM. Not needing any third party components gives Samsung an inherent advantage over most of the competition. In addition, Samsung currently enjoys a technological advantage with superior 3D flash.
HDD like capacity with true SSD performance. You wanted it, and now it's here. Admittedly these drives are 10x the cost of a comparable capacity HDD, but they also deliver at least 10x the performance. As always, you get what you pay for. The 2TB 850 EVO and PRO perform about the same. The good news is, capacity aside, the performance of both of these SSD's is a cut above the competition. We love that Samsung chose to engineer a new controller to insure that their 2TB SSD's would perform at a high level.
Looking at performance, we found the 2TB 850 EVO performs at about the same level as a 500GB-1TB 850 EVO, with the exception of heavy workloads where we find it performs much better. What we weren't expecting was the nice performance boost we saw from the 2TB 850 PRO in comparison to the smaller capacity 850 PRO's. Random 4K QD1 write performance in particular, has been increased considerably with the new MHX controller. As you know, we believe the 850 EVO is the fastest line of consumer SATA SSD's, although that line has become blurred by the 2TB 850 PRO because overall, it is just as fast as the 850 EVO. As intended by Samsung, both models have their own advantages. The 2TB EVO has the price advantage, at $799 it's $200 cheaper than the 2TB 850 PRO. The 850 Pro has the advantage of double the endurance and a 10-year warranty.
Our experience while running both of these drives as our OS volume was outstanding. I would have to say the best SATA experience I've had to date. Does 3D flash make a difference? You bet it does, you can feel the difference. Everything is faster, sometimes considerably faster. If you want even more performance from these SSD's, Samsung has that coming in mid-August with Magician caching software that will support both 2TB drives.
Samsung 850 EVO and PRO 2TB
Pros:
- Highest capacity
- Best endurance
- Low power requirement
Cons:
- Nothing

