
The Bottom Line
Introduction & Specifications, Pricing, and Availability
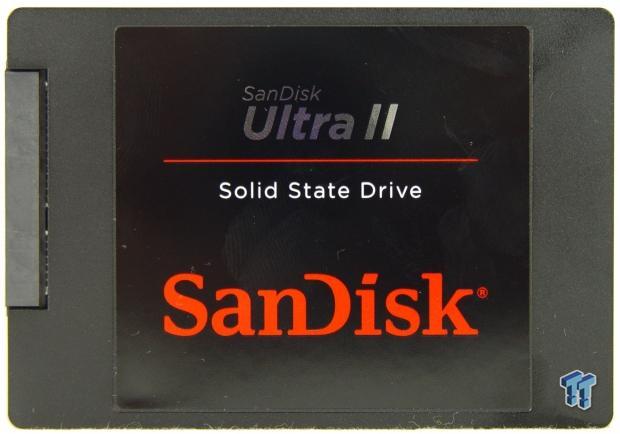
SanDisk's Ultra II is the first consumer SSD on the market, outside of Samsung's 840 EVO, to use 3-bit per cell NAND flash. We already published a report on the 240GB model last month, but the two larger capacity Ultra II models ship with a different controller. The 120GB and 240GB Ultra II drives use Marvell's latest consumer four-channel controller. The 480GB we're testing today, and the large 960GB model, both use a Marvell eight-channel controller that should increase performance and efficiency.
The 512GB capacity increased in popularity this year for our readers. Not only have games become significantly larger, but the price of large SSDs has decreased as well. The Ultra II 480GB we're testing today costs just $209.99 (Newegg). Just six months ago, that price for this amount of capacity was reserved for sale prices, but has since become normal.
Let's see how the SanDisk Ultra II compares to other SSDs on the market in this capacity.
Specifications, Pricing, and Availability
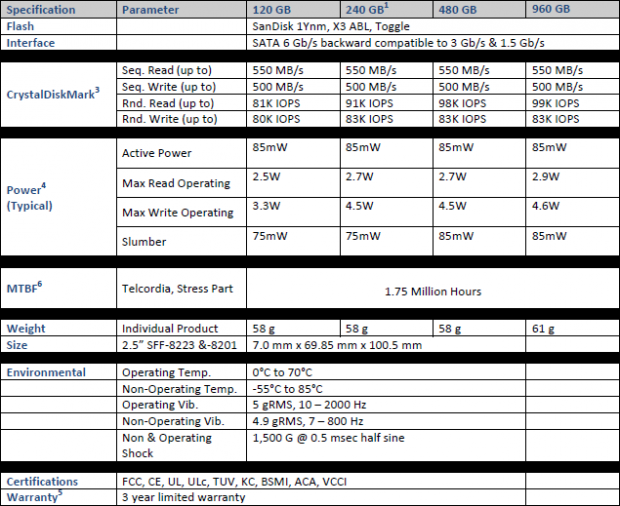
As we mentioned, the Ultra II ships in four capacities, 120GB, 240GB, 480GB, and a large 960GB. The two largest capacity models use a Marvell 88SS9189 eight-channel controller, and the two smaller models use Marvell's four-channel controller.
The Ultra II was the first SSD to use SanDisk's 1Y X3 ABL Toggle flash. The X3 designation is SanDisk's marketing term for TLC, or Triple Level Cell flash. The new SanDisk X300 also uses X3 technology, but is a business specific model.
The Ultra II doesn't just use TLC flash. The drive uses a layer of SLC through flash translation that collects all of the data writes, and then passes the data on to the X3 layer optimized for long-term storage. This reduces the write amplification of the X3 area, and also increases performance when writing data to the Ultra II. We covered nCache 2.0 and other advanced technology found in the Ultra II in the 240GB model review.
The advanced technology allows the Ultra II 480GB to deliver up to 550 MB/s sequential read, 500 MB/s sequential write speeds with up to 98K random reads, and 83K random writes. The controller change doesn't increase the typical power usage between the 240GB and 480GB models other than a slight 10mW increase in slumber state.
SanDisk covers all Ultra II SSDs with a three-year warranty, and the retail parts include a 7mm to 9.5mm adapter bracket. The Ultra II also works with SanDisk's Dashboard software. We recently covered all of the SSD manufacturer software tool releases in this article.
At the time of writing, Newegg has the Ultra II 480GB in stock for just $209.99. This is an amazing price point that is within a few dollars of the lowest priced 512GB capacity class SSDs at Newegg. The e-tail site also has the Ultra II in the other capacities with the 120GB model at $72.99, 240GB at $114.99, and the large 960GB model at just $403.99.
PRICING: You can find the SanDisk Ultra II SSD for sale below. The prices listed are valid at the time of writing, but can change at any time. Click the link to see the very latest pricing for the best deal.
United States: The SanDisk Ultra II 120GB retails for $69.99 at Amazon, the SanDisk Ultra II 240GB retails for $114.99 at Amazon, the SanDisk Ultra II 480GB retails for $209.00 at Amazon, and the SanDisk Ultra II 960GB retails for $419.00 at Amazon.
Canada: The SanDisk Ultra II 120GB retails for CDN$93.36 at Amazon Canada, the SanDisk Ultra II 240GB retails for CDN$129.99 at Amazon Canada, the SanDisk Ultra II 480GB retails for CDN$267.97 at Amazon Canada and the SanDisk Ultra II 960GB retails for CDN$504.12 at Amazon Canada.
SanDisk Ultra II 480GB SSD

Although this is our second review of the Ultra II Series, this is the first model we've seen with the retail box and accessories. The first 240GB Ultra II shipped in a drive only configuration, and wasn't on the market as a retail part when we tested it.
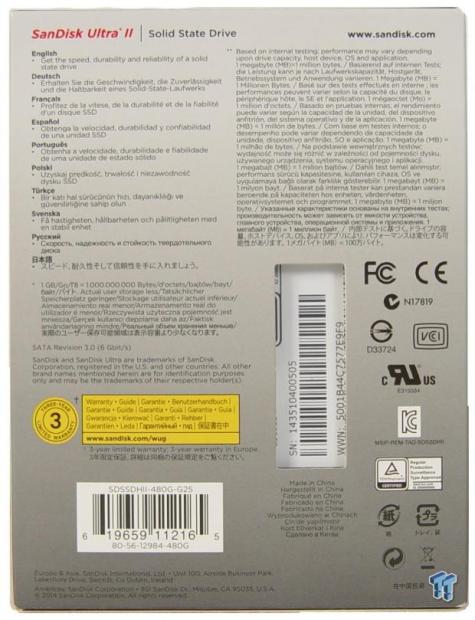
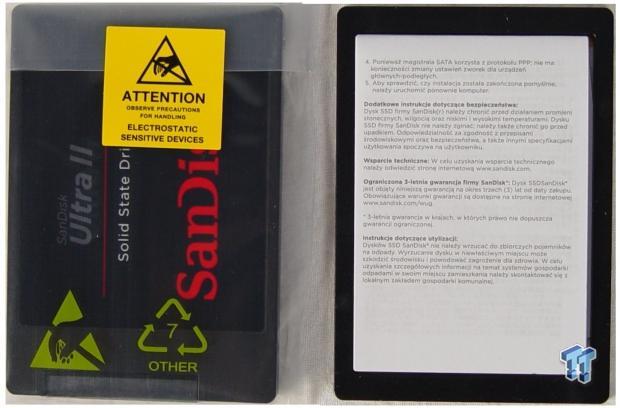
The retail kit includes a 7mm to 9.5mm adapter, paper warranty statement, and a reminder to download the SanDisk Dashboard software from SanDisk's website.
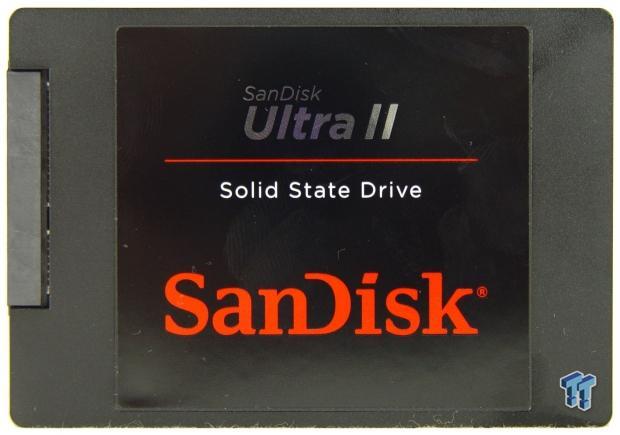
The drive is very light; half of the case is made of metal, and the other half is made of plastic. The controller, DRAM, and flash all face the metal side with thermal transfer material pads between the components and the case.
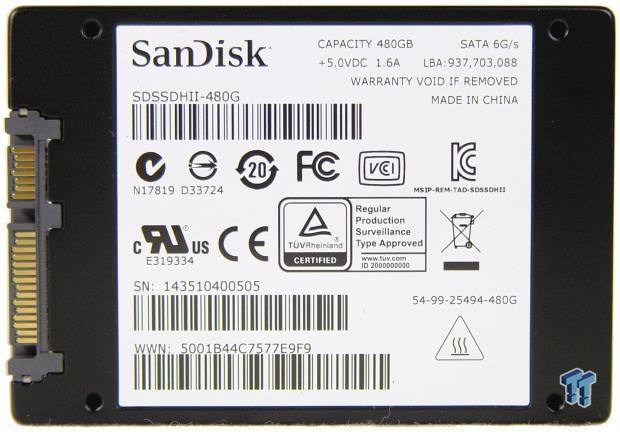
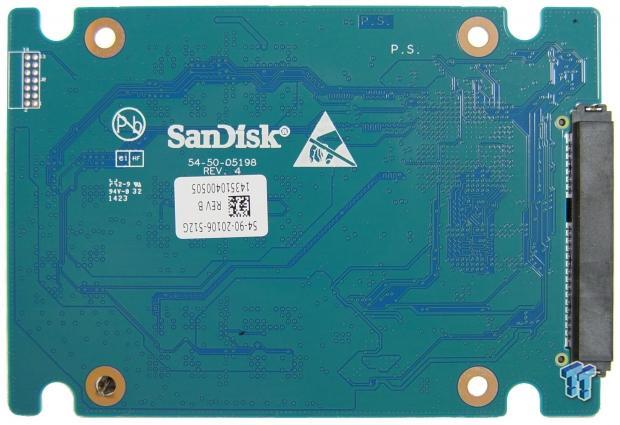
The back of the drive has the model number, serial number, and capacity label.

Ultra II has a 7mm z-height, so it will fit in newer Ultrabook designs that are too thin to use a full 9.5mm drive.

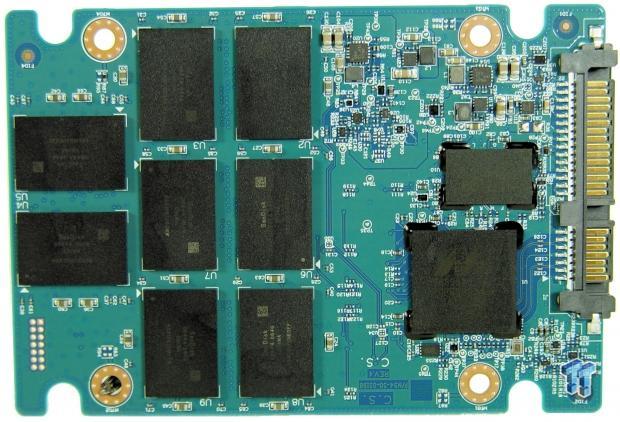
Inside, we found all of the components on just one side of the PCB.
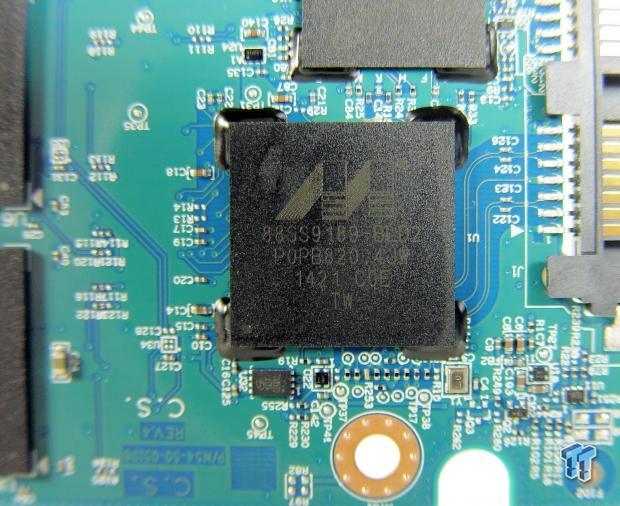
This 480GB capacity Ultra II uses Marvell 88SS9189-BLD2 controllers.
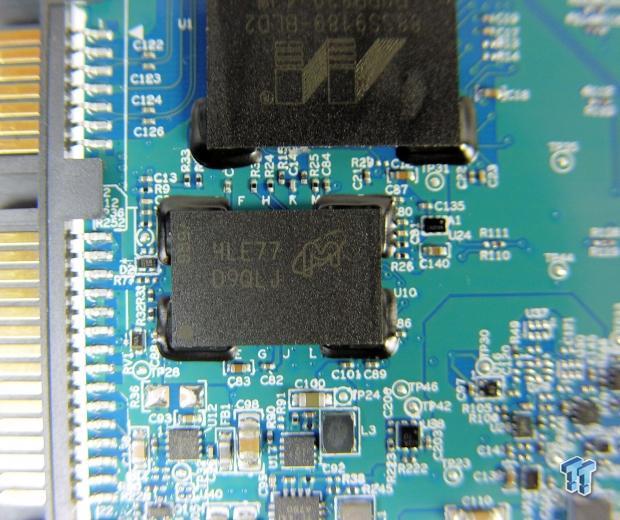
The DRAM buffer is from Micron.

Although not much to look at, since it looks like other flash packages, this is SanDisk's new X3 TLC flash.
Test System Setup and ATTO Baseline Performance
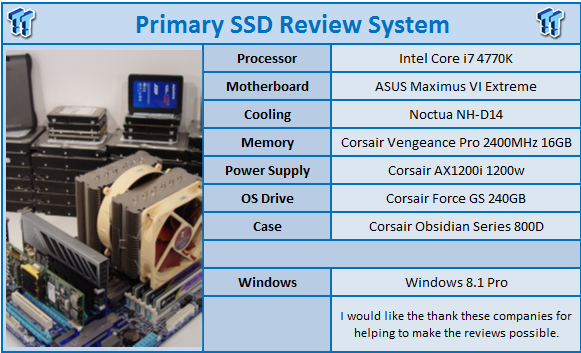
Desktop Test System
Lenovo T440 - Notebook Power Testing with DEVSLP and Windows 8.1 Pro
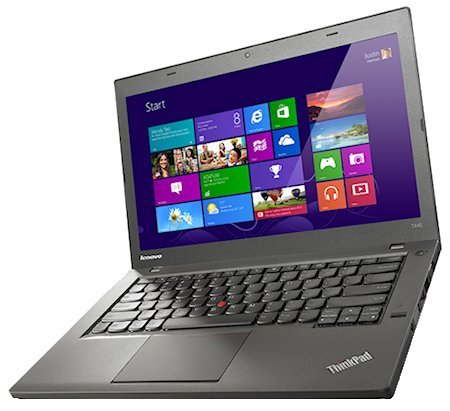
Nearly all of the performance tests run on the desktop system, but we use a Lenovo T440 to run the power tests. The T440 is the latest addition to our client SSD test lab, and allows us to test the notebook battery life offered by a SSD with advanced features like DEVSLP enabled.
ATTO - Baseline Performance
Version and / or Patch Used: 2.34
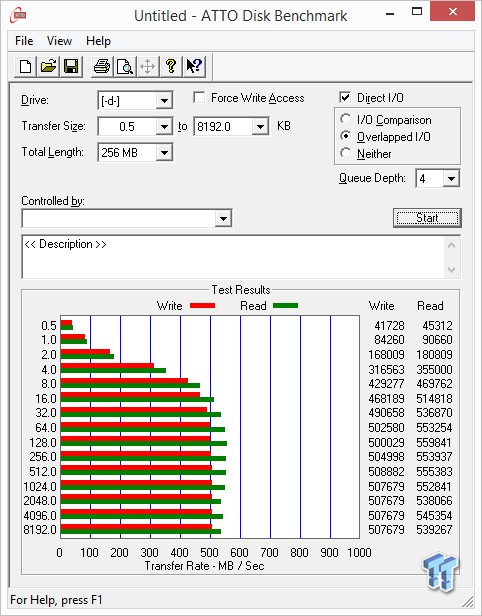
ATTO served up a deep dish of performance data that peaked at 509 MB/s writes, and 555 MB/s reads. These results are a bit higher than SanDisk's specification numbers.
Benchmarks - Sequential Performance
HD Tune Pro - Sequential Performance
Version and / or Patch Used: 5.50
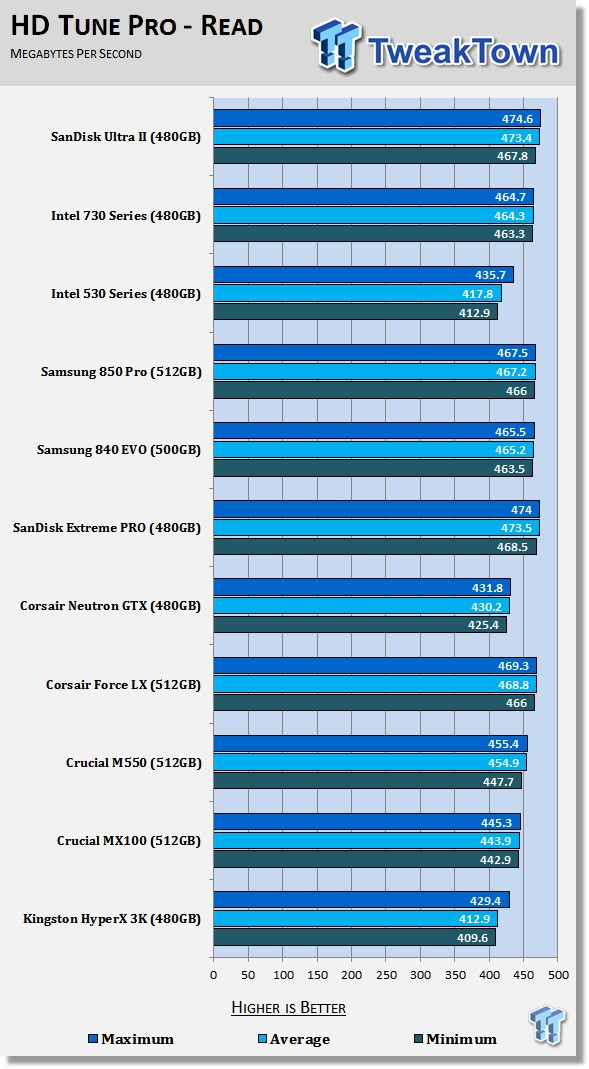
Reading across the entire user available span of the Ultra II 480GB gave us an average speed of 473.4 MB/s. The only other drive on our chart that is faster in this test is the SanDisk Extreme PRO, SanDisk's flagship consumer SSD.
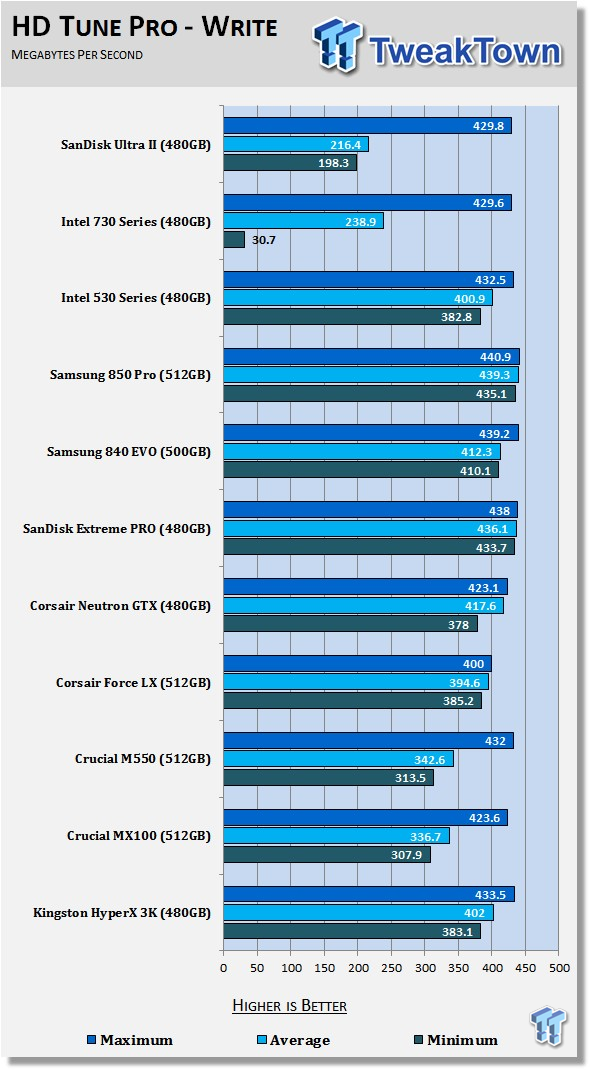
The Ultra II's SLC layer gives us a sequential write performance boost for a small slice of this test. Sequential write performance quickly drops down to TLC levels, around 200 MB/s with 64KB data.
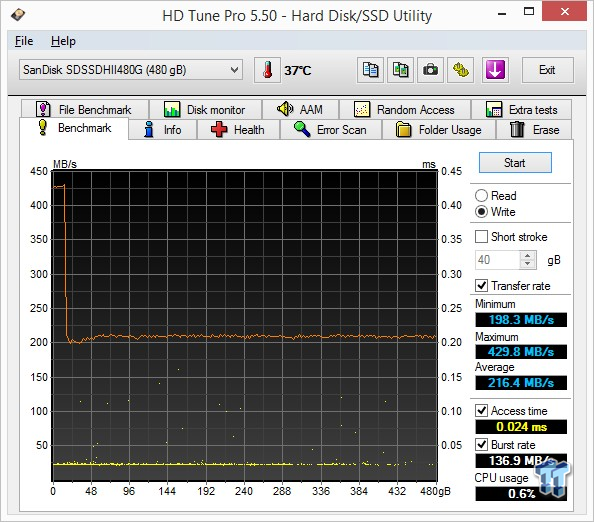
Here we see the actual test, and can spot how far into the test the performance dips. Even though the SLC area can write at 430 MB/s, when it has to dump the data down to TLC, the writes slow to just over 200 MB/s.
HD Tach - Sequential Write Performance after Random Writes
Version and / or Patch Used: 3.0.4.0
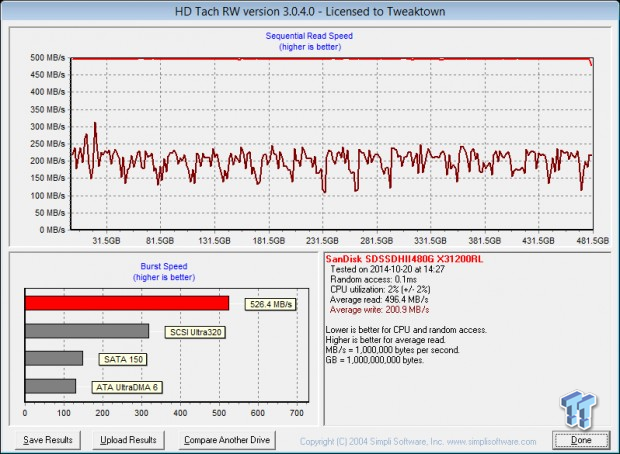
After writing to the full span of the drive with sequential data, and then a handful of random data write bursts, we run HD Tach to see what real-world, light workload sequential performance is like. The Ultra II 480GB has a few drops to roughly 110 MB/s, but for the most part, performance stays above 150MB/s and averages 200.9 MB/s.
Benchmarks - Anvil Storage Utilities
Anvil Storage Utilities
Version and / or Patch Used: RC6
So, what is Anvil Storage Utilities? Well, it's a storage benchmark for SSDs and HDDs where you can check and monitor your performance. The Standard Storage Benchmark performs a series of tests; you can run a full test, or just the read or the write test, or you can run a single test, i.e. 4k QD16.
Anvil Storage Utilities is not officially available yet, but we've been playing with the beta for several months now. Anvil has been updating the software steadily on several international forums, and is adding new features every couple of months.
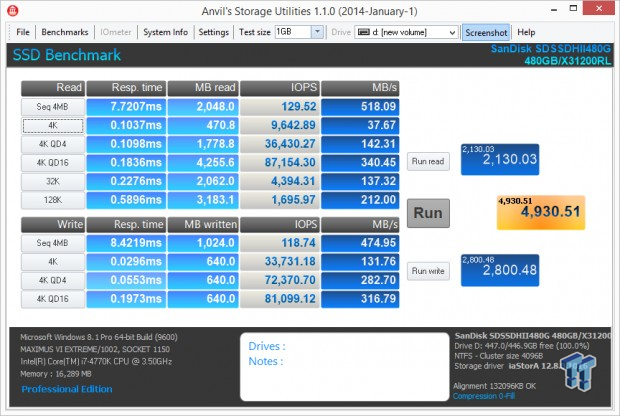
We can use Anvil several different ways to show different aspects for each drive. We've chosen to use this software to show the performance of a drive with two different data sets. The first is with compressible data, and the second data set is incompressible data. Several users have requested this data in our SSD reviews.
0-Fill Compressible Data
Incompressible Data
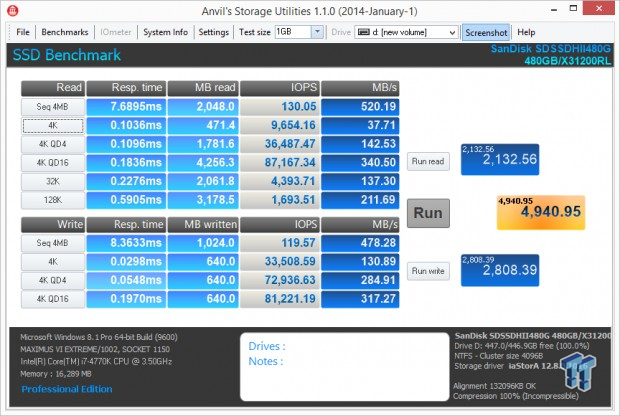
The SanDisk Ultra II actually delivered a little higher performance with incompressible data. This is a nice change from having significant performance loss with incompressible data.
Low Queue Depth Read IOPS
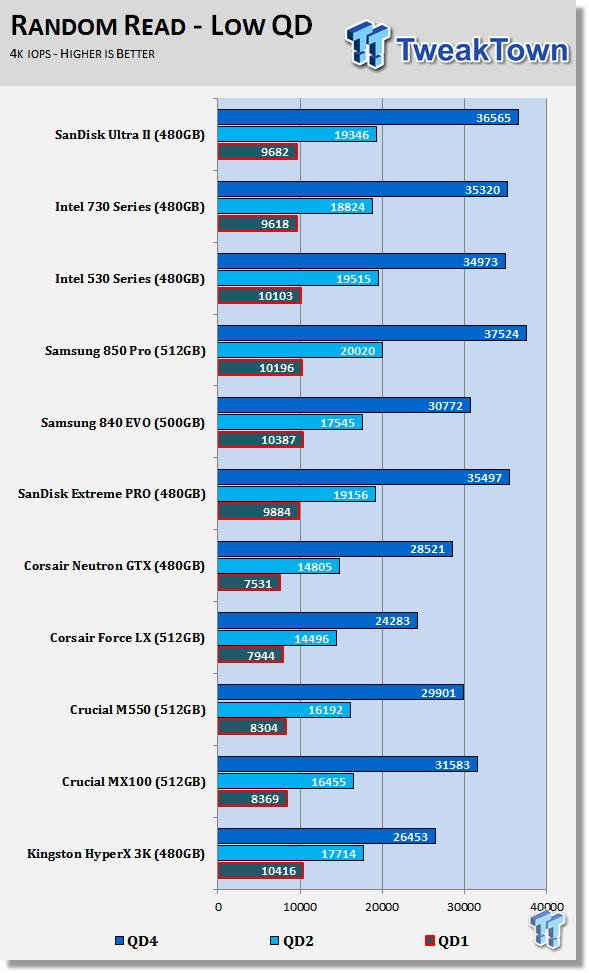
The Ultra II 480GB scales well in our random read test that doubles queue depth with each test. The drive still doesn't meet the same 10K IOPS QD1 mark of the Samsung 840 EVO though.
High Queue Depth Read IOPS
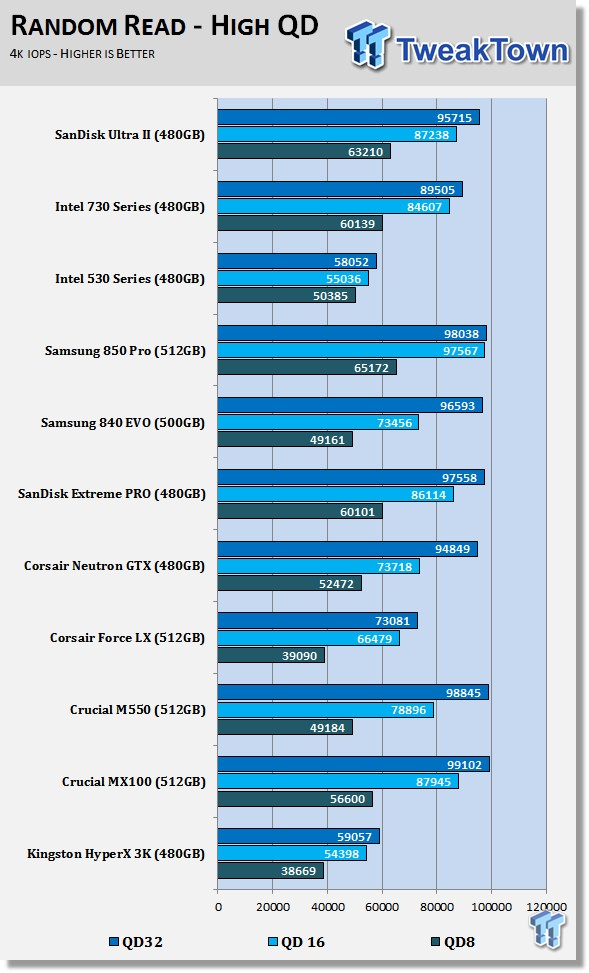
Most of us will never actually get to high random read queue depths, but if you manage to pull it off, the SanDisk Ultra II can deliver 95K IOPS at QD32.
Low Queue Depth Write IOPS
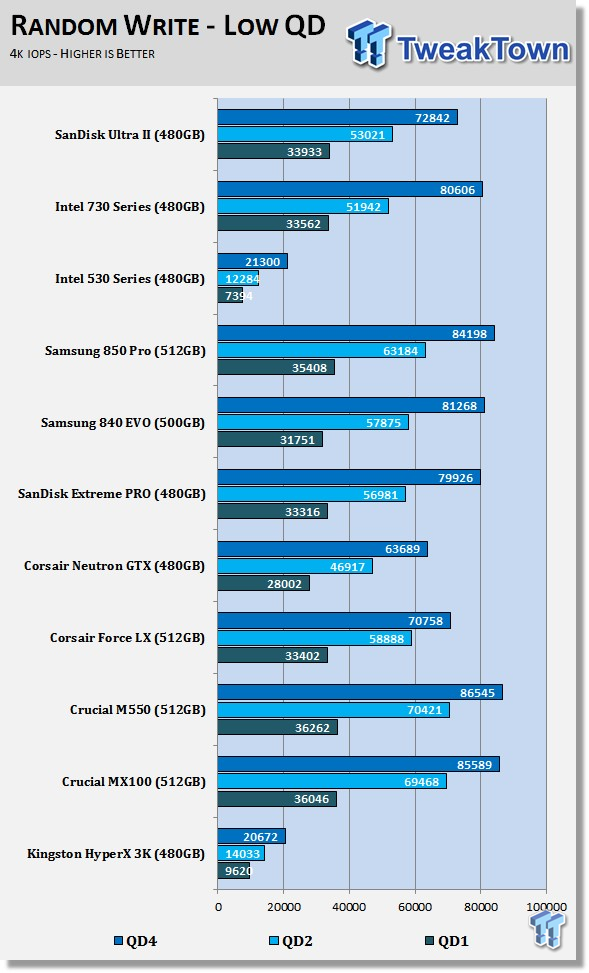
The Ultra II 480GB does really well writing random 4K data thanks to the SLC buffer.
High Queue Depth Write IOPS
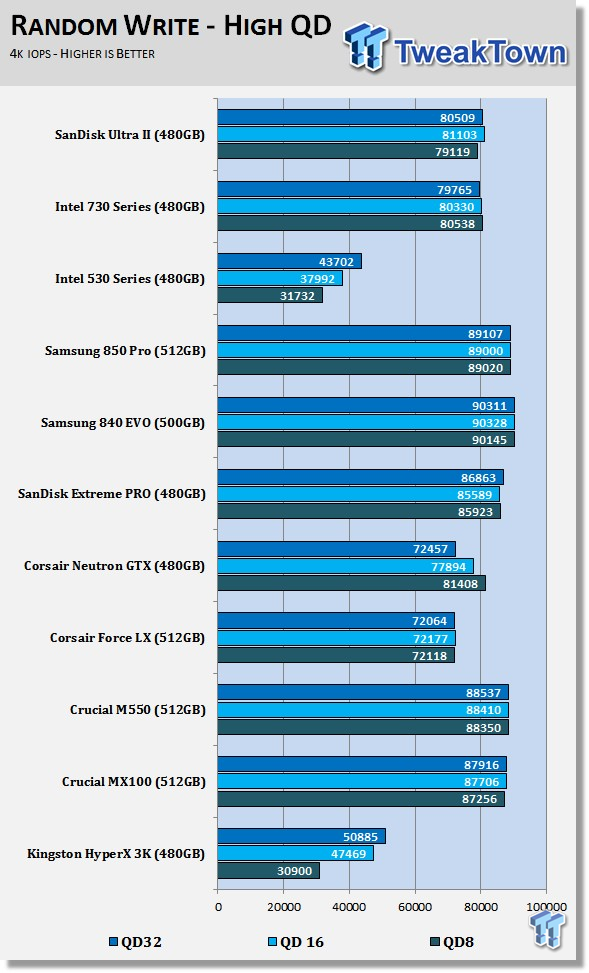
Up top, the Ultra II 480GB hits just over 81K IOPS at QD16.
Benchmarks - Mixed Read / Write Workloads
Sequential Mixed Read / Write Workloads
In this series of tests, we measure mixed workload performance. We start with 100% read, and then add data writes to the mix in 10% increments until we get to 100% writes. We believe this will be the next major area SSD manufacturers will address after performance consistency.
Sequential Mixed Workload Bandwidth
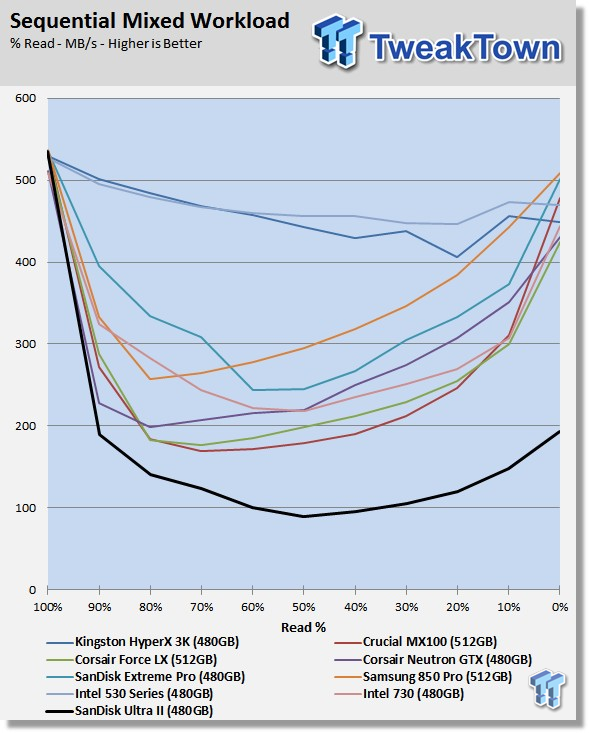
Our heavy use sequential mixed workload test has been brutal on consumer SSDs, but the Ultra II takes this to a new level. This test gets into steady state before measuring mixed read and write levels.
Sequential 80% Read / 20% Write Bandwidth
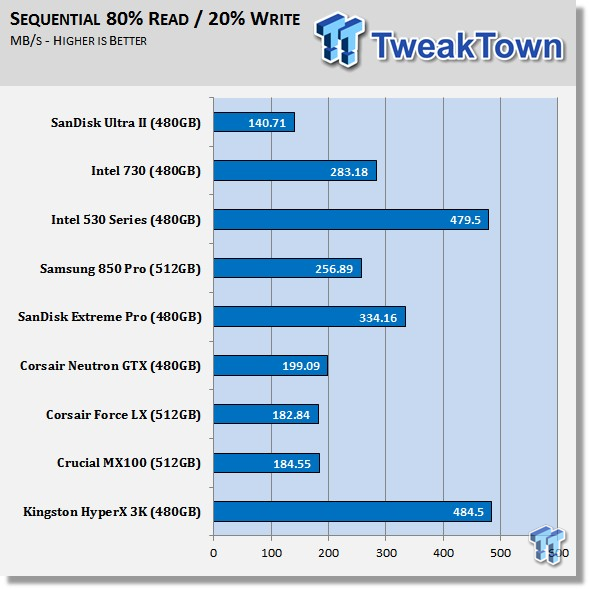
Using the 80% read / 20% write as a marker for typical consumer loads, the Ultra II delivers 140 MB/s, the lowest result in this set of tests.
Random Mixed Workload Response Time
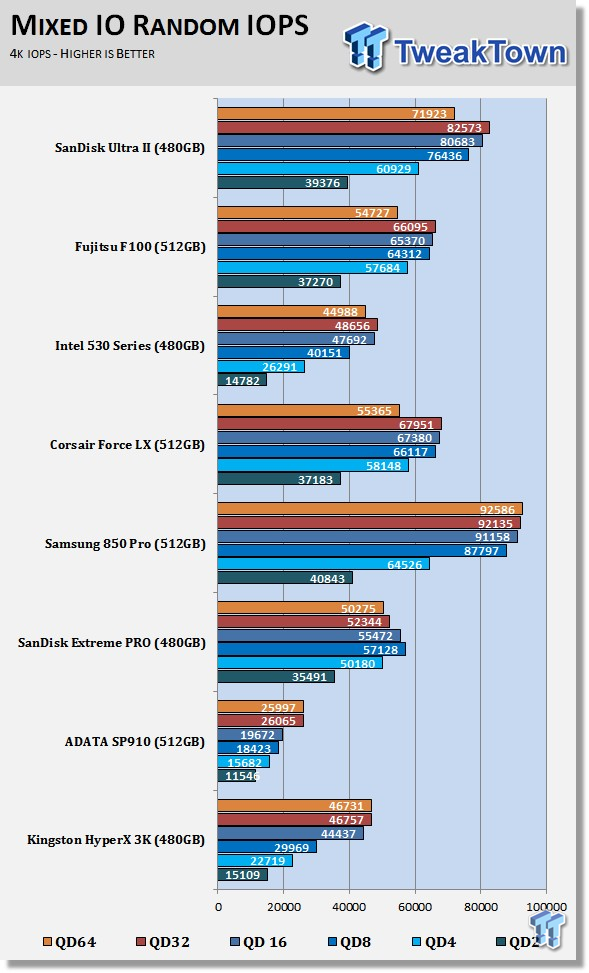
In this test, we mix random reads and writes, but scale by queue depth. The Ultra II 480GB does very well here, even better than the flagship Extreme PRO.
PCMark 8 Consistency Test
Futuremark PCMark 8 Extended - Consistency Test
Version and / or Patch Used: 2.0.228
Heavy Usage Model:
Futuremark's PCMark 8 allows us to wear the test drive down to a reasonable consumer steady state and then watch the drive recover on its own through garbage collection. To do that, the drive gets pushed down to steady state with random writes and then idle time between a number of tests allows the drive to recover.
Precondition Phase:
1. Write to the drive sequentially through up to the reported capacity with random data.
2. Write the drive through a second time (to take care of overprovisioning).
Degradation Phase:
1. Run writes of random size between 8*512 and 2048*512 bytes on random offsets for ten minutes.
2. Run performance test (one pass only).
3. Repeat one and two, eight times, and on each pass, increase the duration of random writes by five minutes.
Steady state Phase:
1. Run writes of random size between 8*512 and 2048*512 bytes on random offsets for 50 minutes.
2. Run performance test (one pass only).
3. Repeat one and two, five times.
Recovery Phase:
1. Idle for five minutes.
2. Run performance test (one pass only).
3. Repeat one and two, five times.
Storage Bandwidth All Tests
PCMark 8's Consistency test provides a ton of data output that we use to judge a drive's performance. Here we see the three states of performance for the select SSDs, light use, consumer steady state and worst case.
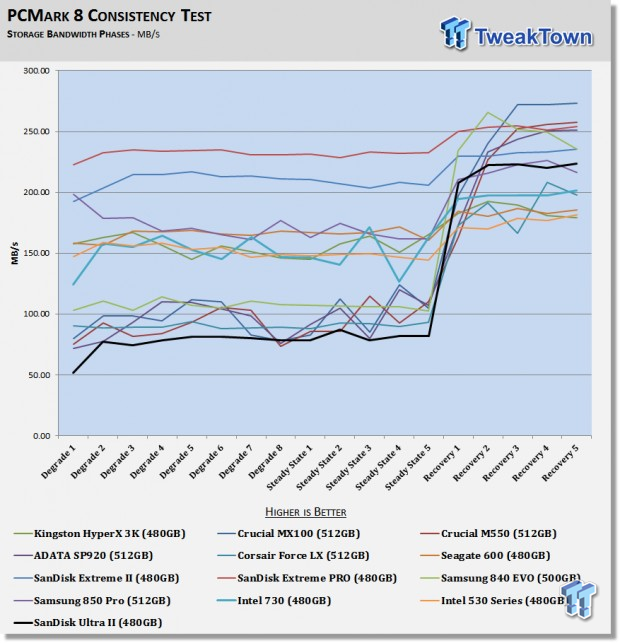
We've changed this section up a bit from our previous review. Here we see the full test with the degrade sections first, then the steady state, and finally the recovery phases. Under heavy use, the Ultra II 480GB is the slowest drive on the chart, but a majority of our readers will never get a SSD into this condition.
Typical Consumer Workloads

This is the recovery section of the test, the area where most consumer workloads run, and the area we typically see consumer SSDs win. The Ultra II 480GB runs in the middle of the pack, and is faster than half of the drives on the chart.
Consumer Throughput Breakdown
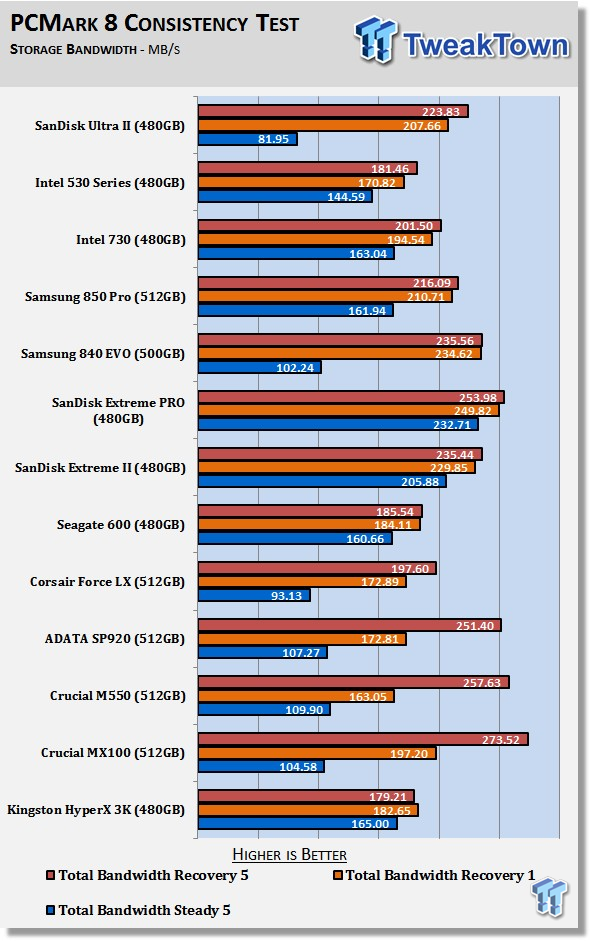
Here we see the breakdown in a different format. Most of us should consider the orange and red bars as typical usage, and the blue bar as a heavy use scenario that we may get to just a few times in the SSDs lifespan.
PCMark 8 Consistency Test - Continued
Total Access Time
The access time test measures the total latency across all 18 tests. This is one of, if not the most important test we run at this time for consumer SSDs. When your latency is low, your computer feels fast; it's just that simple.
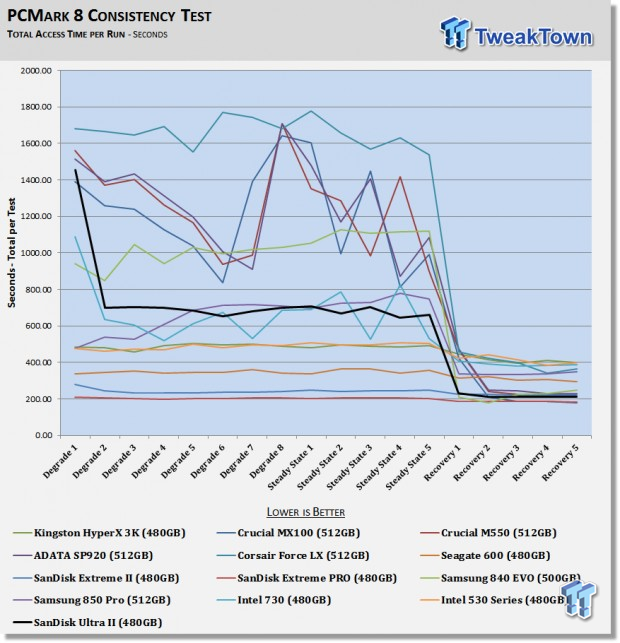
Here we see the same tests but the chart shows latency. The lower the latency, the better the user experience.
Typical Consumer Latency
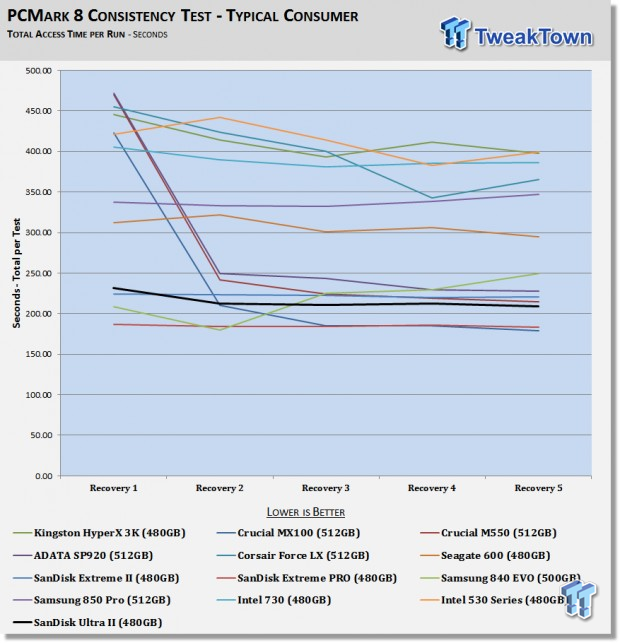
The results change quite a bit here, and the Ultra II produces a better user experience than nearly all of the drives on the chart.
Benchmarks - Power Testing
Bapco MobileMark 2012 1.5
Version and / or Patch Used: 2012 1.5
Developer Homepage: http://www.bapco.com
Test Homepage: http://www.bapco.com
MobileMark 2012 1.5 is an application-based benchmark that reflects usage patterns of business users in the areas of office productivity, media creation, and media consumption. Unlike benchmarks that only measure battery life, MobileMark 2012 measures battery life and performance simultaneously, showing how well a system design addresses the inherent tradeoffs between performance and power management.
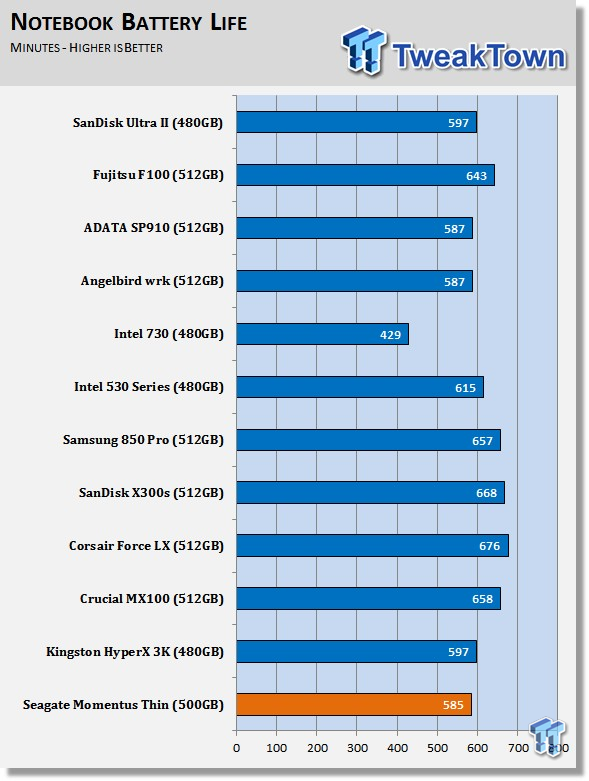
The Ultra II 480GB delivered 587 minutes of battery usage in our MobileMark 2012 1.5 test. We expected the Ultra II to deliver X300s like times, but the drive fell well short of the mark set by SanDisk's business notebook drive with hardware encryption.
Power Limited Performance
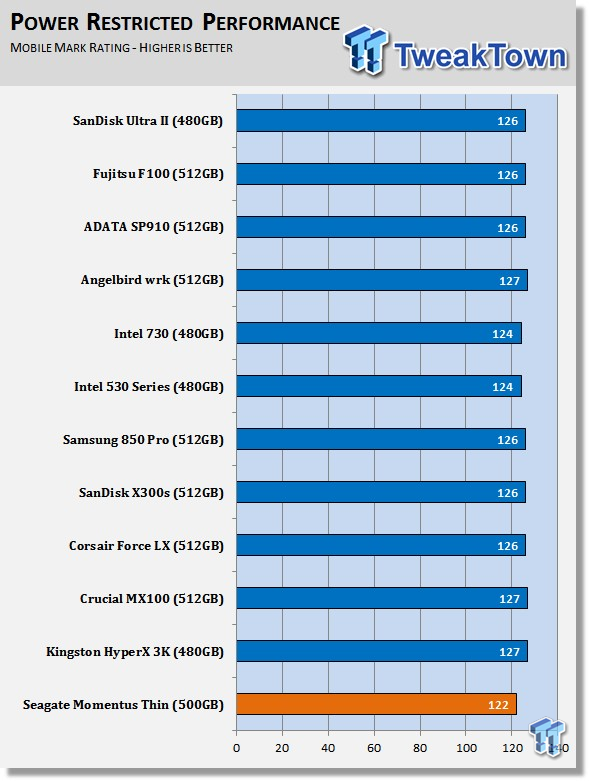
The Ultra II 480GB falls in line with most of the other drives on the chart when it comes to performance in a power-restricted state.
Final Thoughts

SanDisk doesn't include a lot of accessories in the retail package, but the Dashboard software should be a consideration when choosing a low cost, high-capacity SSD. The Crucial MX100 gets a lot of attention at this price point, but SanDisk has included several features in Dashboard that lead us to favor the Ultra II over several models in this low price market.
The benchmark performance adds another nod to the Ultra II 480GB. The MX100, 840 EVO, and a handful of the other value focused SSDs do better in some tests, but the high random performance and superior latency results again point us to the Ultra II.
We would like to see SanDisk lower the price of the Ultra II 480GB model a bit. It's not like $209.99 is a bad price for SanDisk's first X3 technology product, but TLC flash produced from a NAND flash manufacturer should cost less than MLC products from non-flash producing companies.
That's really the sticking point that we need to examine when purchasing a SSD. Right now, products like the PNY Optimus with 20nm MLC cost a bit less than the Ultra II. SanDisk released the Ultra II with TLC a little too soon. Eventually, TLC will dominate the consumer SSD market, but right now, MLC is still widely available in 20nm lithography. The 16nm MLC doesn't offer much of an advantage to consumers over 1Ynm TLC. SanDisk's Ultra II will look much better in the future when other products move to 16nm MLC flash or TLC.
Right now, if you need very low cost flash in a higher capacity, the SanDisk Ultra II is a good option. Power users and enthusiasts may want to look at products that provide a better experience under heavy workloads though.
PRICING: You can find the SanDisk Ultra II SSD for sale below. The prices listed are valid at the time of writing, but can change at any time. Click the link to see the very latest pricing for the best deal.
United States: The SanDisk Ultra II 120GB retails for $69.99 at Amazon, the SanDisk Ultra II 240GB retails for $114.99 at Amazon, the SanDisk Ultra II 480GB retails for $209.00 at Amazon, and the SanDisk Ultra II 960GB retails for $419.00 at Amazon.
Canada: The SanDisk Ultra II 120GB retails for CDN$93.36 at Amazon Canada, the SanDisk Ultra II 240GB retails for CDN$129.99 at Amazon Canada, the SanDisk Ultra II 480GB retails for CDN$267.97 at Amazon Canada and the SanDisk Ultra II 960GB retails for CDN$504.12 at Amazon Canada.
