
Introduction
Seagate has announced their third generation of SSD's; ranging from a consumer model, the Seagate 600, all the way up to a PCIe accelerator. The refresh of their enterprise SSD models includes the dual-port 12GB/s SAS Seagate 1200 and the entry-level Seagate 600 Pro.
The Seagate 600 Pro is designed to target the entry-level enterprise SATA SSD market, in particular hyperscale datacenters and cloud applications. Seagate foresees the 600 Pro also gaining traction as an enthusiast model for the client space.
Seagate has a deep understanding of the datacenter, they produce eight new HDD's per second, and churned out over a billion HDD's in the last four years alone. Unbelievably, that is more than 680,000 HDD's per day. Many of these HDD's head into datacenters, and Seagate has leveraged this understanding of OEM storage solutions and power efficiency to shape their new line of enterprise SSD products.
The Seagate 600 Pro features the LAMD LM87800AA controller also utilized in client SSD's. Seagate has built a history of collaboration with Link_A_Media (LAMD) during their initial foray into the SSD market with the Seagate Pulsar series. The LAMD controllers were actually designed in conjunction with Seagate. In the past Seagate even provided Series B financing for LAMD. SK Hynix has since purchased LAMD, but the bond between Seagate and LAMD remains strong.
This provides Seagate with broad experience with the LAMD LM87800 controller. Leveraging Seagate's own firmware allows them to tune the controller for enterprise use. Seagate has an expansive, and growing, patent portfolio that includes many technologies that translate well to SSD design, including multi-layered error recovery technology with advanced error detection and correction encoding.
The intense qualification cycles and rigorous interoperability testing delivers a quality product that will mesh well with any environment. The 400GB Seagate 600 Pro features sustained sequential read/write speeds of 520/450MB/s, and random read/write performance of 85,000/30,000 IOPS (in the capacities points with extra overprovisioning).
The 400 GB version of the SSD sports an endurance rating of 1080TBW, compared to 350TBW of endurance with the 480GB model. The extra overprovisioning also brings random write performance up from 11,000 IOPS to 30,000 IOPS at this capacity point. The gamut of available capacities provides administrators with a scalable configuration with preconfigured amounts of overprovisioning to suit their workload.
The Seagate 600 Pro also features tantalum power capacitors and a design optimized to deliver best-in-class performance efficiency, lowering the overall TCO of the storage solution. The continuing push from the HDD juggernaut into the SSD market aims to bring low-cost, yet powerful, solutions to market as part of their expansive portfolio of storage options.
Seagate Pro 600 Specifications
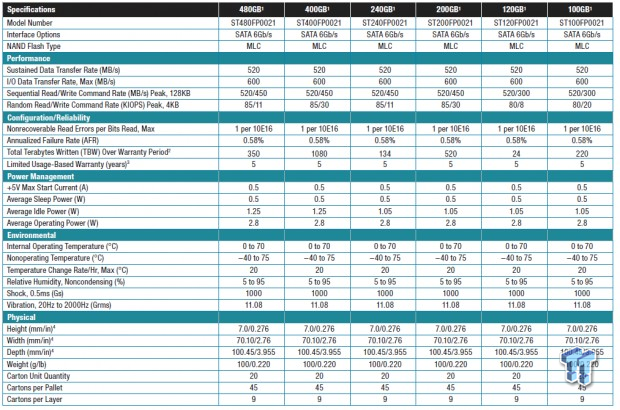
A big focus of the Seagate 600 Pro is efficiency. The 600 Pro claims one of the best IOPS-to-Watts ratios for this class of SSD, and we have just the testing methods to double check the veracity of these claims. The low power performance optimizations are due in part to advanced dynamic power adjusting algorithms. This reduces power consumption in light workloads and continually adjusts the power consumption based upon workload.
The Seagate 600 Pro is powered by 19nm Type C Toshiba Toggle MLC NAND in conjunction with the LAMD Amber LM87800 controller.
The Seagate 600 Pro has an unrecoverable bit error rate (UBER) of 1 per 10E16. This is on par with other enterprise SSD's in this market segment.
The Seagate 600 Pro also utilizes tantalum capacitors to mitigate host power-loss issues. The 600 Pro SSD features 512MB of DDR2-800 DRAM cache for LBA mapping purposes.
There are a number of available capacities and endurance points, providing a scalable solution for users.
Seagate Pro 600 Internals
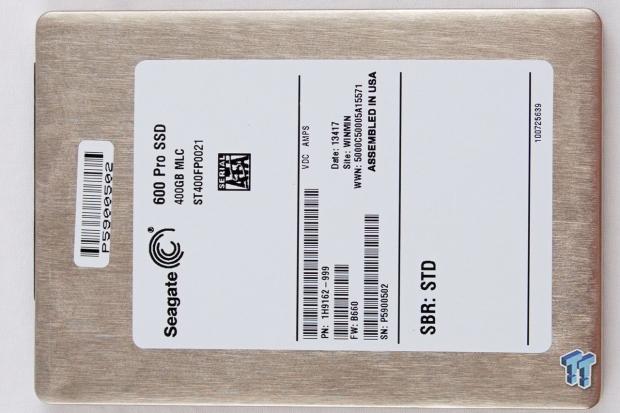
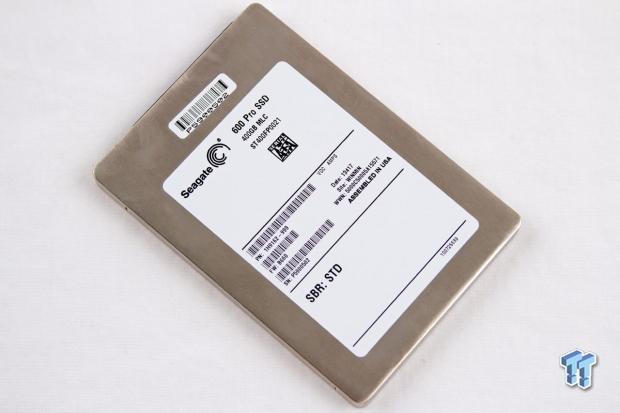
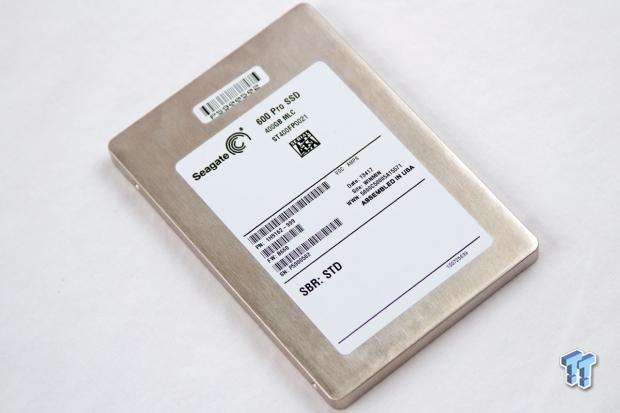
The Seagate 600 Pro comes in a very sturdy metallic casing, and has a comprehensive anti-intrusion system that makes it nearly impossible to open the SSD without destroying the case.
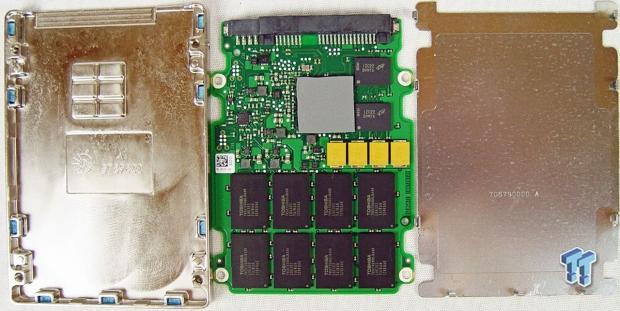
We observe the four yellow tantalum caps underneath the controller, which comes with a thick thermal pad. These provide enough power to flush the DRAM cache and commit all data in-flight down to the NAND.
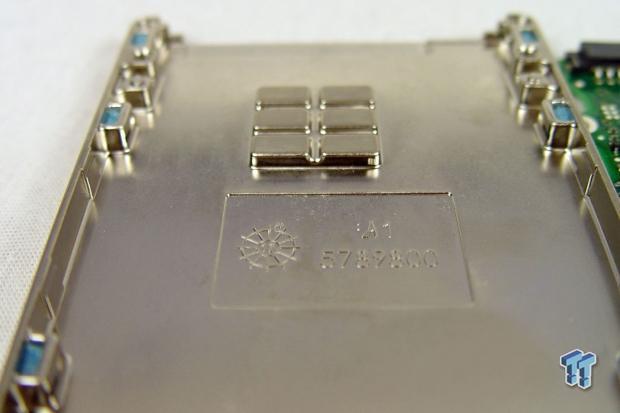
Six metal blocks rise up from the case to rest on the thermal pad and controller, allowing for easy heat dissipation into the thick metallic casing. This provides the SSD with a longer lifespan in high-heat scenarios.
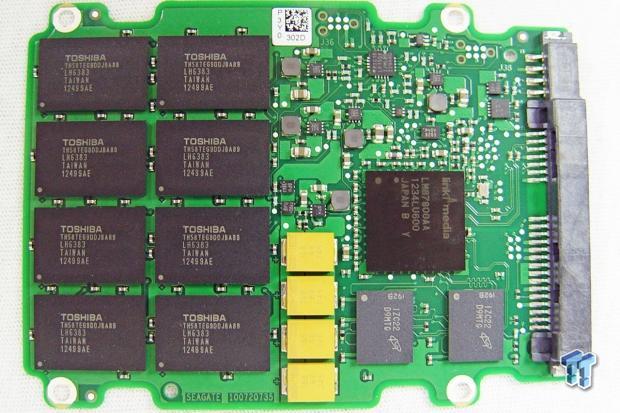
The Seagate 600 Pro has eight packages of Type C Toshiba 19nm MLC NAND. These are 64GB packages with 16K page sizes. Two Micron DRAM chips totaling 512MB of capacity flank the LAMD LM87800 controller.
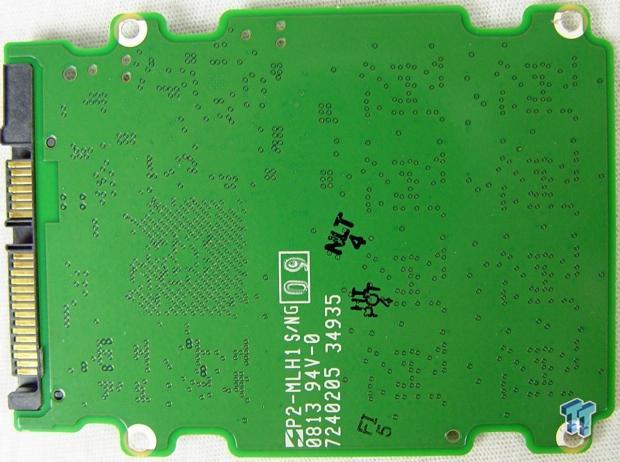
The back of the PCB is unremarkable with absolutely no components.
Test System and Methodology
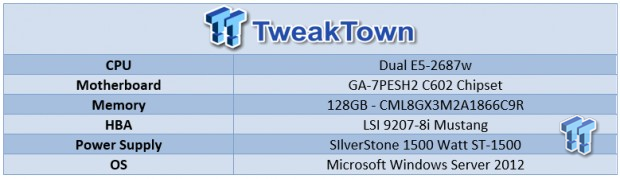
We utilize a new approach to HDD and SSD storage testing for our Enterprise Test Bench, designed specifically to target long-term performance with a high level of granularity.
Many testing methods record peak and average measurements during the test period. These average values give a basic understanding of performance, but fall short in providing the clearest view possible of I/O QoS (Quality of Service).
Average' results do little to indicate the performance variability experienced during actual deployment. The degree of variability is especially pertinent, as many applications can hang or lag as they wait for I/O requests to complete. This testing methodology illustrates performance variability, and includes average measurements, during the measurement window.
While under load, all storage solutions deliver variable levels of performance. While this fluctuation is normal, the degree of variability is what separates enterprise storage solutions from typical client-side hardware. Providing ongoing measurements from our workloads with one-second reporting intervals illustrates product differentiation in relation to I/O QOS. Scatter charts give readers a basic understanding of I/O latency distribution without directly observing numerous graphs.
Consistent latency is the goal of every storage solution, and measurements such as Maximum Latency only illuminate the single longest I/O received during testing. This can be misleading, as a single 'outlying I/O' can skew the view of an otherwise superb solution. Standard Deviation measurements consider latency distribution, but do not always effectively illustrate I/O distribution with enough granularity to provide a clear picture of system performance. We use histograms to illuminate the latency of every single I/O issued during our test runs.
Our testing regimen follows SNIA principles to ensure consistent, repeatable testing. We attain steady state through a process that brings the device within a performance level that does not range more than 20% during the measurement window. Forcing the device to perform a read-write-modify procedure for new I/O triggers all garbage collection and housekeeping algorithms, highlighting the real performance of the solution.
We measure power consumption during precondition runs. This provides measurements in time-based fashion, with results every second, to illuminate the behavior of power consumption in steady state conditions. Power consumption can cost more over the life of the device than the initial acquisition price of the hardware itself. This significantly affects the TCO of the storage solution and we also present IOPS-to-Watts measurements to highlight the efficiency of the storage solution.
Our test pool features SSD's of varying capacity, so it is important to bear this in mind when viewing results. The first page of results will provide the 'key' to understanding and interpreting our new test methodology.
4K Random Read/Write

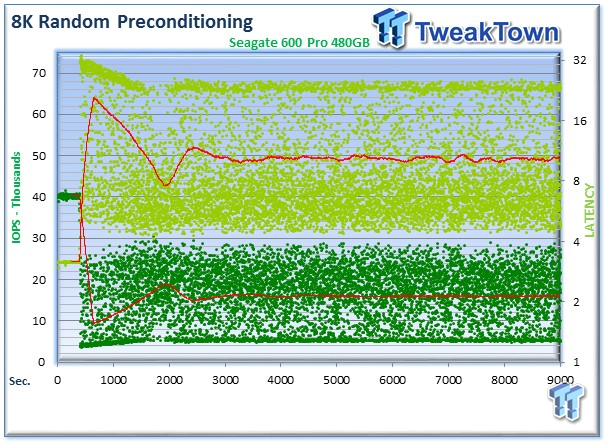
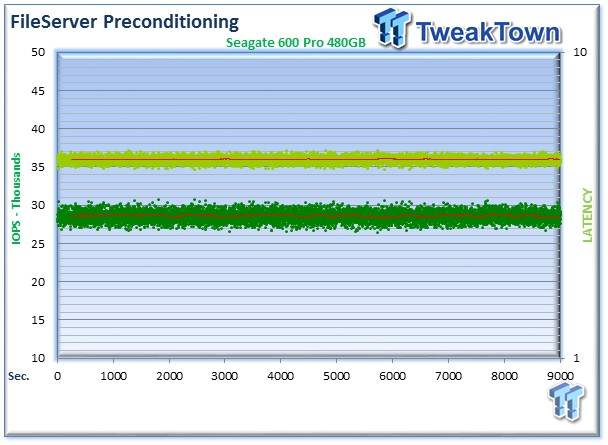
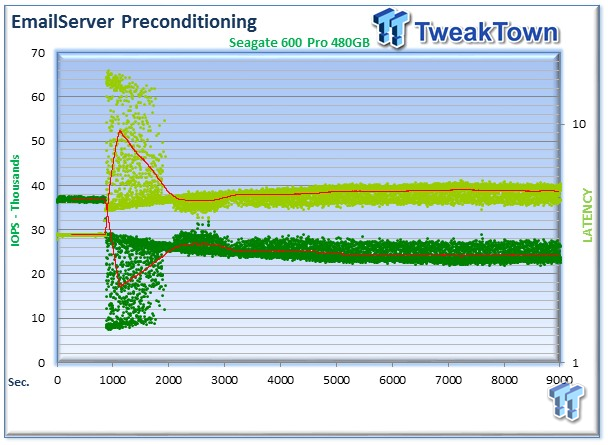
We precondition the Seagate 600 Pro for 18,000 seconds, or five hours, receiving reports on several parameters of workload performance every second. We then plot this data to illustrate the drives' descent into steady state. Please refer to the previous page for a note on data compressibility.
This chart consists of 36,000 data points. This is a dual-axis chart with the IOPS on the left and the latency on the right. The dark green dots signify IOPS during the test, and the light green dots indicate latency measurements during the test period. We place latency data in a logarithmic scale to bring it into comparison range. The lines through the data scatter are the average during the test. This type of testing presents standard deviation and maximum/minimum I/O in a visual manner.
Note that the IOPS and Latency figures are nearly mirror images of each other. This illustrates the point that high-granularity testing can give our readers a good feel for the latency distribution by viewing IOPS at one-second intervals. This should be in mind when viewing our test results below.
We provide histograms for further latency granularity below. This downward slope of performance happens very few times in the lifetime of the device, typically during the first few hours of use, and we present the precondition results only to confirm steady state convergence.
Each QD for every parameter tested includes 300 data points (five minutes of one second reports) to illustrate the degree of performance variability. The line for each QD represents the average speed reported during the five-minute interval.
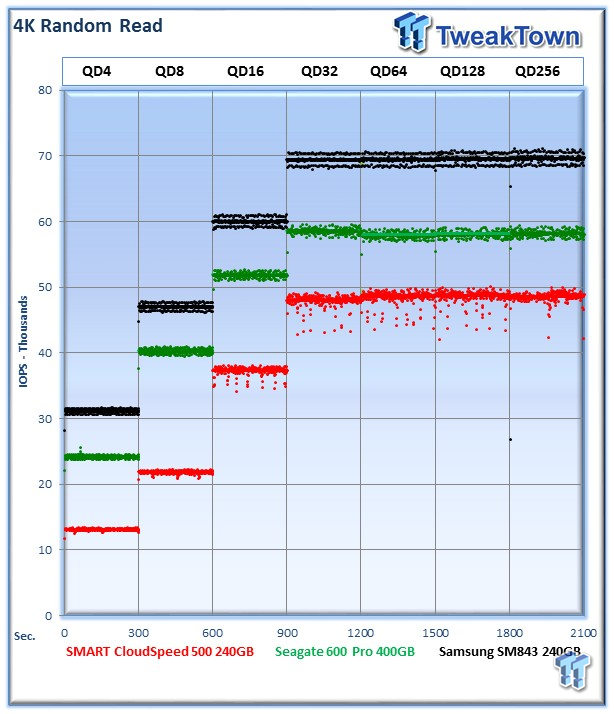
4K random speed measurements are an important metric when comparing drive performance, as the hardest type of file access for any storage solution to master is small-file random. One of the most sought-after performance measurements, 4K random performance is a heavily marketed figure.
The Seagate Pro 600 SSD averages 58,253 IOPS at QD256, placing it between the CloudSpeed 500 and the Samsung SM843.
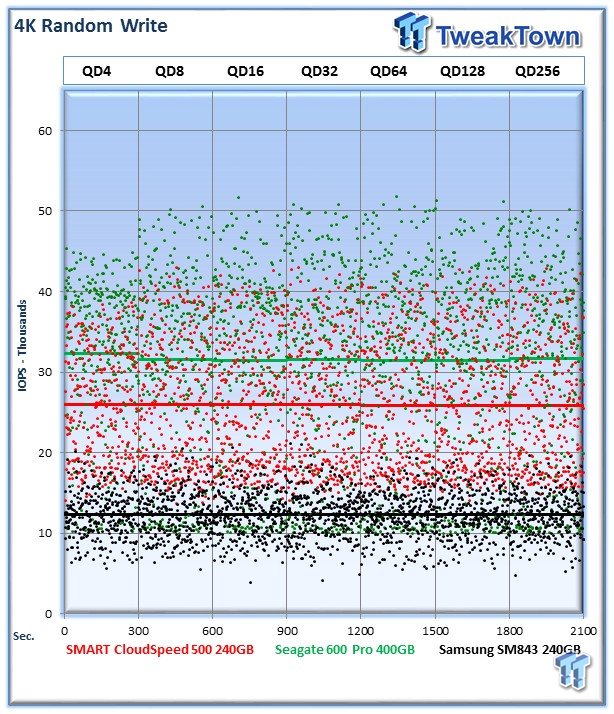
Garbage collection routines are more pronounced in heavy write workloads. This leads to more variability in performance. The Seagate 600 Pro has the highest average 4K random write speed, coming in at 31,636 IOPS at QD256. Both the CloudSpeed 500 and the 600 Pro exhibit significant performance variability, but in the entry-level tier of SSD's aimed at read-centric workloads, this is expected behavior. The SM843 has a much tighter latency range, but suffers from significantly lower average write speeds.
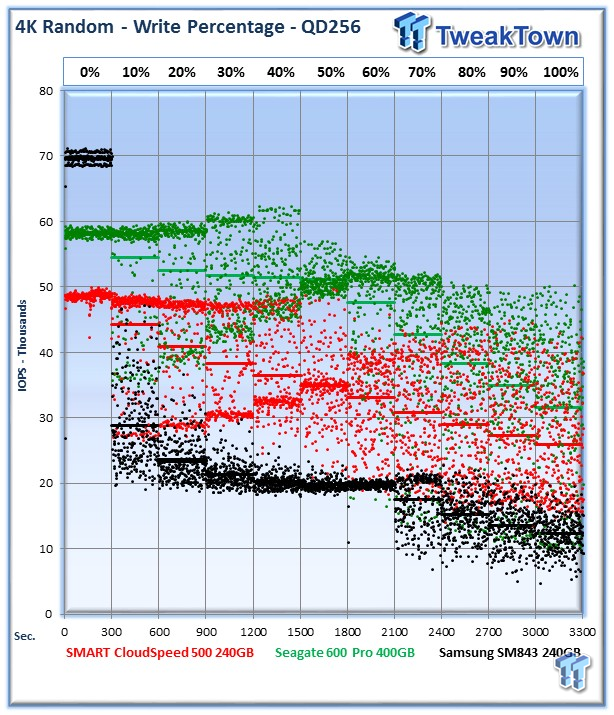
Our write percentage testing illustrates the varying performance of each solution with mixed workloads. The 100% column to the right is a pure write workload of the 4K file size, and 0% represents a pure 4K read workload.
The Seagate 600 Pro proves more resilient to mixed workloads with a tighter performance range than the CloudSpeed 500 as we mix in more write activity. The SM843 again exhibits a nice tight performance range. Unfortunately, this falls in at under half the speed of the Seagate 600 Pro.
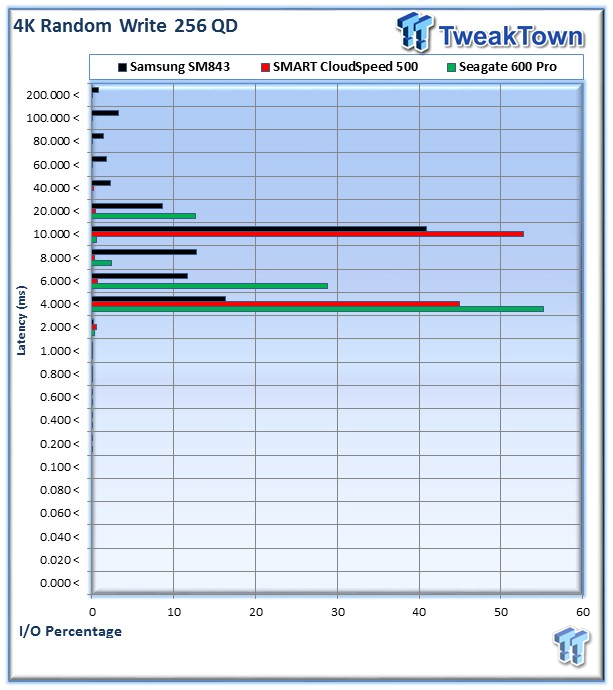
The Seagate 600 Pro's great 4K write performance reflects in the latency histogram, with 5,211,437 I/Os (55%) delivered at 4-6ms, 2,719,100 I/Os (28.7%) at 6-8ms, and 1,191,102 I/Os (12.6%) in the 20-40ms range.
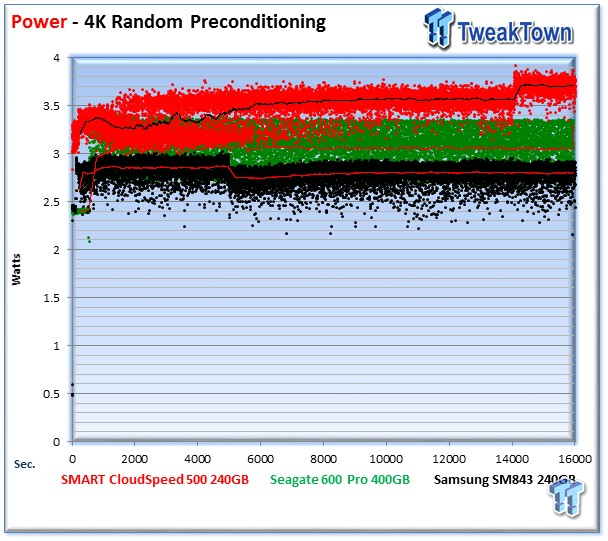
We record the power consumption measurements during our precondition run. We calculate the stated average results during the last five minutes of the test, after the device has settled into steady state.
The Seagate 600 Pro is in the middle of the pack with an average of 3.43 Watts during the measurement window.
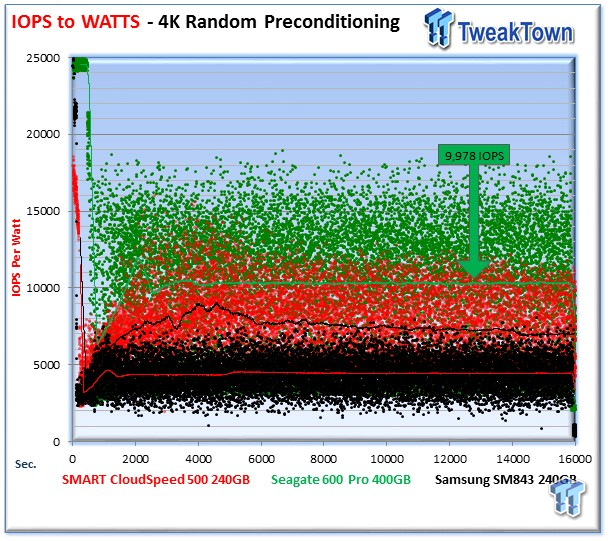
IOPS to Watts measurements are generated from data recorded during our precondition run, and the stated average is from the last five minutes of the test.
The Seagate 600 Pro delivers big in the efficiency test, with an average of 9,978 IOPS per Watt during the measurement window.
8K Random Read/Write
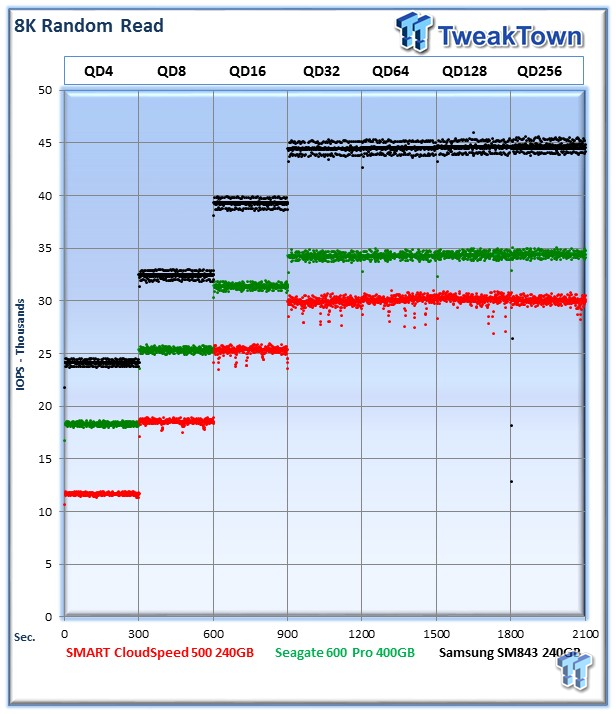
8K random read and write speed is a metric that is not tested for consumer use, but for enterprise environments this is an important aspect of performance. With several different workloads relying heavily upon 8K performance, we include this as a standard with each evaluation. Many of our Server Emulations below will also test 8K performance with various mixed read/write workloads.
The Seagate 600 Pro falls into the midrange between the superb read performance of the SM843 and the CloudSpeed 500. The Seagate 600 Pro averages 34,467 IOPS at QD256.
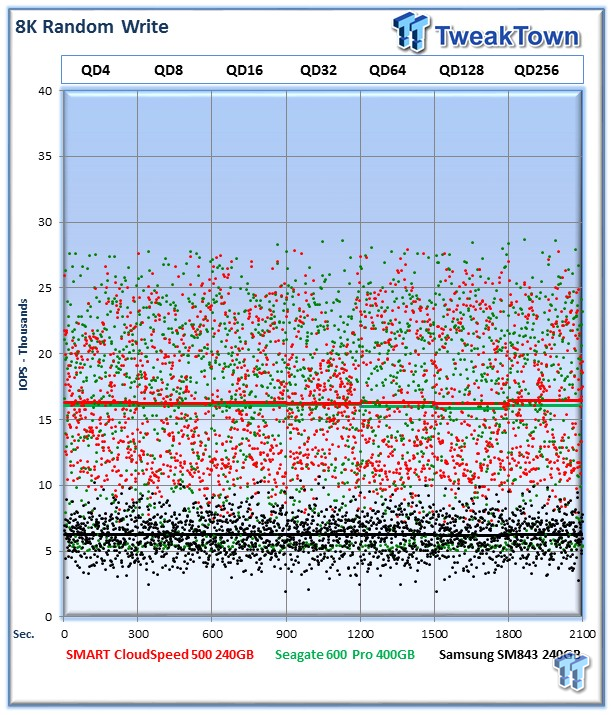
The Seagate 600 Pro and the CloudSpeed 500 trade blows in the 8K random write testing, with very close average speeds and similar write distribution. The Seagate Pro 600 comes in just below the CloudSpeed 500 with an average of 16,053 IOPS at QD 256.
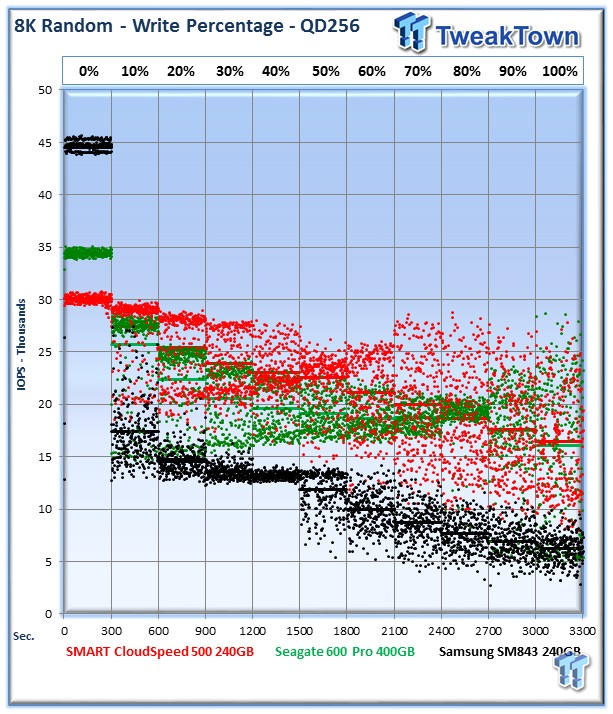
The Seagate Pro 600 performs well in the mixed read/write testing, with an average slightly lower than the CloudSpeed 500 in the heavier mixed workloads.
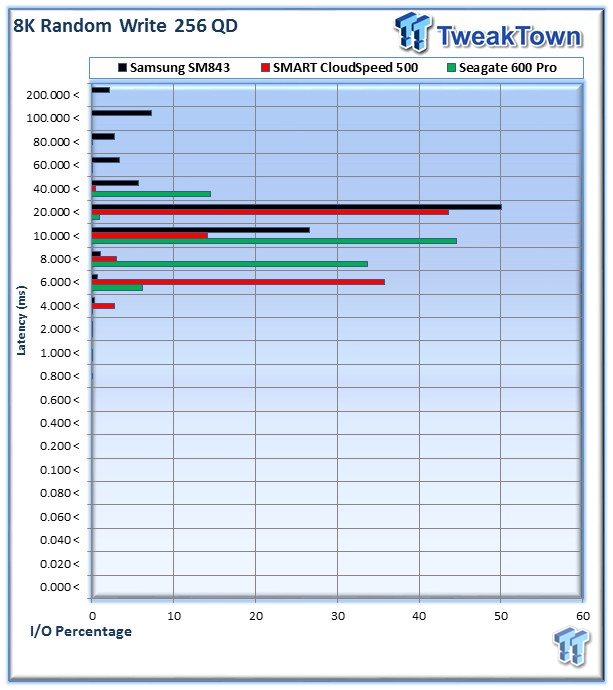
The Seagate 600 Pro has a wide range of latency distribution in this test, with 3,131,077 I/Os (44%) at 10-20ms, 1,614,008 I/Os (33.7%) at 8-10ms, and 693,221 I/Os (14.4%) at 40-60ms.
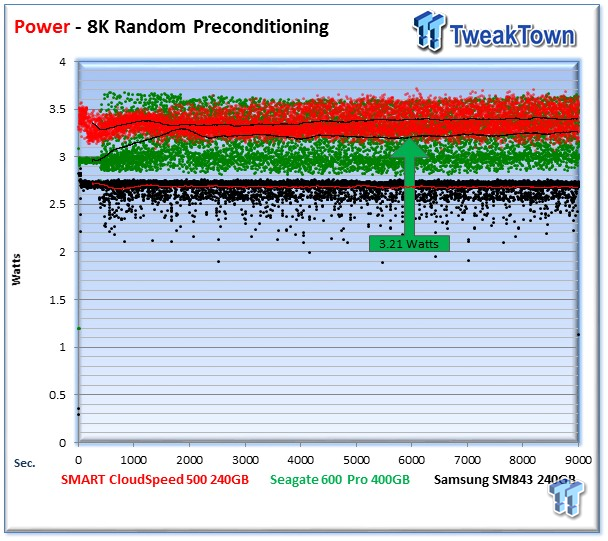
Power consumption for the Seagate 600 Pro averages 3.21 Watts.
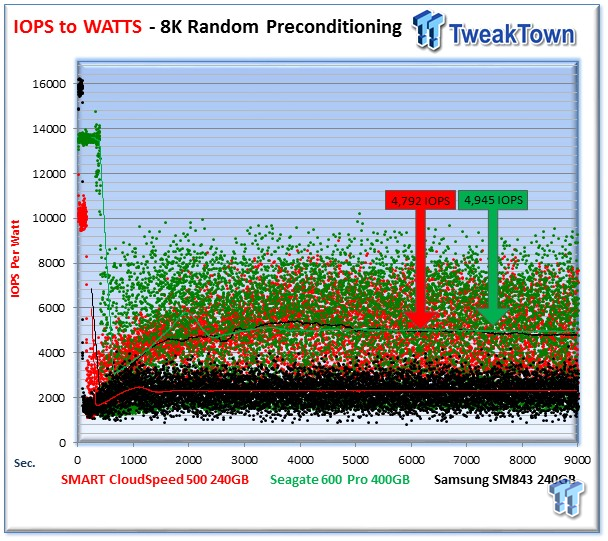
The Seagate 600 Pro averages 4,945 IOPS, nudging the CloudSpeed 500 for the win.
128K Sequential Read/Write
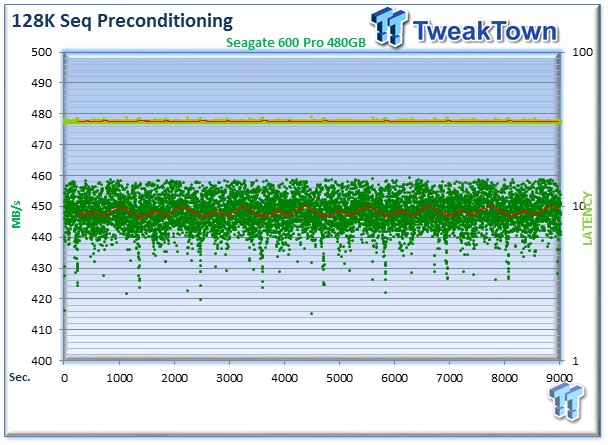
During the 128K sequential preconditioning phase of testing, we noted the predictable nature of the internal housekeeping routines on the Seagate 600 Pro, with staggered periods of lower write speed.
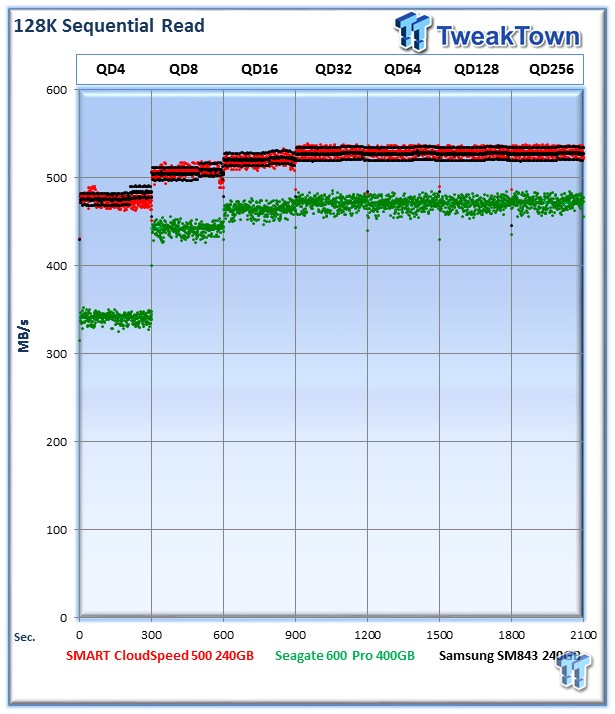
The 128K sequential speeds reflect the maximum sequential throughput of the SSD using a realistic file size encountered in an enterprise scenario.
The Seagate 600 Pro averages 472MB/s, slightly below the CloudSpeed 500 and the Samsung SM843.
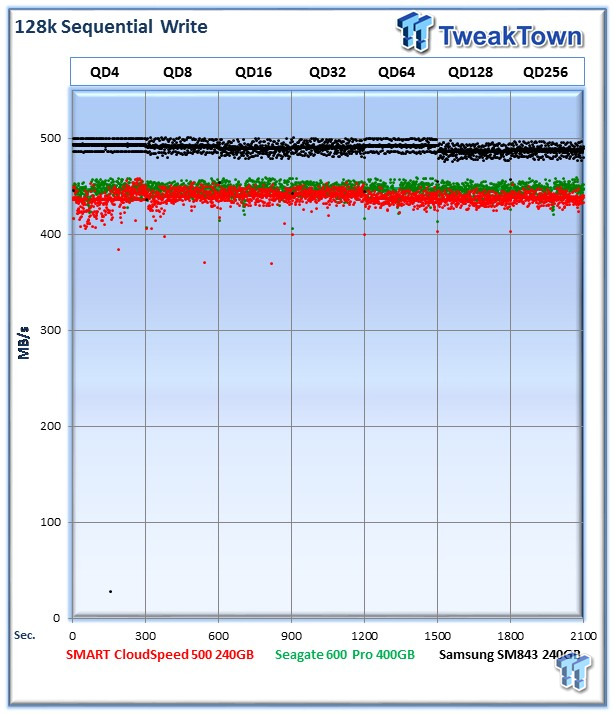
The Seagate 600 Pro slightly edges the CloudSpeed 500 with 447MB/s in sequential write speed.
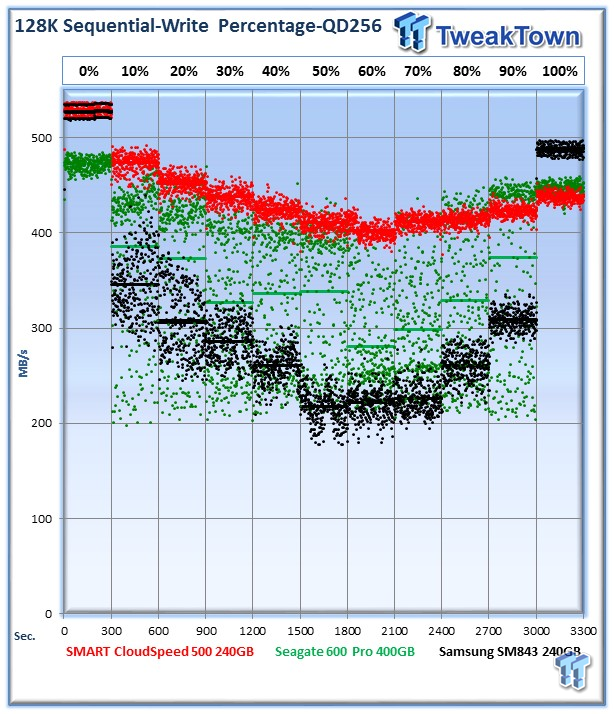
The Seagate 600 Pro exhibits more variability in the sequential mixed workload testing than the other entrants, though the average speeds outpace the SM843. The CloudSpeed 500 turns in a great performance with chart-topping sequential speed in this test.
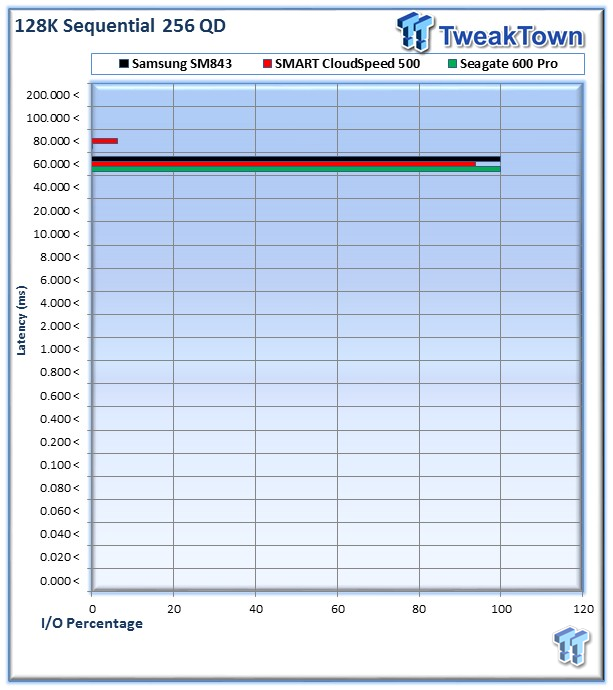
The Seagate 600 Pro delivers an outstanding 99.8% of I/Os (1,069,255) at 60-80ms, matching the SM843.
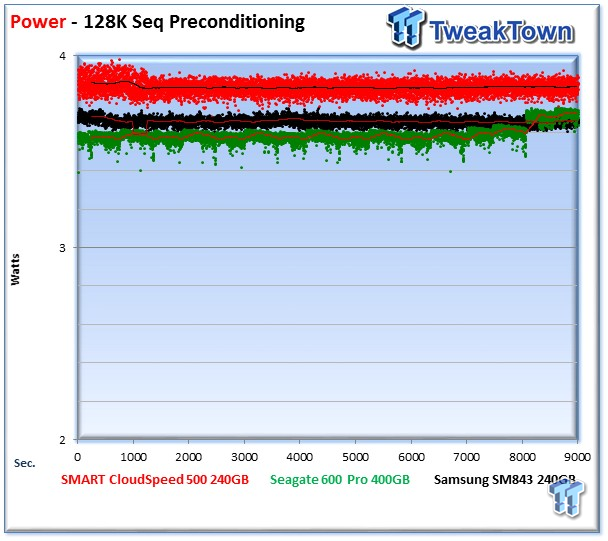
The Seagate 600 Pro experiences a slight increase in power consumption to the end of our preconditioning run. This is reflected in its average wattage score of 3.69 Watts due to the average wattage score being calculated in the last five minutes of the test period. This could be due to the adaptive power adjusting algorithms, which control the power draw of the SSD based upon workload.
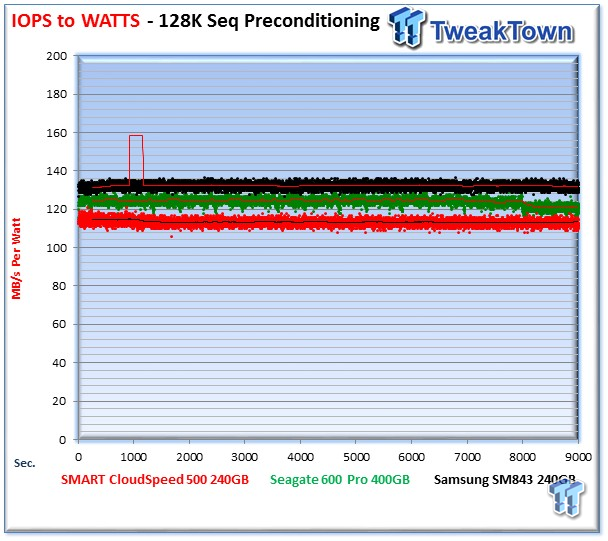
The Seagate 600 Pro comes in second in the MB/s to Watts testing, one of only a few tests that falls below a competitor in the efficiency testing, with 121MB/s per Watt.
Database/OLTP and Webserver
Database/OLTP
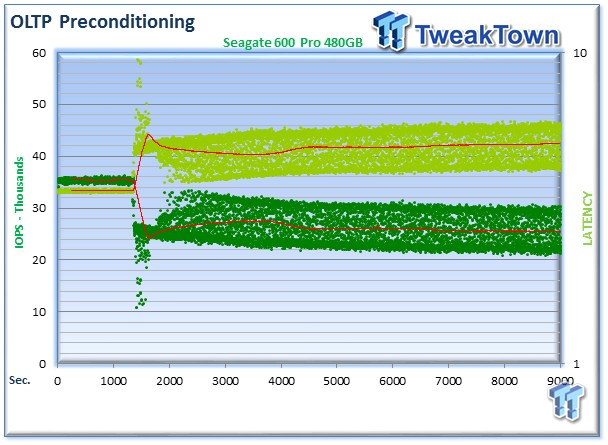
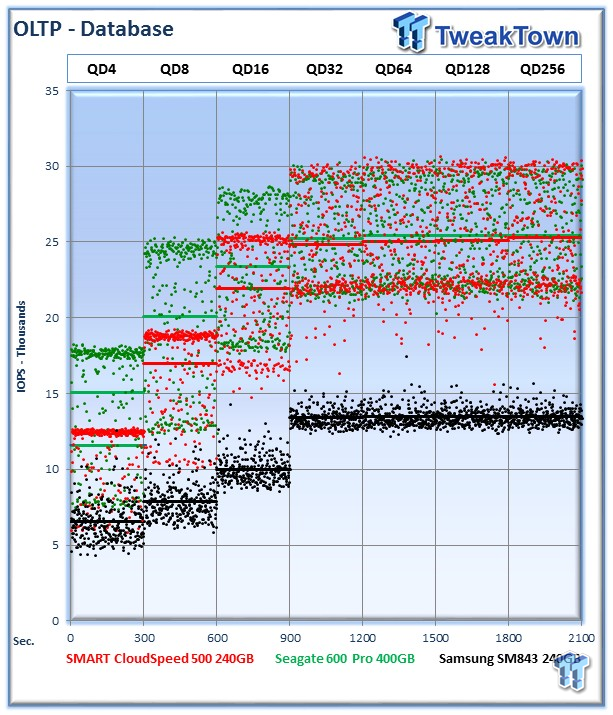
This test emulates Database and On-Line Transaction Processing (OLTP) workloads. OLTP is in essence the processing of transactions such as credit cards and high frequency trading in the financial sector. Enterprise SSD's are uniquely well suited for the financial sector with their low latency and high random workload performance. Databases are the bread and butter of many enterprise deployments. These are demanding 8K random workloads with a 66% read and 33% write distribution that can bring even the highest performing solutions down to earth.
The Seagate 600 Pro averages 24,511 IOPS during the measurement window, with a similar amount of variability and speed in comparison to the CloudSpeed 500.
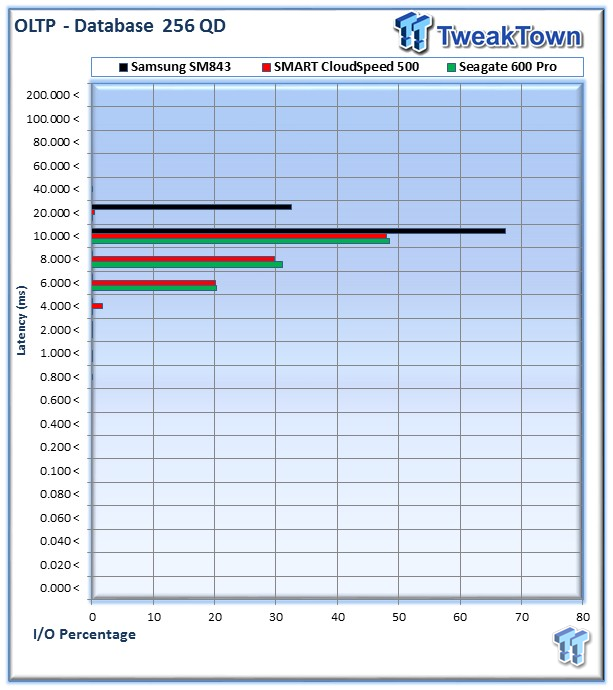
The Seagate 600 Pro delivers 3,685,006 I/Os (48.5%) in the 10-20ms window, 2,353,639 I/Os (31%) at 8-10ms, and 1,536,981 I/Os (20.2%) at 6-8ms.
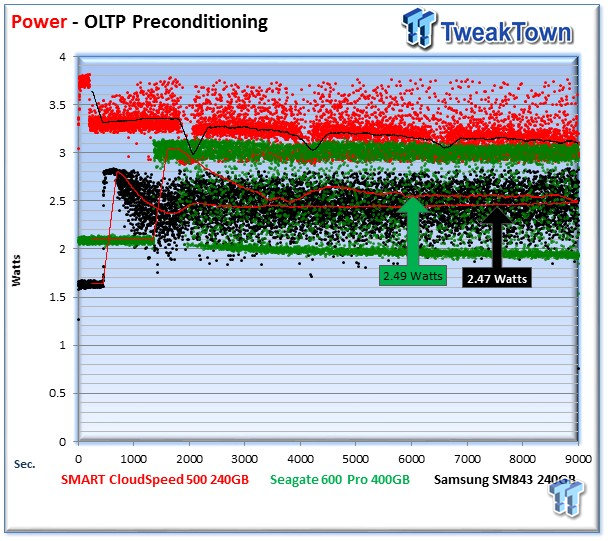
The Seagate 600 Pro averages 2.49 Watts during the precondition run.
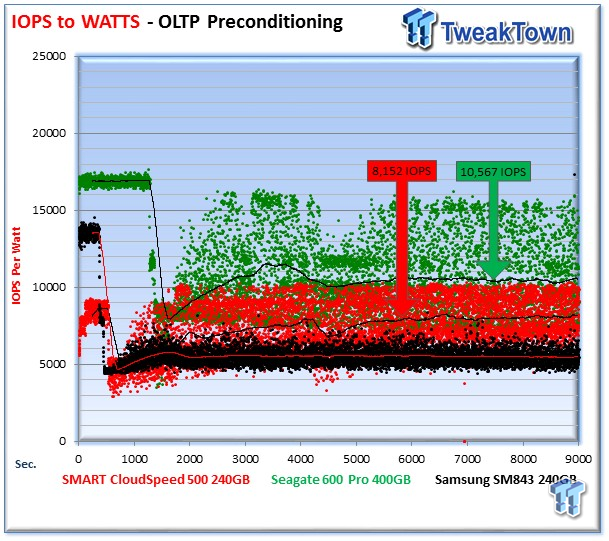
The Seagate 600 Pro averages a massive 10,567 IOPS per Watt during the measurement window, easily outpacing the other competitors.
Webserver
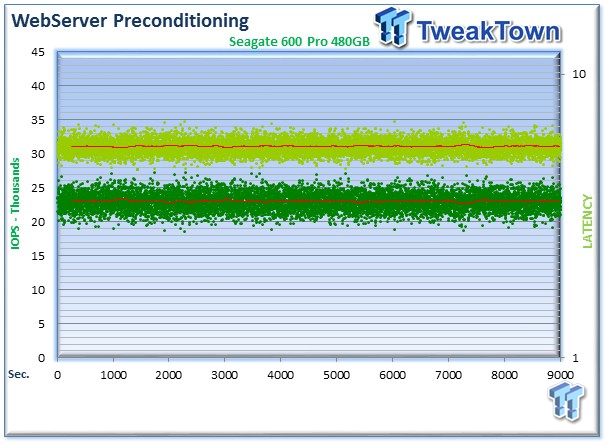
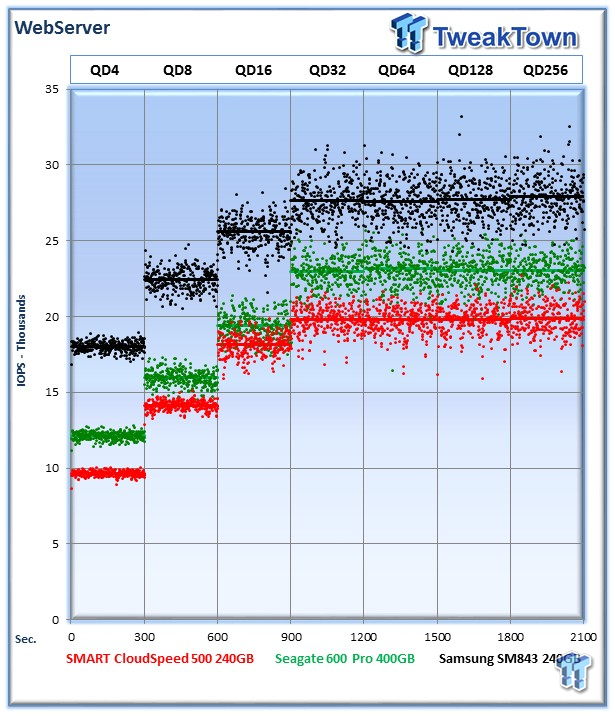
The Webserver profile is a read-only test with a wide range of file sizes. Web servers are responsible for generating content for users to view over the internet, much like the very page you are reading. The speed of the underlying storage system has a massive impact on the speed and responsiveness of the server that is hosting the website, and thus the end-user experience.
The Seagate 600 Pro delivers 23,039 IOPS at QD256, falling between the CloudSpeed 500 and the SM843.
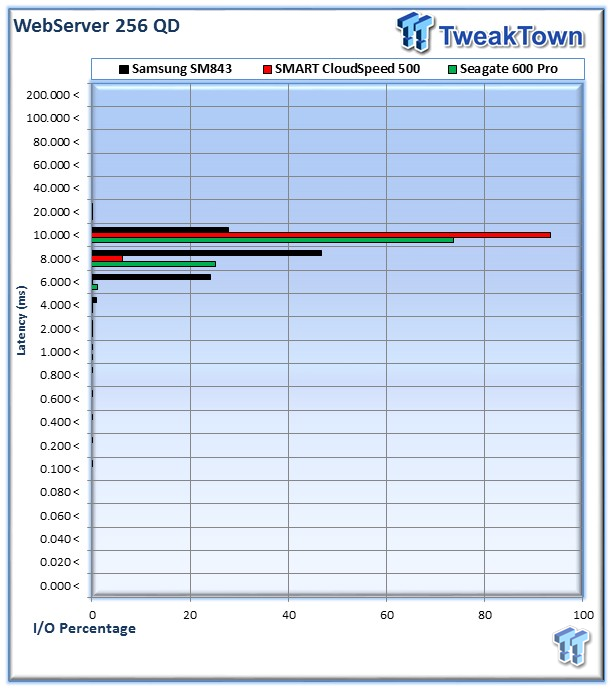
The Seagate 600 Pro provides 5,076,009 I/Os (73.6%) in the 10-20ms range, and 1,729,231 I/Os (25%) in the 8-10ms range.
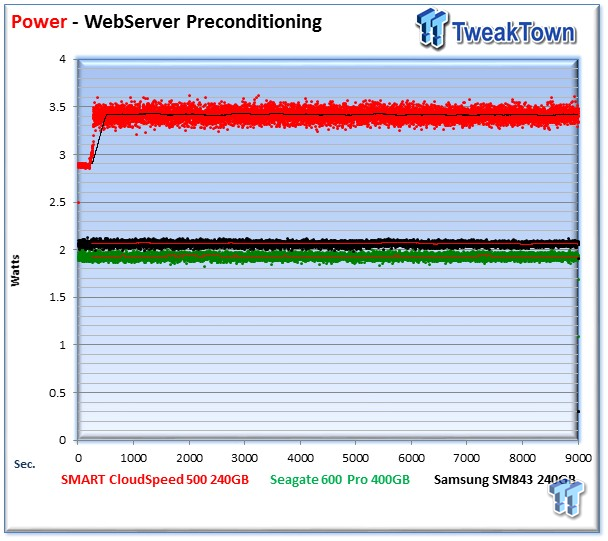
The Seagate 600 Pro averages 1.92 Watts during the measurement window, lower than the other SSD's.
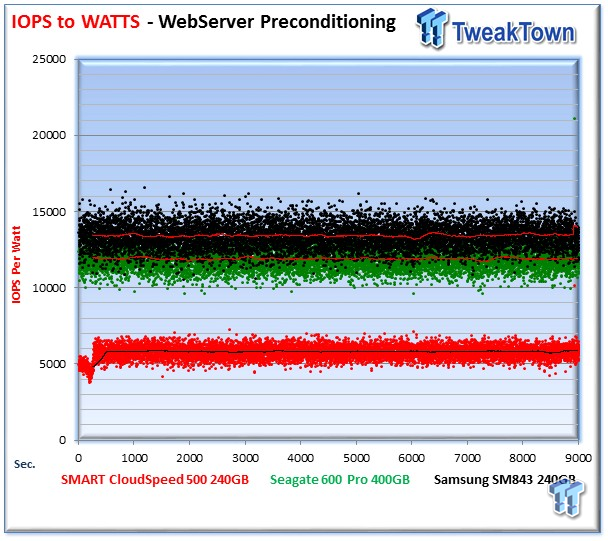
The Seagate 600 Pro averages 11,924 IOPS per Watt.
Fileserver and Emailserver
Fileserver
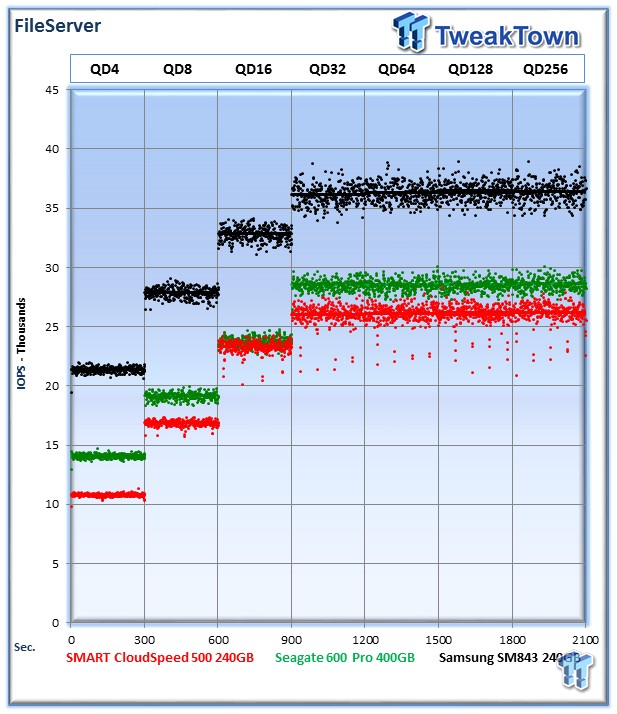
The File Server profile represents typical file server workloads. This profile tests a wide variety of different file sizes simultaneously, with an 80% read and 20% write distribution.
The Seagate 600 Pro averages 28,600 IOPS at QD256.
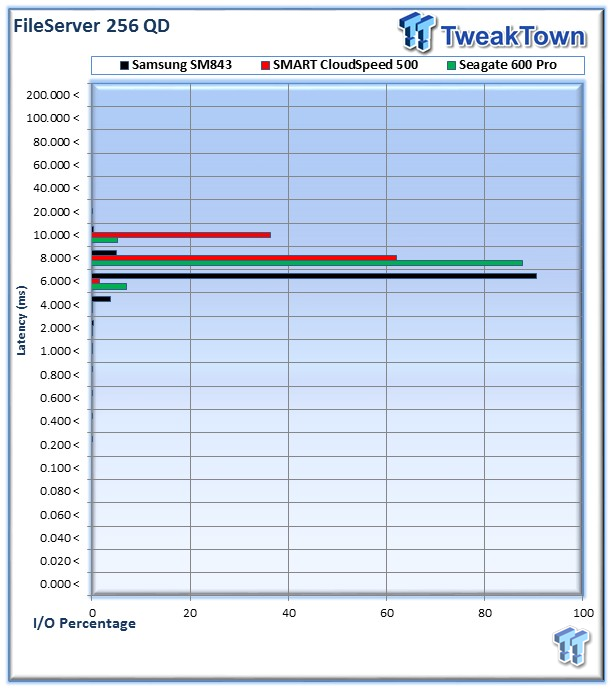
The Seagate 600 Pro provides 7,497,883 I/Os (87.6%) in the 8-10ms range, and 601,583 I/Os (7%) in the 8-10ms range. The remaining 439,117 I/Os (5%) fall in the 10-20ms range.
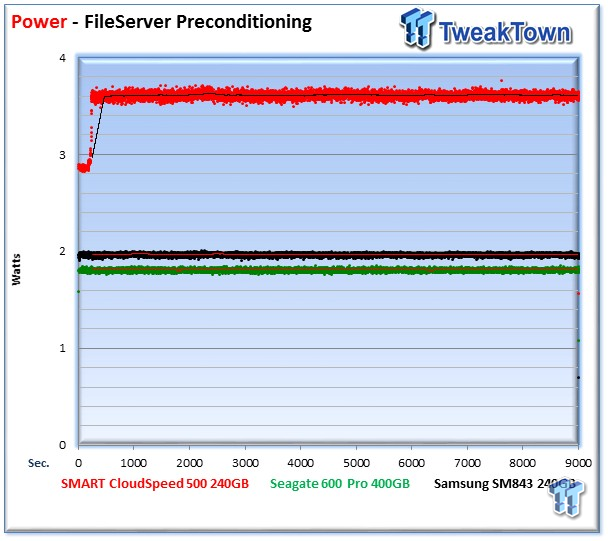
The Seagate 600 Pro averages a scant 1.8 Watts in steady state.
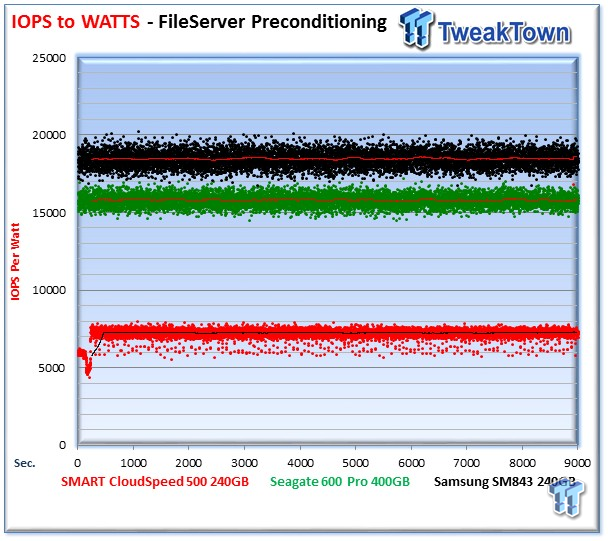
The Seagate 600 Pro averages 15,807 IOPS per Watt, below the SM843.
Emailserver
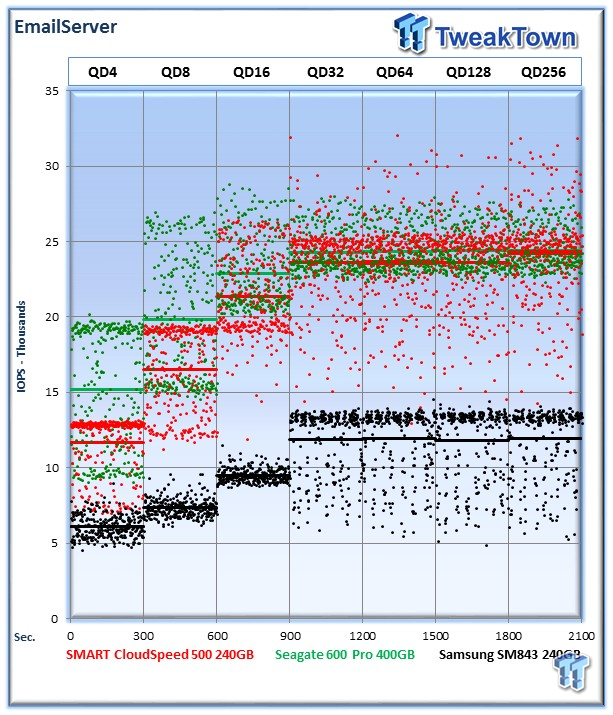
The Emailserver profile is a very demanding 8K test with a 50% read and 50% write distribution. This application is indicative of the performance of the solution in heavy write workloads.
The Seagate 600 Pro and the CloudSpeed 500 trade blows again in this test, with an average of 8,464 IOPS for the Seagate 600 Pro at QD256.

The Seagate 600 Pro provides 58% of I/O's in the 10-20ms range, 34.4% at 8-10ms, and 7.3% at 6-8ms.
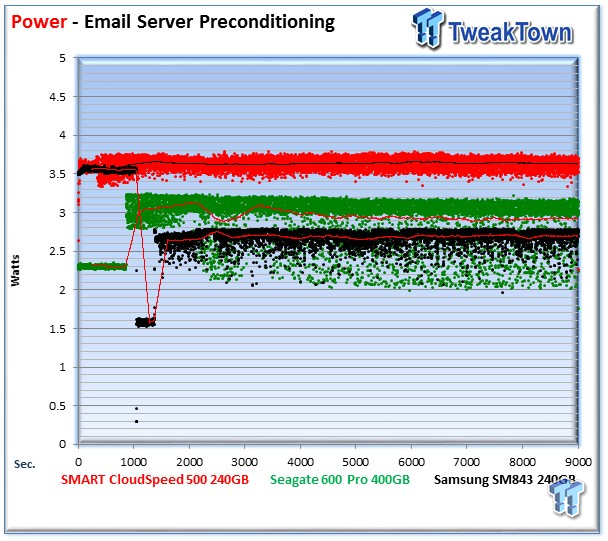
The Seagate 600 Pro averages 2.9 Watts during the measurement window.
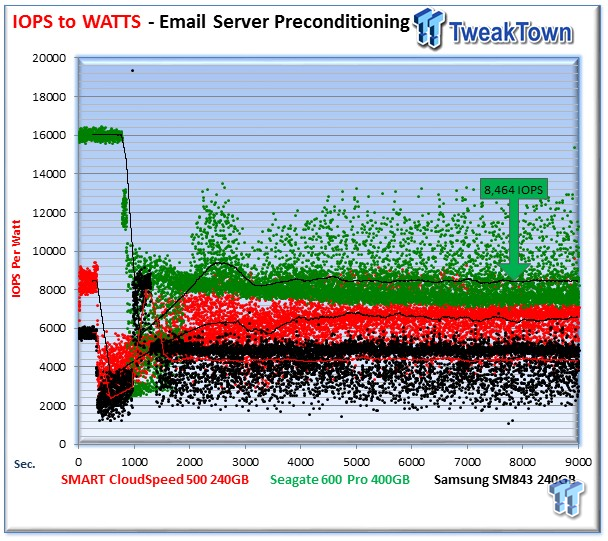
The Seagate 600 Pro averaged an impressive 8,464 IOPS per Watt.
Final Thoughts
Power consumption is defining the shape of today's datacenters. We have all heard the stories of mega-datacenters that badly need to expand, but cannot due to power limitations at their location.
New datacenters aim for increased efficiency with an almost fanatical obsession. Every new datacenter design is weighed by its Power Usage Effectiveness (PUE) rating. A PUE rating of 2.0 consists of a doubling of every watt of power used for computing in order to cool and power the equipment. A rating of 1.0 means that nearly all energy consumed is specifically for computing purposes. According to the Uptime Data Center Survey, the global PUE average is between 1.8 and 1.89.
This inefficiency is a multi-billion dollar a year problem. Delivering on lower power usage goals requires new technologies that are radically more power efficient than older approaches. Some new datacenter designs sport a 1.05-1.1 PUE rating. Measuring the power efficiency of a storage solution is not always clear-cut, the math behind the power saving benefits of SSD's can be complicated when factoring in lower cooling costs and less downtime, among other factors.
The easiest power savings to quantify come in the form of IOPS per Watt metrics. More work produced by the storage device per watt equates to lower overall power consumption for the datacenter. Seagate has leveraged their deep understanding of OEM storage solutions and power efficiency to shape their new line of enterprise SSD products.
To the uninitiated, it may seem counterintuitive that in some cases a slightly slower but more efficient drive will win the race. Much like the tortoise and hare, running out ahead does not always win.
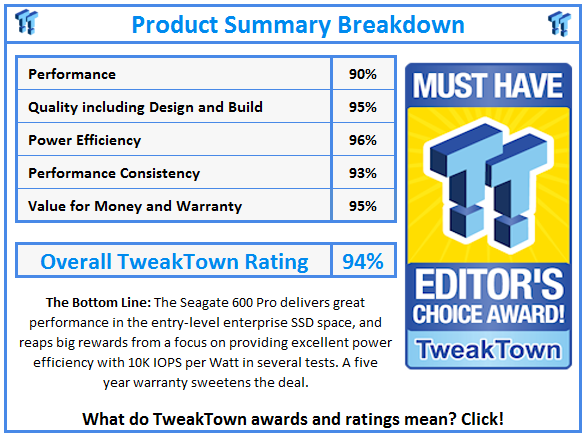
One of the key selling points of the Seagate 600 Pro is its efficiency, and this shone through in our testing. The Seagate 600 Pro won five of our eight power efficiency tests, and some by large margins. The promise of 10,000 IOPS per Watt in some workloads was proven correct in our testing. We had multiple workloads fall either just under, or over, this goal. This is due in part to the adaptive power management algorithms embedded in the firmware of the SSD.
The Seagate 600 Pro also brought speed along as well, and handled very well in our mixed read/write workloads. Many times an SSD will have a great score in a pure read or write test, but the real workloads lie somewhere in the middle with a mixture of read and write activity.
In many cases client SSD's tend to compete with the value-centric enterprise SSD offerings, but suffer a tremendous loss of speed in mixed read/write testing. The 600 Pro performed admirably with the random mixed workloads, but exhibited some variability in the 128K sequential mixed testing. This should be curable with further firmware refinement.
The addition of host power-loss protection functionality with the embedded array of tantalum capacitors is another great feature of the Seagate 600 Pro that provides an extra level of protection for user data.
For an entry-level SSD, the Seagate 600 Pro delivers big on features that will have a tangible impact on long-term TCO. Focusing on power consumption rounds out the features and boosts this SSD over other solutions. The five year warranty provides assurance from a manufacturer with deep storage roots that date back to 1979, making it easy to give the Seagate 600 Pro the TweakTown Editor's Choice Award.
 Solidigm D7-PS1030 6.4TB Enterprise SSD Review - Most powerful of its kind yet
 DapuStor Haishen5 H5100 7.68TB Enterprise SSD Review - Random Read Champion
 Solidigm D7-P5810 800GB Enterprise SSD Review - Caching QLC
 Micron 7500 Max 12.8TB SSD Review - Drop-in Ready
 Solidigm D5-P5336 61.44TB SSD Review - Size Matters
 AMD Ryzen 9800X3D CPU leaked by two US retailers - but let's all agree to ignore the price tags
 Check out this GPU die shot of NVIDIA's next-gen GeForce RTX 5080 graphics card
 NVIDIA renames Blackwell Ultra to B300 series: HBM3E 12-Hi memory, TSMC CoWoS-L packaging
 SK hynix shows off HBM3E 12-Hi chips: 12 chips stacked, 40% thinner than 8-Hi stacks for 2025
 Apple slated to launch new MacBook Pro, iMac, and Mac Mini models within 7 days
 ASUS ROG Strix X870-I Gaming Wi-Fi Mini-ITX Motherboard Review
 ENDORFY Fluctus 120 PWM and Fluctus 120 PWM ARGB Cooling Fans Review
 Samsung 990 EVO Plus 2TB SSD Review - The DRAMless Powerhouse
 Lexar Play 2280 4TB SSD Review - Made for PlayStation 5
 XPG Invader X BTF Mid-Tower Chassis Review
 Crucial T500 4TB SSD Review - World's Best Performing 4-Channel SSD
 Patriot Viper Elite 5 RGB DDR5-6000 CAS 30 48GB Dual-Channel Memory Kit Review
 TeamGroup PD20M Mag 2TB External SSD Review - The Ultimate iPhone Accessory
 ASRock Phantom Gaming X870 Riptide Wi-Fi Motherboard Review
 Turtle Beach Kone II Air Wireless Gaming Mouse Review - Comfortably Huge
 ASUS Wi-Fi 7 routers push the boundary of wireless speed with AI-powered optimization
 ASUS's new AI NUC range delivers compact versatility and cutting-edge performance
 ASUS ROG Crosshair X870E Hero - Easy DIY, Cutting-Edge Features, and Next-Level Performance
 How NVIDIA RTX AI technology is pushing PC gaming forward
 Analysis: Why the Sony PlayStation 5 Pro console costs $700