Introduction
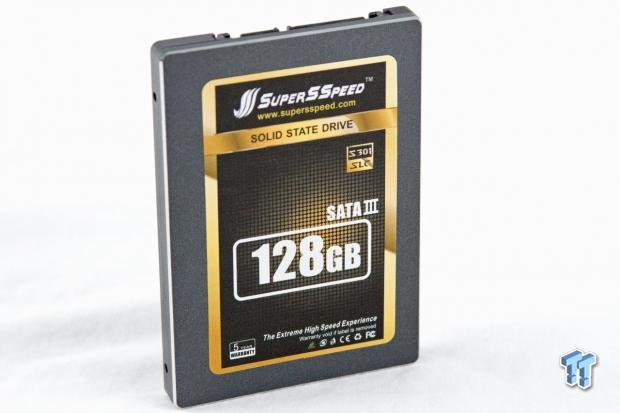
The SuperSSpeed S301 Hyper Gold SLC SSD is an interesting crossover product, with the notable characteristic of being an SLC SSD geared for the client market. SLC is disappearing in all but niche applications in the datacenter due to high pricing in relation to MLC products, and is nearly non-existent in the consumer arena.
SuperSSpeed is a regional ODM (Original Design Manufacturer) that also markets SSDs under their own flag. SuperSSpeed and their parent, Richmax Technology, also have deep roots as NAND distributors. This provides them a bulk pricing advantage to sell Intel 25nm SLC-powered SSDs at prices lower than many thought possible.
One of the redeeming characteristics of the LSI SandForce SF-2281 controller is that it offers a modular building block that allows manufactures to easily create and sell their own SSDs. The SuperSSpeed S301 was initially a regional product from Hong Kong, but with some influence from TweakTown's Chris Ramseyer, our Consumer Storage Editor, the SuperSSpeed has made its way to American shores as well.
It is important to note that LSI SandForce SF-2281, typically utilized in consumer applications, is employed in the S301. The SF-2582 and 2682 are the SandForce enterprise controller variants, but the reliable SF-2281 responds very well to the use of SLC NAND, even removing much of the performance penalty incurred with incompressible data.
The SuperSSpeed S301 and its SF-2281 controller feature beefy stats, with 550/520 MB/s of sequential read/write speed. The S301 is no slouch in the IOPS category either, rated for 80,000/60,000 IOPS in 4K random read/write.
With the high pricing of SLC NAND pushing it out of many datacenter applications, we were surprised to find this SSD competing with client MLC SSDs at the comparatively low price point of $2.00 per GB. The high price of SLC NAND is not always at the heart of the exorbitant pricing of most SLC products. SLC SSDs also tend to have other features, such as enhanced firmware for end-to-end data protection, and capacitors for power fail protection, that drive up costs. By stripping away these features, SuperSSpeed is able to deliver an SLC SSD at a competitive price point.
We have been noticing a trend towards the deployment of consumer MLC SSDs into datacenter applications to realize upfront benefits in acquisition costs. The concept of users taking a more value-oriented approach to SLC SSDs certainly is not entirely out of bounds. For users with heavy workloads that would typically require a higher endurance solution than enterprise-class MLC SSDs, it would not be too far of a jump to deploy a consumer SLC product.
In light of the fact that there is a lack of a few notable enterprise-class features, mentioned above, these SSDs would certainly not be best suited for mission-critical applications. Users employing the rip-and-replace model rarely use value-oriented SSDs in this manner, typically only storing redundant data. Another niche for high-endurance SSDs is in parity RAID arrays. SLC, due to its inherently superior write latency and endurance, is well suited for this type of application.
The SuperSSpeed S301 competes in the consumer market, but today we are pulling no punches, taking it against the current leaders in the enterprise SSD market.
SuperSSpeed S301 Specifications
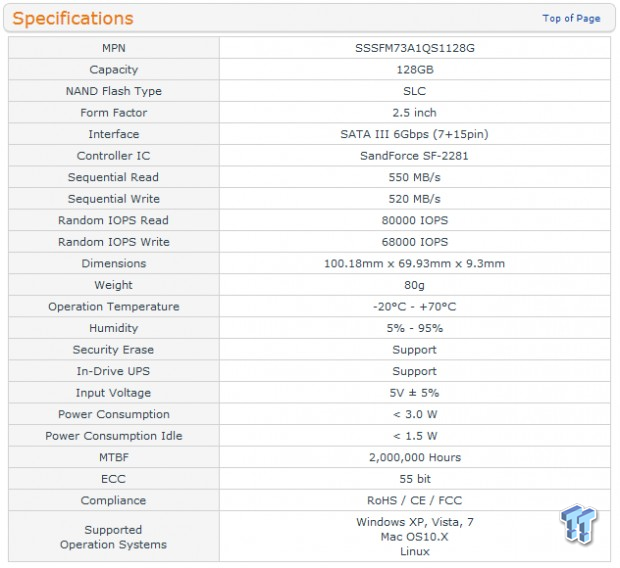
While there is no official TBW rating for the SuperSSpeed S301, there is no doubt that its Intel 25nm SLC NAND will outlast MLC competitors. Many enterprise SSD manufacturers are employing various techniques to enhance the P/E ratio of MLC NAND, but no current techniques can match the 100,000 P/E ratio offered by SLC NAND.
SLC only requires 200-300us to program, compared to the 600-900us for MLC NAND, providing a great write latency advantage. This enhanced write latency equates to a big boost with incompressible data when paired with LSI SandForce flash processor units.
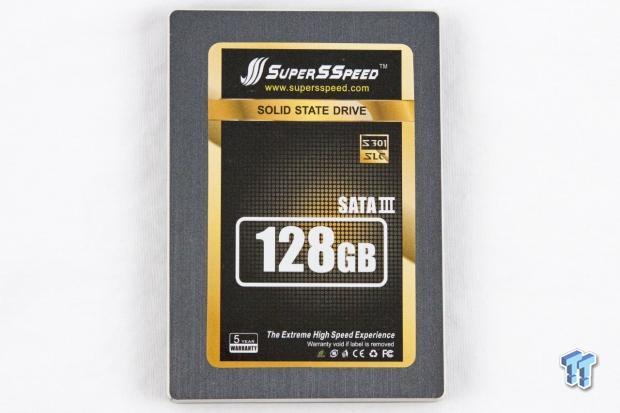
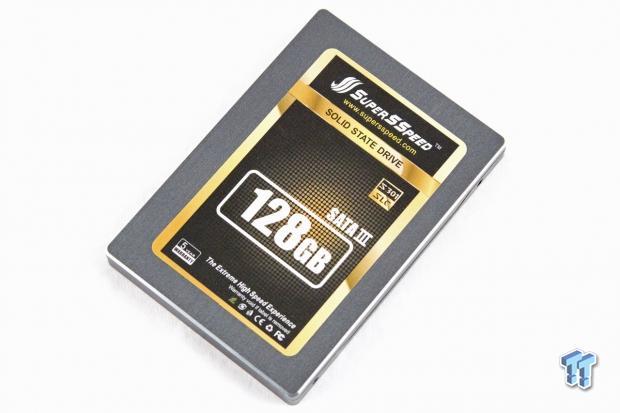
The 6Gb/s SuperSSpeed S301 Hyper Gold SSD comes in a typical 2.5" form factor with a 9.3mm Z-Height, but only currently features one capacity point of 128GB.
The S301 features a five year warranty and a MTBF of 2,000,000 hours. In typical LSI SandForce fashion the S301 does not have DRAM cache, and the SF-2281 supplies 55-bit ECC. The S301 has RAISE functionality disabled.
The SuperSSpeed S301 features sequential read speeds of 550MB/s and sequential write speeds of 520MB/s. The random read IOPS weight in at 80,000 IOPS, and the random write IOPS are an impressive 68,000 IOPS.
The S301 features AES-128 encryption and is TCG opal security compliant.
SuperSSpeed S301 Internals
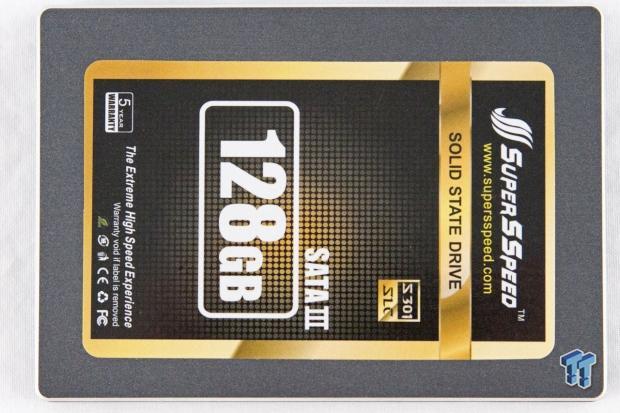
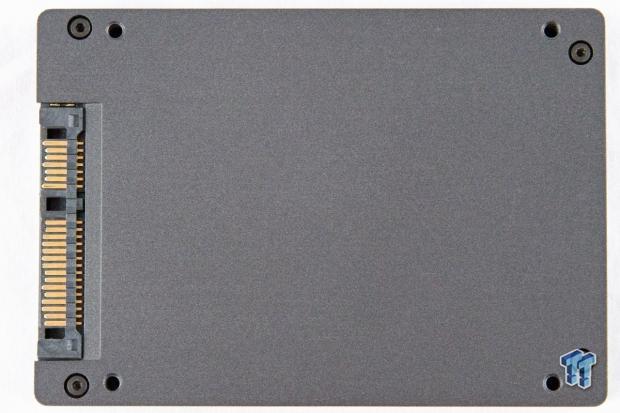
The SuperSSpeed S301 Hyper Gold comes in a sturdy 2.5" aluminum chassis with a 9.3mm Z-Height.
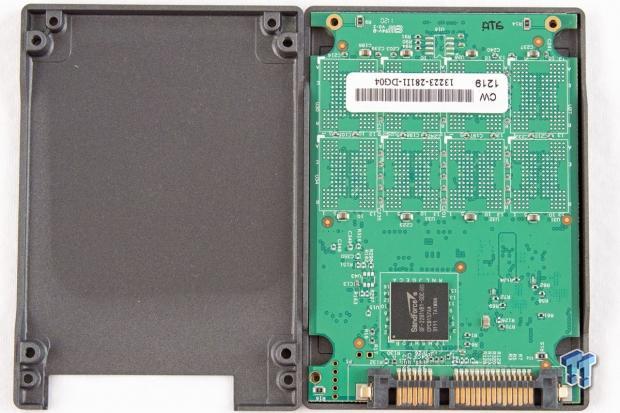
The SSD does not feature any power capacitors for host power-loss protection, and has a notable lack of thermal pads. The S031 is rated for 70C, likely due to the thermal envelope of the LSI SandForce controller. Intel 25nm SLC NAND is rated for 100C, providing great performance in high heat environments.
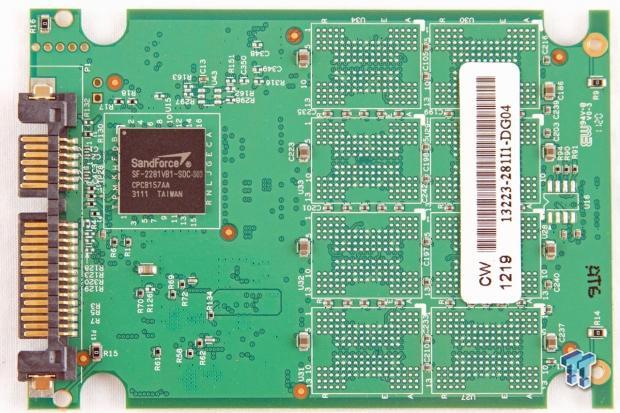
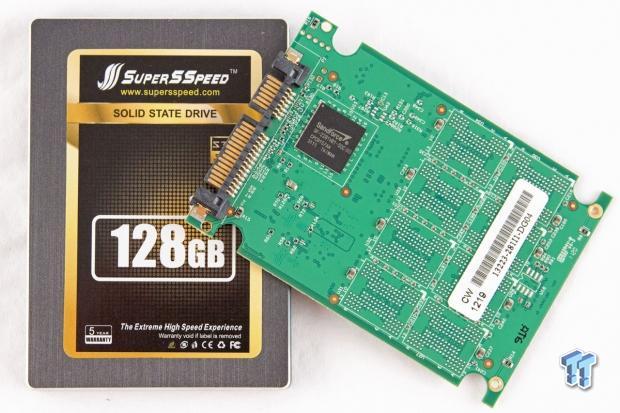
The LSI SF-2281VB1 controller is the only feature on the top of the PCB.
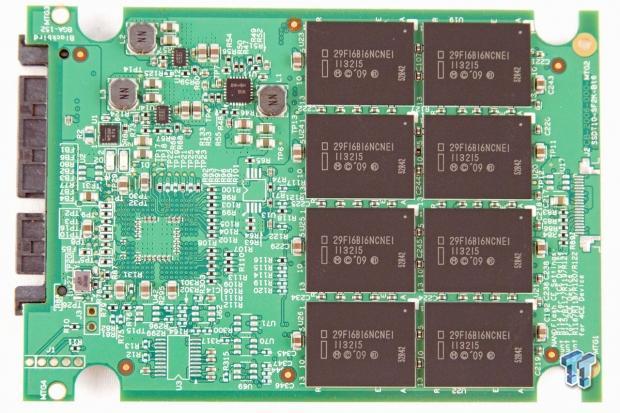
The bottom of the PCB is populated with eight packages of 29F16B16NCNE1 Intel 25nm SLC NAND.
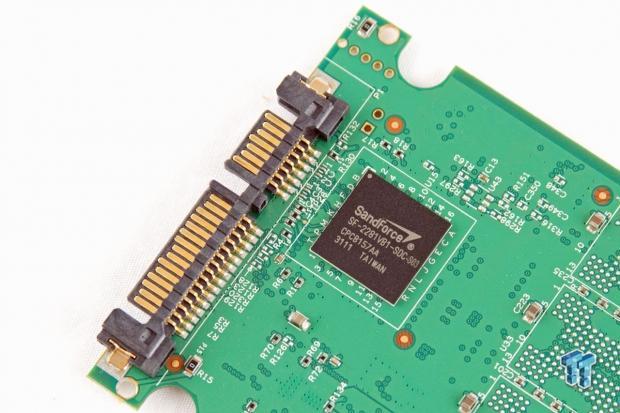
There is no DRAM cache, which is typical of LSI SandForce based products.
Test System and Methodology

We utilize a new approach to HDD and SSD storage testing for our Enterprise Test Bench, designed specifically to target long-term performance with a high level of granularity.
Many testing methods record peak and average measurements during the test period. These average values give a basic understanding of performance, but fall short in providing the clearest view possible of I/O QoS (Quality of Service).
'Average' results do little to indicate the performance variability experienced during actual deployment. The degree of variability is especially pertinent, as many applications can hang or lag as they wait for I/O requests to complete. This testing methodology illustrates performance variability, and includes average measurements, during the measurement window.
While under load, all storage solutions deliver variable levels of performance. While this fluctuation is normal, the degree of variability is what separates enterprise storage solutions from typical client-side hardware. Providing ongoing measurements from our workloads with one-second reporting intervals illustrates product differentiation in relation to I/O QOS. Scatter charts give readers a basic understanding of I/O latency distribution without directly observing numerous graphs.
Consistent latency is the goal of every storage solution, and measurements such as Maximum Latency only illuminate the single longest I/O received during testing. This can be misleading, as a single 'outlying I/O' can skew the view of an otherwise superb solution. Standard Deviation measurements take latency distribution into consideration, but do not always effectively illustrate I/O distribution with enough granularity to provide a clear picture of system performance. We use histograms to illuminate the latency of every single I/O issued during our test runs.
Our testing regimen follows SNIA principles to ensure consistent, repeatable testing. We attain steady state through a process that brings the device within a performance level that does not range more than 20% during the measurement window. Forcing the device to perform a read-write-modify procedure for new I/O triggers all garbage collection and housekeeping algorithms, highlighting the real performance of the solution.
We measure power consumption during precondition runs. This provides measurements in time-based fashion, with results every second, to illuminate the behavior of power consumption in steady state conditions. Power consumption can cost more over the life of the device than the initial acquisition price of the hardware itself. This significantly affects the TCO of the storage solution. We also present IOPS-to-Watts measurements to highlight the efficiency of the storage solution.
For LSI SandForce-powered SSDs we conduct all preconditioning, and the following workloads, with 50% compressible data. This is the result of industry feedback, and the middle ground provides a picture of performance that is neither too critical, nor too favorable. Readers must bear in mind that there is varying performance with LSI SandForce processors due to its internal compression engine. Incompressible data will score much lower than the results presented in these tests, and fully compressible data will score much higher. It is important for administrators to know their workload and select the storage solution accordingly.
Our test pool features SSDs of varying capacity, so it is important to bear this in mind when viewing results. The first page of results will provide the 'key' to understanding and interpreting our new test methodology.
4K Random Read/Write
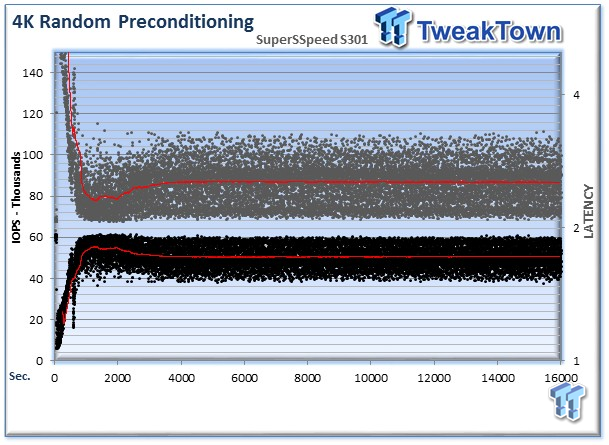
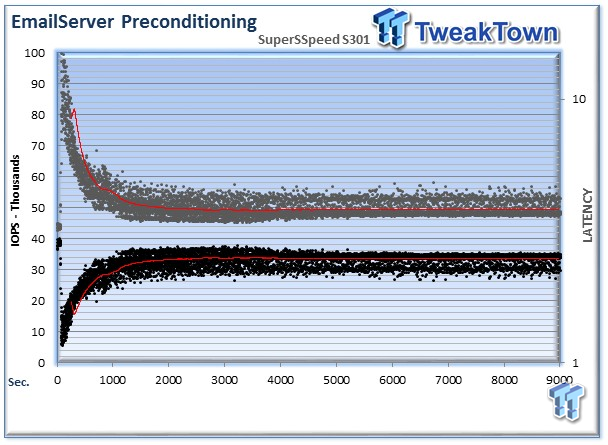
We precondition the SuperSSpeed S301 with 50% compressible data for 18,000 seconds, or five hours, receiving reports on several parameters of workload performance every second. We then plot this data to illustrate the drives' descent into steady state. Please refer to the previous page for a note on data compressibility.
This chart consists of 36,000 data points. This is a dual-axis chart with the IOPS on the left and the latency on the right. The black dots signify IOPS during the test, and the brown dots are latency measurements during the test period. We place latency data in a logarithmic scale to bring it into comparison range. The lines through the data scatter are the average during the test. This type of testing presents standard deviation and maximum/minimum I/O in a visual manner.
Note that the IOPS and Latency figures are nearly mirror images of each other. This illustrates the point that high-granularity testing can give our readers a good feel for the latency distribution by viewing IOPS at one-second intervals. This should be in mind when viewing our test results below.
We provide histograms for further latency granularity below. This downward slope of performance happens very few times in the lifetime of the device, typically during the first few hours of life, and we present the precondition results only to confirm steady state convergence.
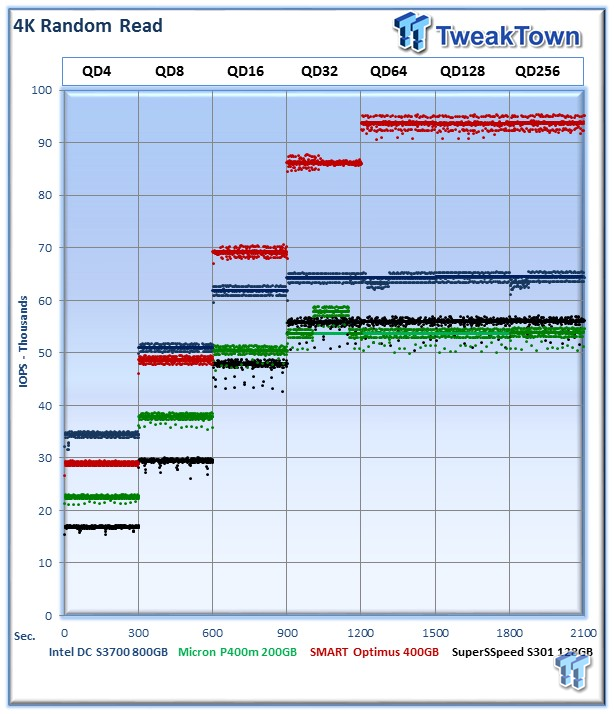
Each QD for every parameter tested includes 300 data points (five minutes of one second reports) to illustrate the degree of performance variability. The line for each QD represents the average speed reported during the five-minute interval.
4K random speed measurements are an important metric when comparing drive performance, as the hardest type of file access for any storage solution to master is small-file random. One of the most sought-after performance specifications, 4K random performance is a heavily marketed figure.
The SuperSSpeed S301 averages 56,063 IOPS in a pure 4K read environment at QD256. The SATA Intel DC S3700 rides above the Micron P400m and the S301 by roughly 10,000 IOPS. The SAS SMART Optimus is far ahead of our SATA competitors, at over 90,000 IOPS.
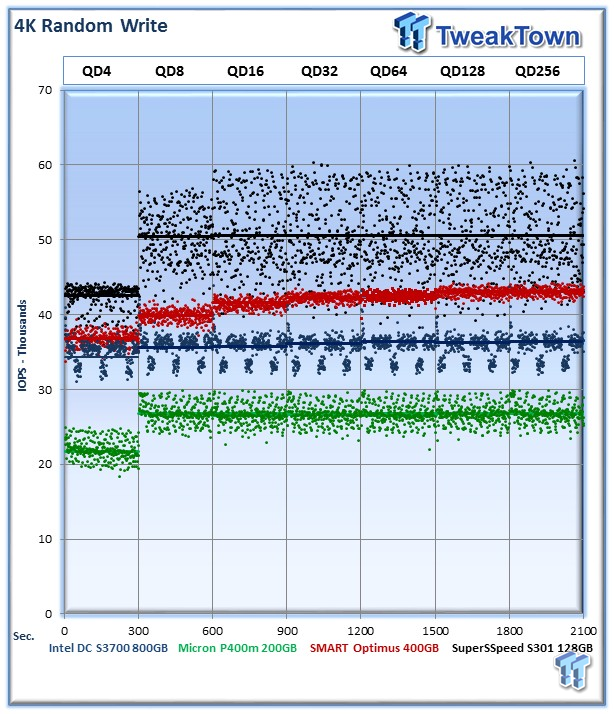
Garbage collection routines are more pronounced in heavy write workloads. This leads to more variability in performance, and the SuperSSpeed S301 has a wide range of performance though it averages an impressive 50,606 IOPS. This outstrips all of the other SSDs, and the benefits of using SLC are readily apparent in this test.
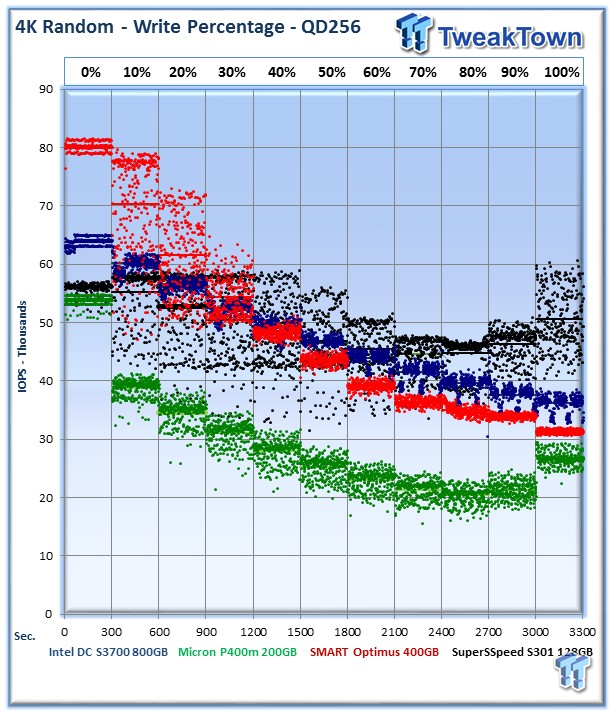
Our write percentage testing illustrates the varying performance of each solution with mixed workloads. The 100% column to the right is a pure write workload of the 4K file size, and 0% represents a pure 4K read workload.
The SuperSSpeed S301 has very little variance as we mix in heavier write workloads. The MLC SSD's fall into an expected pattern, with slower write performance with heavier workloads. SLC NAND provides a clear advantage in heavy write workloads to the S301.
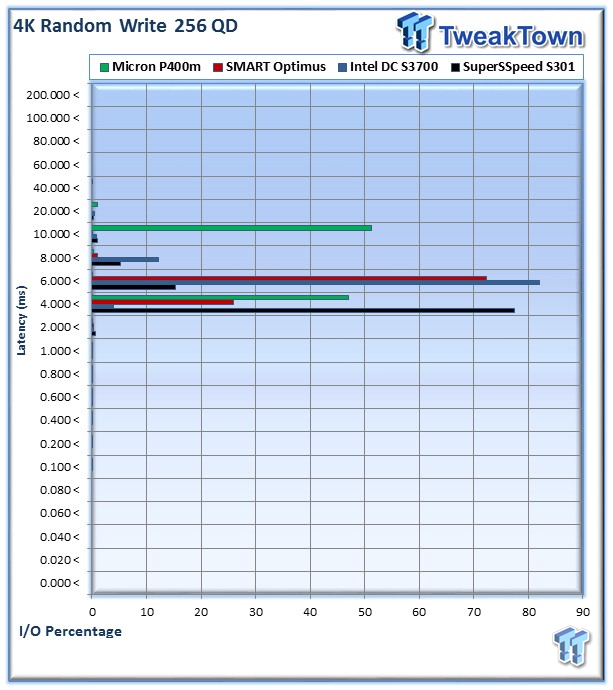
The SuperSSpeed S301 has 11,715,408 I/Os (77.4%) fall into the 4-6ms range, and 2,325,946 I/Os (15.3%) fall into the 6-8ms range.
Unsurprisingly the SuperSSpeed S301 provides superb overall latency as a byproduct of its SLC NAND.
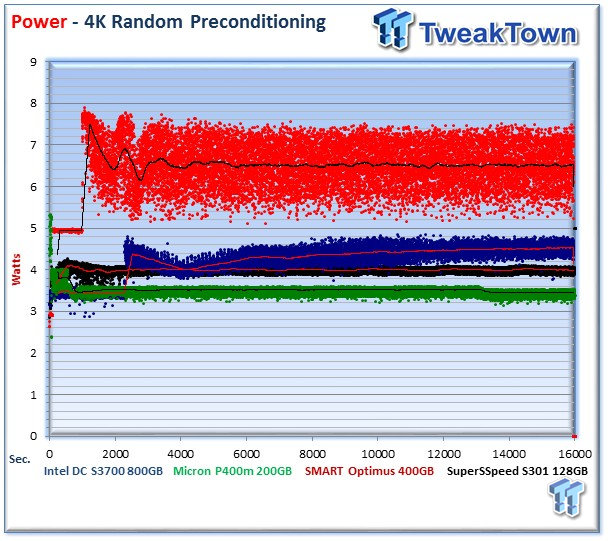
We record the power consumption measurements during our precondition run. We calculate the stated average results during the last five minutes of the test, after the device has settled into steady state.
The SuperSSpeed S301's power consumption falls into the lower end of our chart, with an average of 4.03 Watts in steady state.
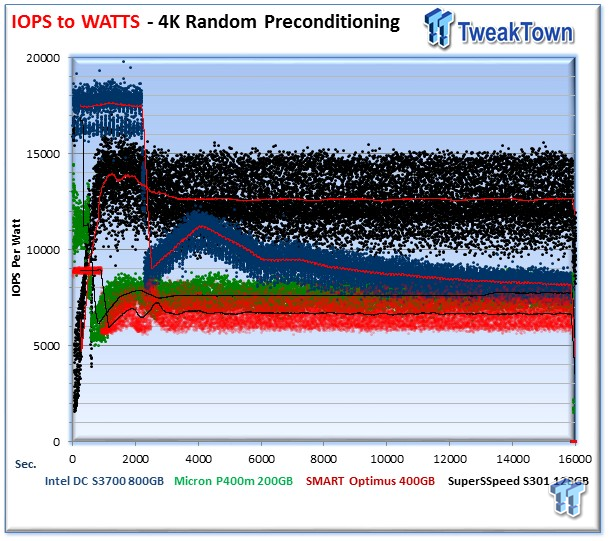
IOPS to Watts measurements are generated from data recorded during our precondition run, and the stated average is from the last five minutes of the test. The SuperSSpeed S301 flies high, averaging 13,000 IOPS per Watt. The other SSDs all fall into the same range, with the P400m disappearing into the gap between the Intel DCS3700 and the SMART Optimus.
8K Random Read/Write
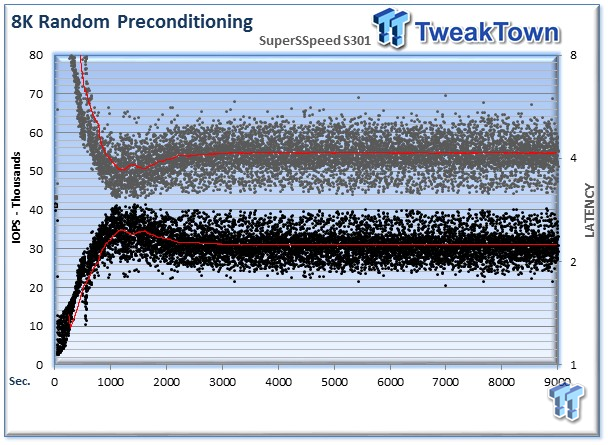
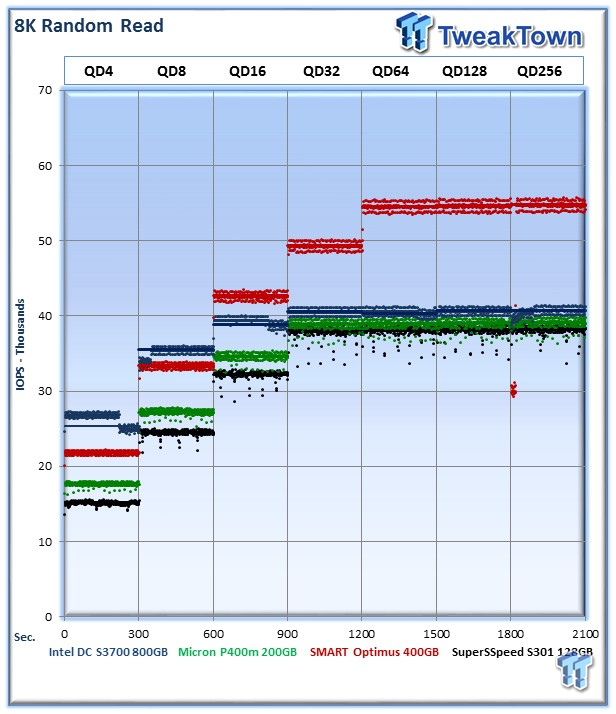
8K random read and write speed is a metric that is not tested for consumer use, but for enterprise environments this is an important aspect of performance. With several different workloads relying heavily upon 8K performance, we include this as a standard with each evaluation. Many of our Server Emulations below will also test 8K performance with various mixed read/write workloads.
The average 8K random read speed of the SuperSSpeed S301 comes in at 38,238 IOPS at QD256, which is comparable to the other SATA competitors.
[img]20 [/img]The average 8K random write speed of the SuperSSpeed S301 is 31,116 IOPS at QD256. Once again, the pure random write speed of the S301 leads the pack by a fair margin.
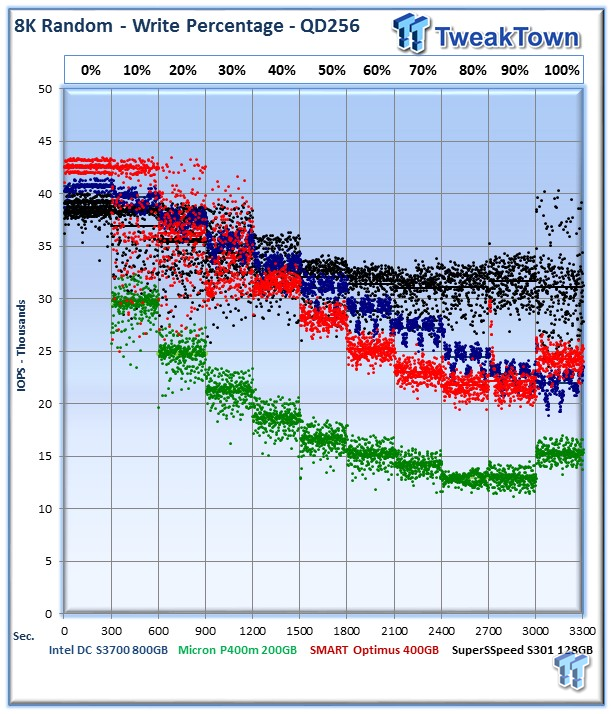
The SuperSSpeed S301 SLC is superb when dealing with varying percentages of write activity. It drops less than 7,000 IOPS from a 100% read to a pure random 8K write workload.
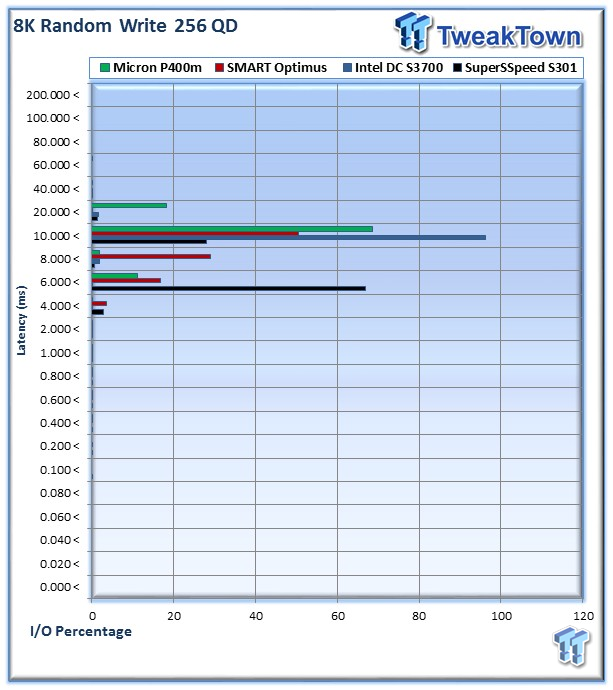
The SuperSSpeed S301 provided 6,227,366 I/Os (66.9%) in the 6-8ms range, and the vast remainder, 2,597,695 I/Os (27.9%), fall into the 10-20ms range.
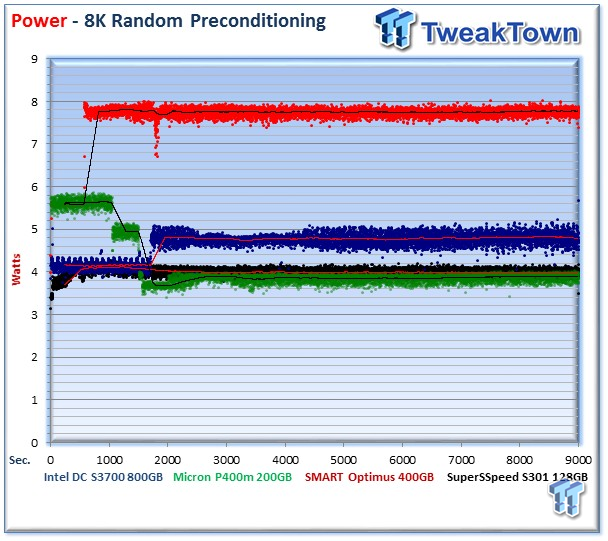
Power consumption for the SuperSSpeed S301 averages 3.98 Watts, which is very close to the Micron P400m.
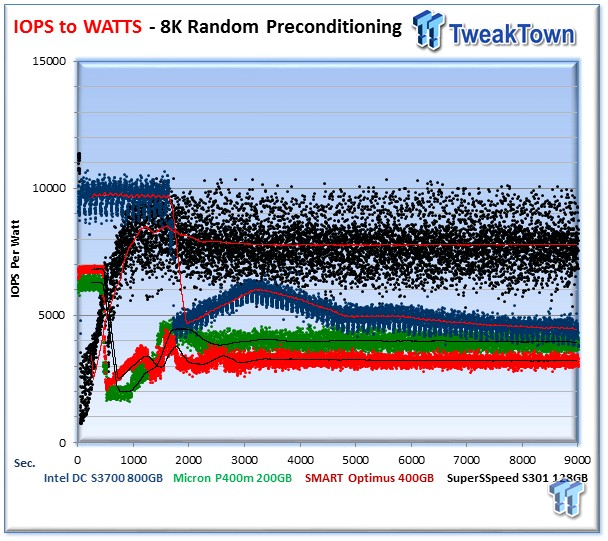
The SuperSSpeed S301 averages 7,784 IOPS per Watt during the 8K preconditioning run.
128K Sequential Read/Write
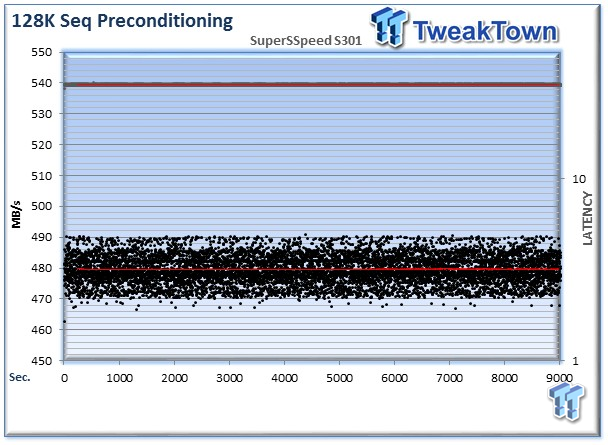
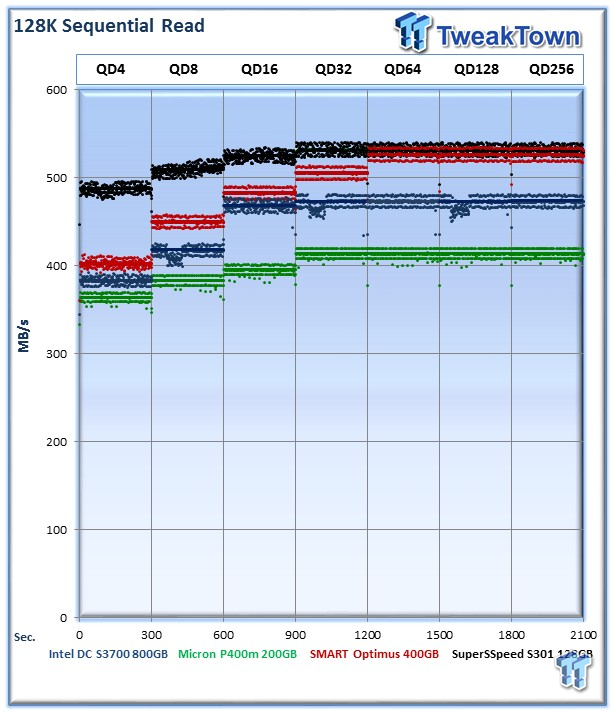
The 128K sequential speeds reflect the maximum sequential throughput of the SSD using a realistic file size actually encountered in an enterprise scenario.
The SuperSSpeed S301 flies high with the SAS-powered Optimus, averaging 531MB/s in 128K sequential read speed at QD256.
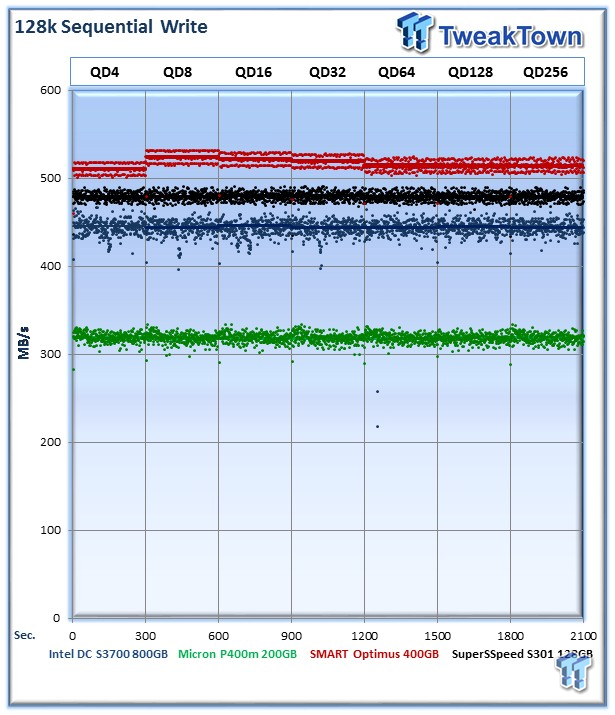
The SuperSSpeed S301 suffers its first loss in a write test with the 128K sequential write test. The S301 falls below the Optimus, averaging 479MB/s.
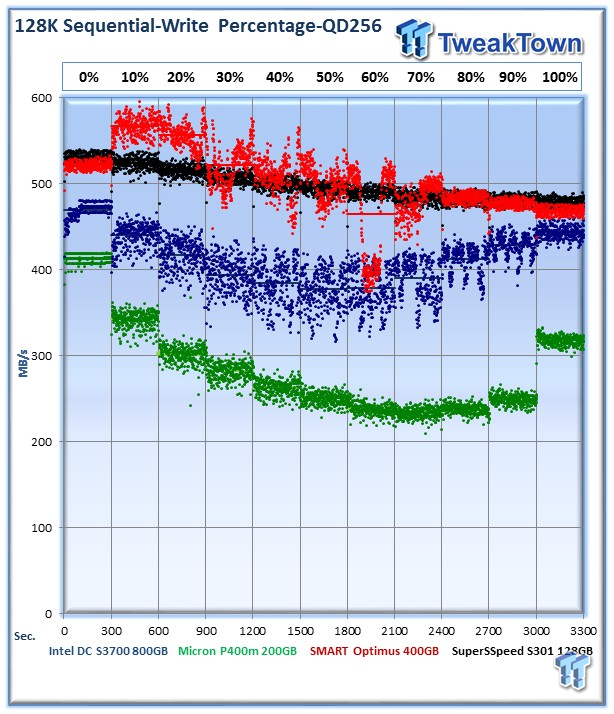
The SuperSSpeed S301 again manages good marks in heavier write workloads in steady state conditions.
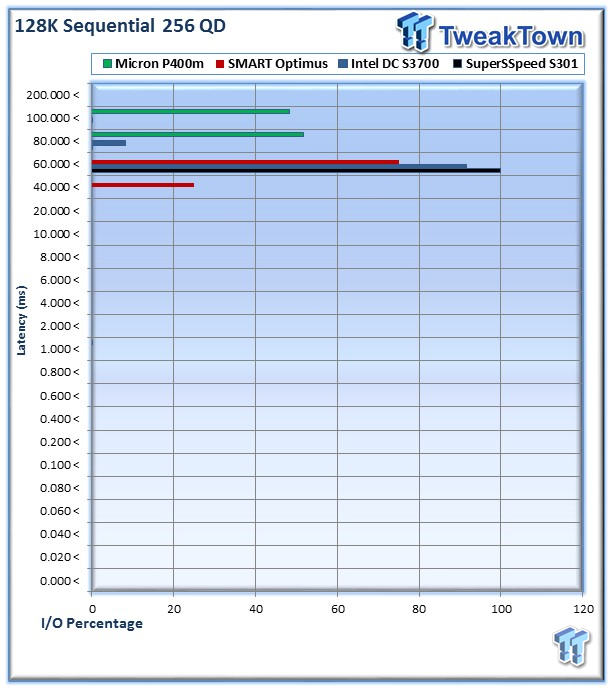
The SuperSSpeed S301 provided 1,146,315 I/Os (99.9%) in the 60-80ms range.
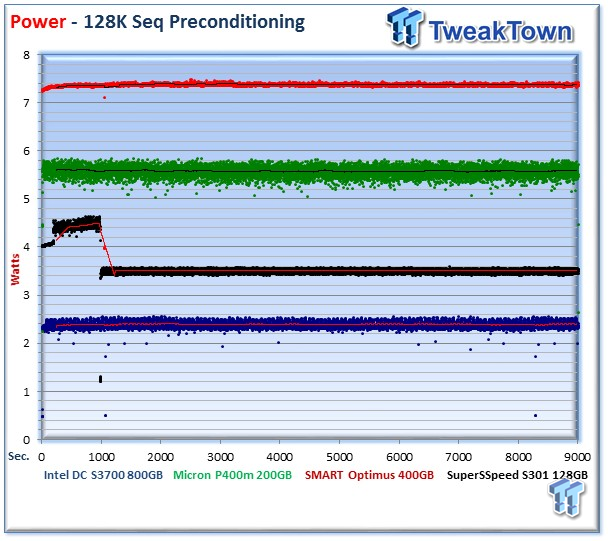
The SuperSSpeed S301 averages 3.5 Watts during the precondition run.
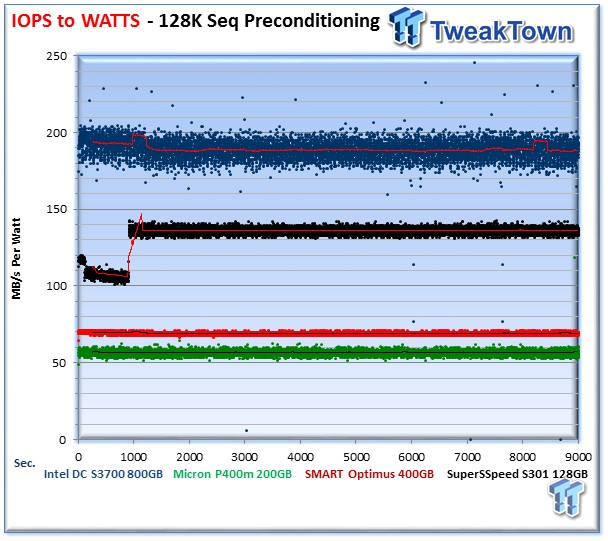
The SuperSSpeed S301 provides an excellent 136 MB/s per Watt.
Database/OLTP and Webserver
Database/OLTP
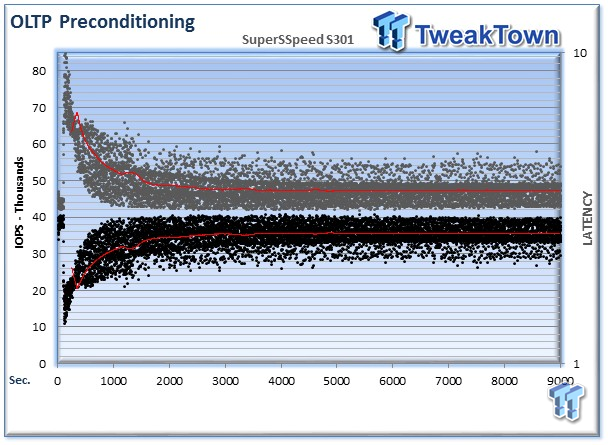
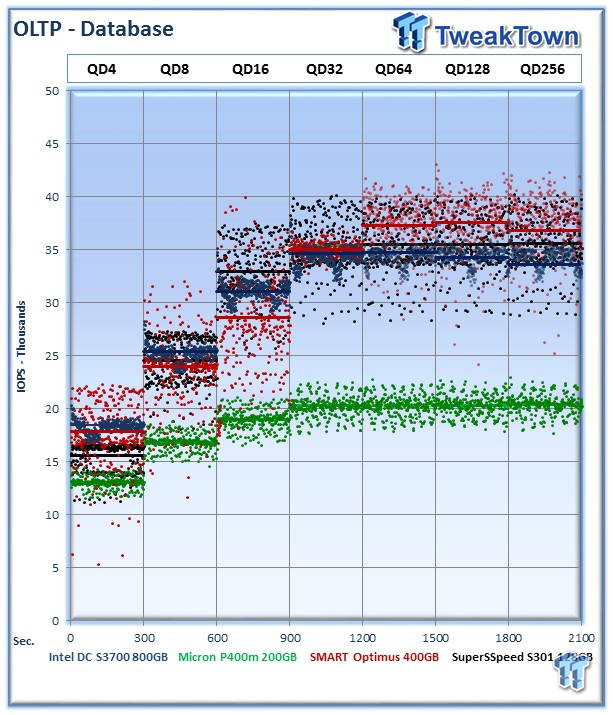
This test emulates Database and On-Line Transaction Processing (OLTP) workloads. OLTP is in essence the processing of transactions such as credit cards and high frequency trading in the financial sector. Enterprise SSDs are uniquely well suited for the financial sector with their low latency and high random workload performance. Databases are the bread and butter of many enterprise deployments. These are demanding 8K random workloads with a 66% read and 33% write distribution that can bring even the highest performing solutions down to earth.
As we begin to delve into our mixed workload benchmarks, it is important to note, again, that we test the SuperSSpeed S301 with 50% compressible data. OLTP and Database workloads tend to be highly compressible, so in real deployment performance may be higher than represented in these tests. Other workloads we test may also tend to have different compression ratios, so it is important to understand the workload and adjust purchasing decisions accordingly.
The SuperSSpeed S301 averages 35,541 IOPS at 256QD. This falls closely into the range of the Optimus and the Intel DC S3700, creating clutter in the test results. The Optimus averages 36,837 IOPS and the DC S3700 averages 33,546 IOPS at QD256. The range of performance with this group is 3,290 IOPS.
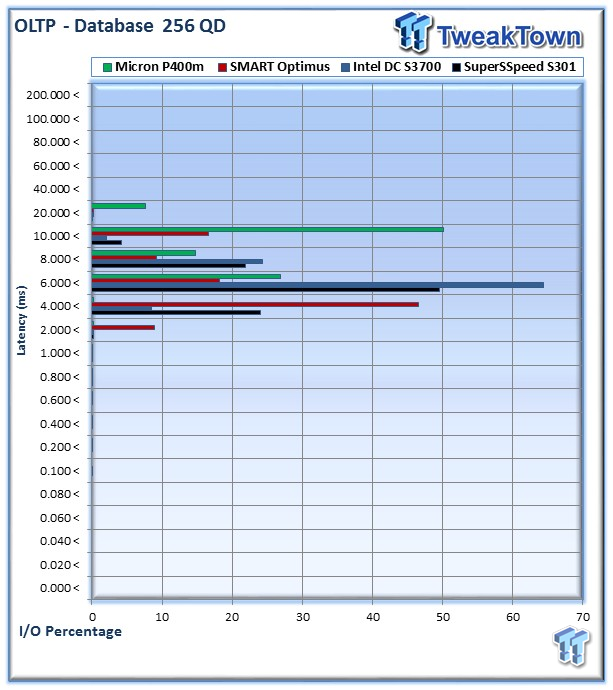
The SuperSSpeed S301 provided 5,262,364 I/Os (49.5%) in the 6-8ms range, 2,550,063 I/Os (24%) at 4-6ms, and 2,324,801 I/Os (21.8%) at 8-10ms.
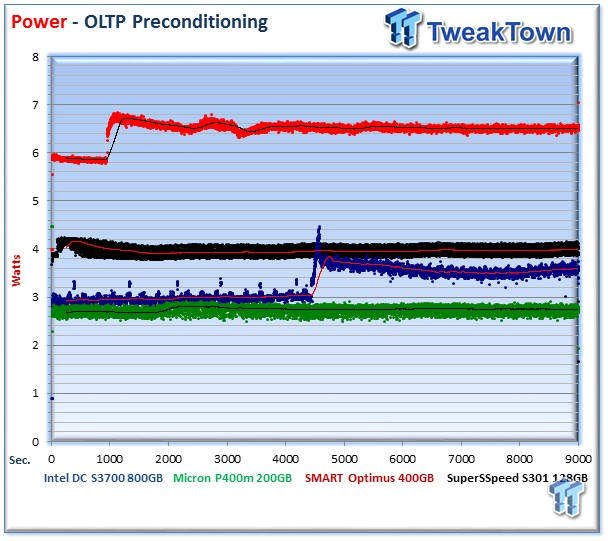
The S301 averages 3.98 Watts during the precondition run.
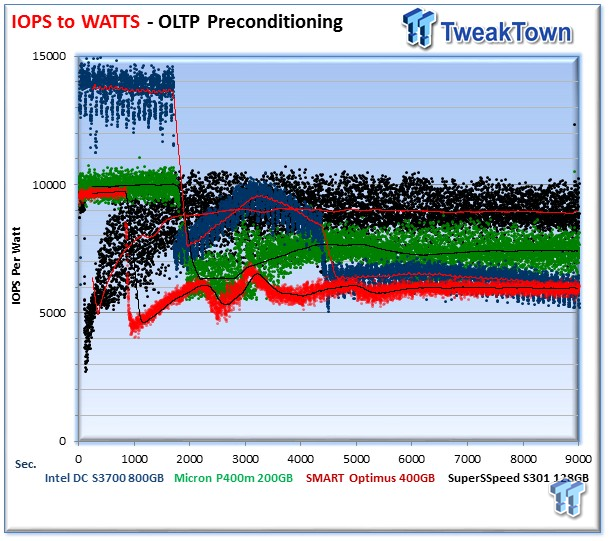
The SuperSSpeed S301 provides an average of 8,939 IOPS per Watt.
Webserver
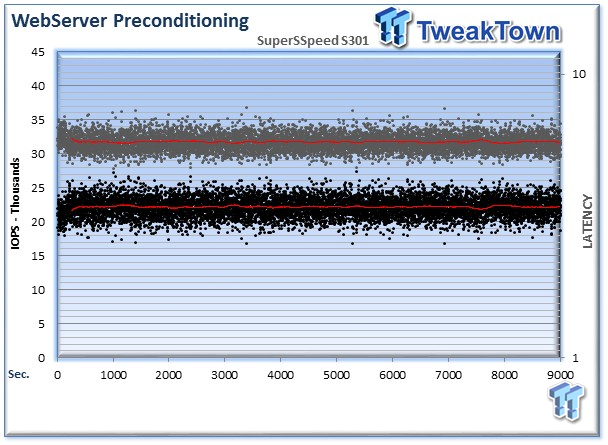
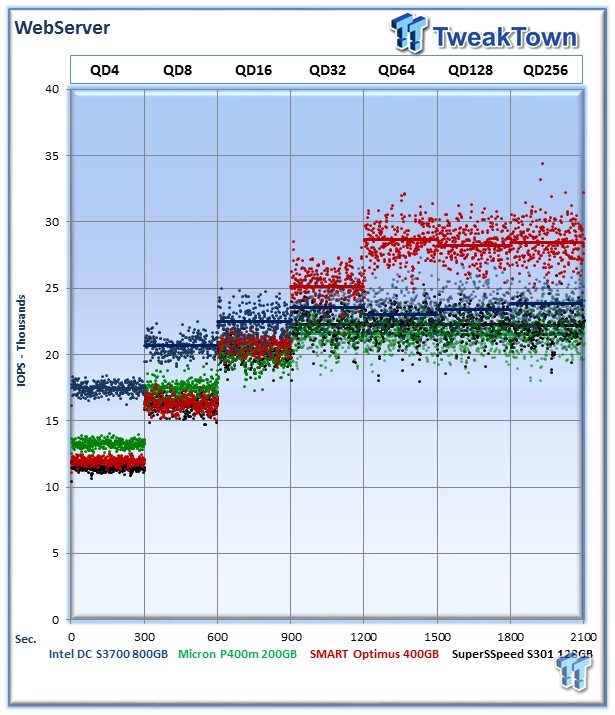
The Webserver profile is a read-only test with a wide range of file sizes. Web servers are responsible for generating content for users to view over the internet, much like the very page you are reading. The speed of the underlying storage system has a massive impact on the speed and responsiveness of the server that is hosting the websites, and thus the end user experience.
The SuperSSpeed S301 again falls into a clustered range of performance making the graph somewhat difficult to read. At 256QD the S301 averages 22,154 IOPS, the P400m 21,533 IOPS and the DC S3700 23,546 IOPS.
The variability between the highest and lowest SSD in this group is a mere 2,000 IOPS, and all three SSDs experience similar performance variability.
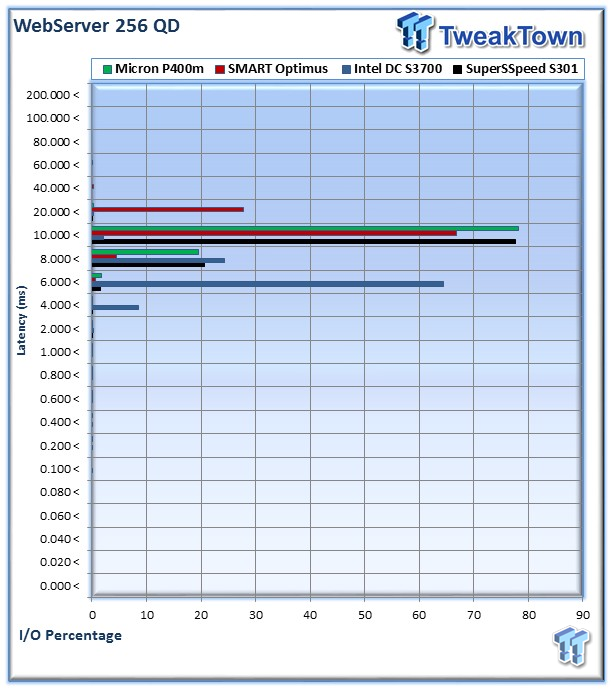
The SuperSSpeed S301 delivered 5,148,957 I/Os (77.7%) in the 10-20ms range and 1,372,885 I/Os (20.7%) at 8-10ms.
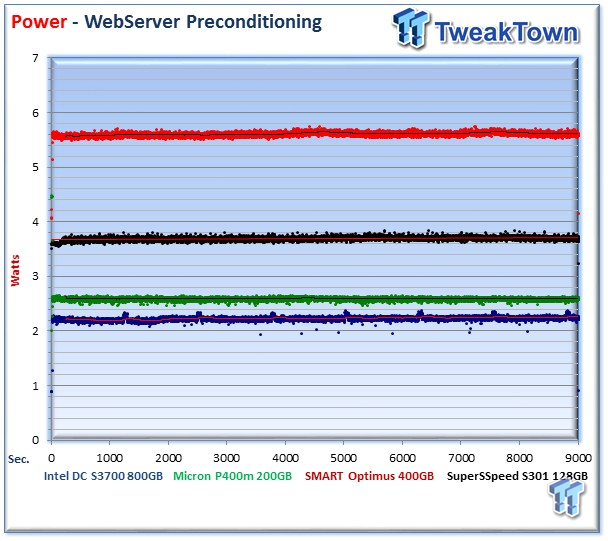
The S301 averages 3.69 Watts during the measurement window.
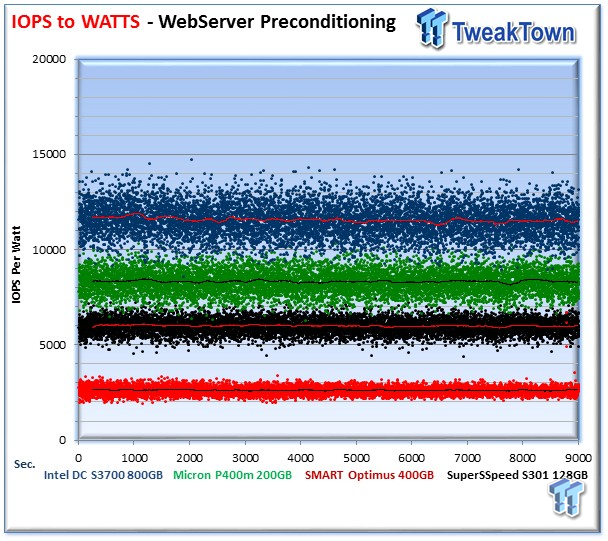
The S301 averages 6,013 IOPS per Watt, among the lowest scores in this test.
Fileserver and Emailserver
Fileserver
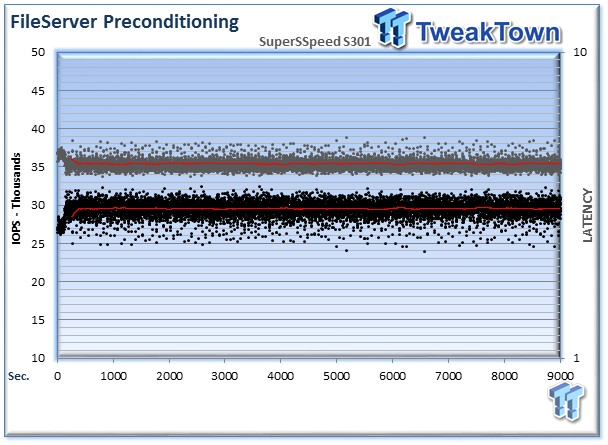
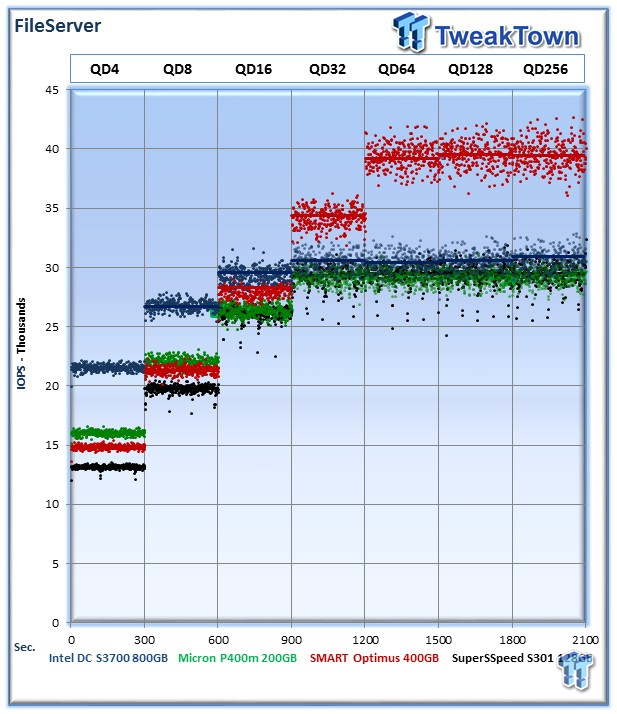
The File Server profile represents typical file server workloads. This profile tests a wide variety of different file sizes simultaneously, with an 80% read and 20% write distribution.
The S301, P400m, and DC S3700 again fall into a tight performance group at the higher Queue Depths, with a difference of less than 1,577 IOPS among the three. The S301 averages 29,518 IOPS, the P400m 29,311 IOPS and the DC S3700 30,888 IOPS.
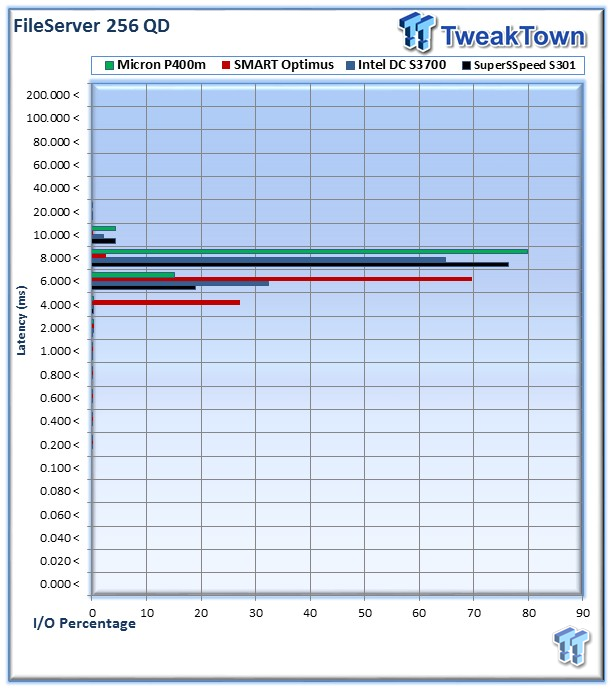
The SuperSSpeed S301 delivered 6,737,967 I/Os (76.3%) in the 8-10ms range, and 1,684,032 I/Os (19%) at 6-8ms.
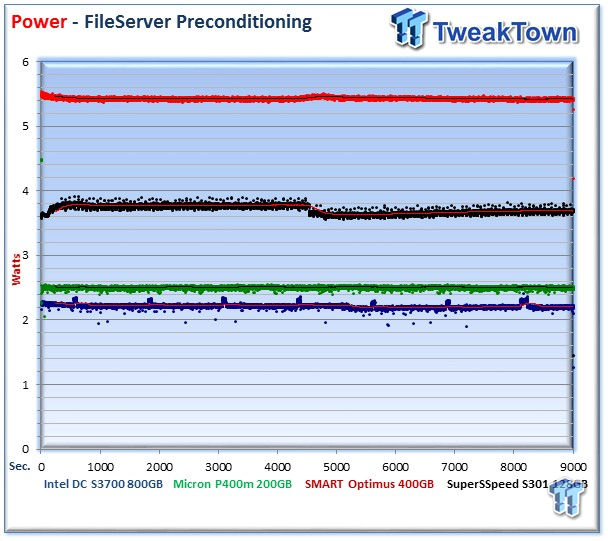
The SuperSSpeed S301 averages 3.68 Watts in steady state.
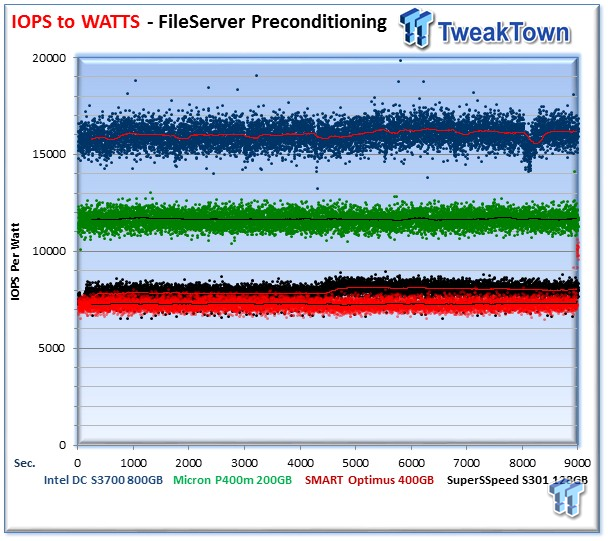
The SuperSSpeed S301 averages 8,044 IOPS per Watt in steady state. This falls into the low end of the chart, and is very close to the Optimus.
Emailserver
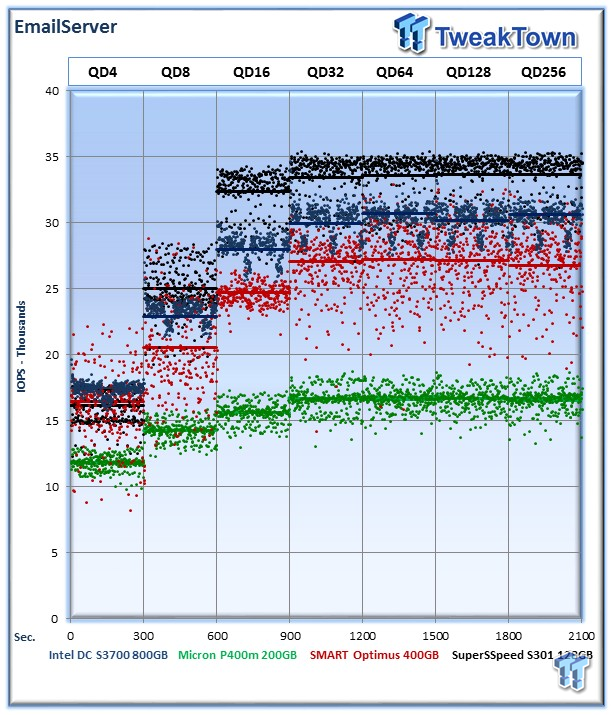
The Emailserver profile is a very demanding 8K test with a 50% read and 50% write distribution. This application is indicative of the performance of the solution in heavy write workloads.
The SuperSSpeed S301 delivers excellent performance in this write-heavy workload, averaging 33,654 IOPS at 256QD.
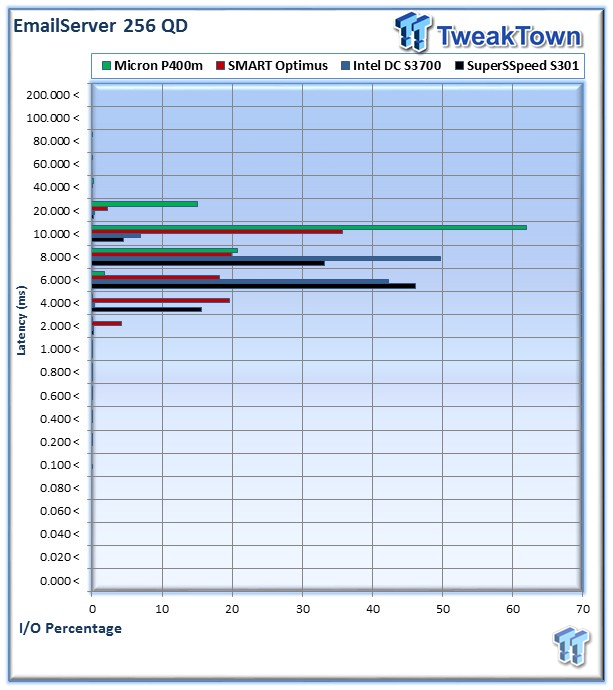
The SuperSSpeed S301 provided 4,648,291 I/Os (46.1%) in the 6-8ms range, 3,339,729 I/Os (33.1%) at 8-10ms, and 1,577,482 I/Os (15.6%) at 4-6ms.
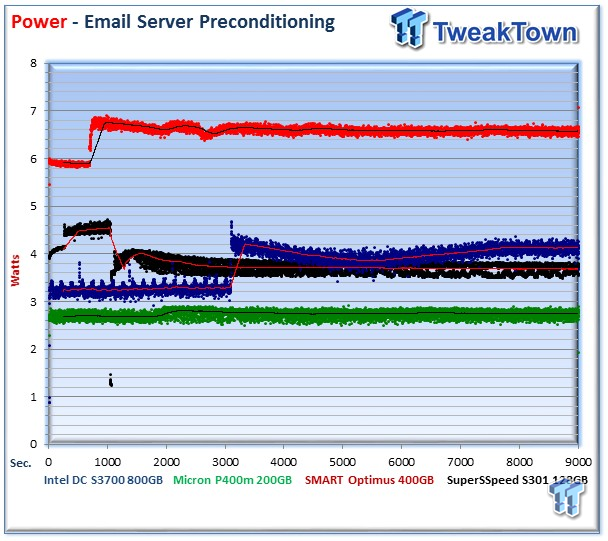
The SuperSSpeed S301 averages 3.68 Watts during the measurement window.
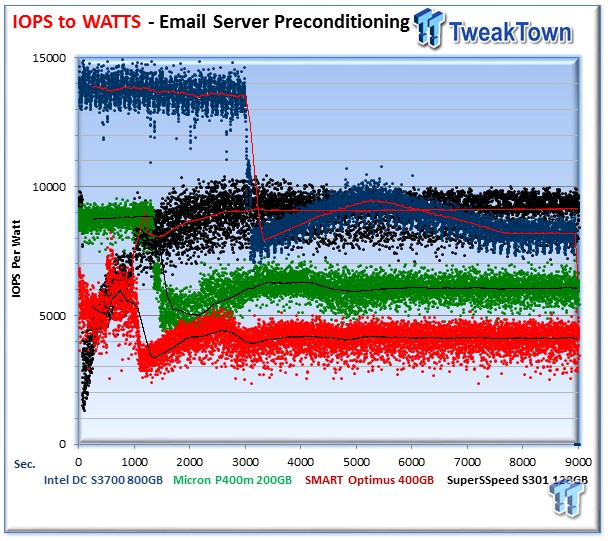
The SuperSSpeed S301 falls slightly above the Intel DC S3700 at 9,136 IOPS per Watt during the measurement window.
Final Thoughts
Users that would consider this product will have the need for tremendous endurance in heavy write workloads. There are a few drawbacks to the use of client hardware in enterprise scenarios. These typically center on performance, endurance and reliability factors.
The SuperSSpeed S301 does not have an official TBW specification, but with its use of SLC NAND, it is a relatively safe assumption that the NAND itself can stand up to the highest endurance requirements. The SuperSSpeed S301 provides enhanced endurance, but delivering top-notch performance in addition to the increased endurance is important.
During our testing, we found that the SuperSSpeed S301 exhibits expected performance characteristics from an SLC product. The S301 dominated the charts in pure write performance in many tests. In mixed read/write workloads, the SuperSSpeed S301 managed to keep pace with the current SATA MLC SSD enterprise leaders. The SAS equipped SMART Optimus managed to beat the S301 in many of the mixed workload tests.
This really speaks volumes to the increase in performance provided by the current crop of MLC SSDs. In previous SSD generations, MLC NAND would have been easily outclassed. The efforts and innovation of SMART, Intel and Micron overcomes, or matches, many of the performance advantages of SLC in typical real-life workloads.
The S301 obviously thrives in heavy write environments, but also provides excellent sequential read speed, averaging 531MB/s in our 128K test.
While the SF-2281 is due for a refresh, it really seems to come into its own when paired with SLC NAND, providing surprisingly good performance in comparison to other current market leaders. It is important to note that the compressibility of data will affect the performance of LSI SandForce processors, but much of the penalty with incompressible data is reduced with SLC NAND.
To deploy the SuperSSpeed S301 into enterprise environments users will need to be willing to sacrifice some of the premium features of enterprise SSDs in order to gain the extra longevity and superb write performance of SLC NAND. The Micron P400m and the SMART Optimus both offer data parity algorithms that significantly reduce exposure to unexpected data loss. All of the competing SSDs also offer protection from host power-loss.
The SuperSSpeed S301 has disabled RAISE, which removes an extra layer of data protection offered by SandForce SSDs. It also does not feature protection from host power-loss, so users would need to use these SSDs with duplicated data or parity environments, and definitely not mission-critical applications.
With the right pricing, an SLC value alternative, such as the SuperSSpeed S301, could create its own space in SMB environments and professional workstations. Another great usage model for this SSD would be in RAID arrays. Current generation RAID controllers have the power to utilize the performance advantages of SSDs, making the use of SSDs in parity environments a reality. SLC NAND and its enhanced endurance will allow the S301 to withstand the extra wear of parity data.
While I doubt that we will see a mass resurgence of SLC in the datacenter, the SuperSSpeed S301 can provide a value alternative, under the right conditions, for those in need of superior write performance and endurance. The price is very competitive at $2 per GB, but there will be a limitation with only one capacity of 128GB currently available.
We applaud SuperSSpeed and Richmax Technology for their innovative approach to a value SLC SSD for the client market, and we would not be surprised if there were some bleed-through into lower-tier enterprise applications.


 United
States: Find other tech and computer products like this
over at
  United
Kingdom: Find other tech and computer products like this
over at
  Australia:
Find other tech and computer products like this over at
  Canada:
Find other tech and computer products like this over at
  Deutschland:
Finde andere Technik- und Computerprodukte wie dieses auf