
Introduction

There seems to be a bit of confusion surrounding Plextor's M5 Pro / Xtreme products. The M5 Pro hit the market several months ago and was one of the first SSDs to use Toshiba's 19nm Toggle NAND. At the time we didn't realize Toshiba already had a newer design in the works. The first 19nm NAND has an 8K page size, the standard we've had for the last few years. The new 16KB page size is the future and will eventually allow for higher density NAND dies and packages.
The Plextor M5 Pro uses the 8K page size design and the new Plextor M5 Pro Xtreme uses the new 16KB page size. That's pretty simple, a change to the BOM and a new tag, but it isn't. Just prior to announcing the M5 Pro Xtreme, Plextor released Xtreme firmware for the original M5 Pro. The Xtreme firmware gives a solid boost across the full spectrum with the largest performance bump coming in the sequential read and write area. This is good news for those who've already purchased a Plextor M5 Pro because with the Xtreme firmware updates, version 1.02 and above, you gain some free performance.

When we reviewed the M5 Pro 256GB the first time with firmware 1.00 we felt as if Plextor held back with the release. In the review, we commented that the M3 Pro performed better in a few key areas. Plextor isn't just sitting back and letting Xtreme 1.02 become the end all be all for M5 Pro either. After finishing this article, Plextor released version 1.03. 1.03 doesn't introduce a radical shift in performance like 1.02 did, but it does increase the efficiency of TRIM so some of our benchmarks might see even higher results.
Specifications, Pricing and Availability

Instead of diving into the specifications we normally talk about, the ones you can easily see above, I want to go into more detail about the new third generation Marvell controller. The Marvell 88SS9187 controller used in the Plextor M5 Pro brings a number of new features to the Marvell brand. SATA 3.1 is fully supported and brings queued TRIM commands to the table, a feature that's been problematic for some controller manufacturers. The amount of time for TRIM to complete under Windows 8 was reduced from Windows 7. By queuing TRIM commands they can perform faster much like native command queuing does for random reads and writes.
Link power management is another new feature, but as you'll see in our article today, this is something Plextor needs to work on a bit more. The M5 Pro and M5 Pro Xtreme use quite a bit of power, more than OCZ's Vector and Samsung's 840 Pro, despite Plextor's claims of the lowest active and stand-by power consumption at this performance level.

The Marvell 88SS9187 is an 8-channel controller that now features AES-256 bit encryption. The onboard error correction is now 128-bit, an improvement on the previous 88SS9174 controller used in a number of SSDs.

We hit Newegg to check out the current prices and to see if the new Xtreme model hit US shores yet. It looks like Plextor is just about sold out of first generation M5 Pro drives; there are a few 256GB models left at $209.99. The 128GB and 512GB are sold out, at least for now. We also observed zero Xtreme models listed.
The M5 Pro 256GB, the same model we're using to evaluate the new firmware is quite a deal at $209.99. It's cheaper than OCZ's Vector 256GB ($237.99) and Samsung's 840 Pro 256GB ($229.99). All three drives share the same five year warranty so warranty isn't a factor when making your purchasing decision.
Plextor M5 Pro SSD

We're using an abbreviated format today since we've already published a full review of the Plextor M5 Pro. In a few days our M5 Pro Xtreme review will hit the cover of TweakTown and we'll go back to the normal format.


The original M5 Pro uses NAND in a BGA package. The new Xtreme drive uses TSOP (Thin Small-Outline Packages) or to make it easy to understand what I'm talking about, the little fingers off to the side that transmit the power and data.
Benchmarks - Test System Setup and ATTO Baseline Performance
Desktop Test System

Lenovo W530 - Mobile Workstation
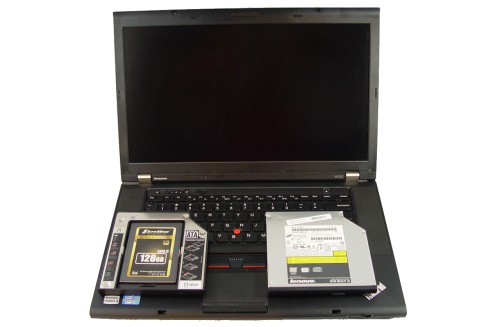
We use two systems for SSD testing. The desktop runs a majority of the tests and the Lenovo W530 runs the notebook power tests as well as the real-world file transfer benchmark.
ATTO Baseline Performance
Version and / or Patch Used: 2.34
ATTO is used by many disk manufacturers to determine the read and write speeds that will be presented to customers.

The M5 Pro with the new Xtreme 1.02 firmware starts out strong, but we don't see much of a difference between 1.02 and the original 1.0 firmware in this test. Some tests aren't going to show a dramatic difference, but others will.
Benchmarks - Sequential Performance
HD Tune Pro
Version and / or Patch Used: 4.00
Developer Homepage: http://www.efdsoftware.com
Product Homepage: http://www.hdtune.com
HD Tune is a Hard Disk utility which has the following functions:
Benchmark: measures the performance
Info: shows detailed information
Health: checks the health status by using SMART
Error Scan: scans the surface for errors
Temperature display
HD Tune Pro gives us accurate read, write and access time results and for the last couple of years has gained popularity amongst reviewers. It is now considered a must have application for storage device testing.
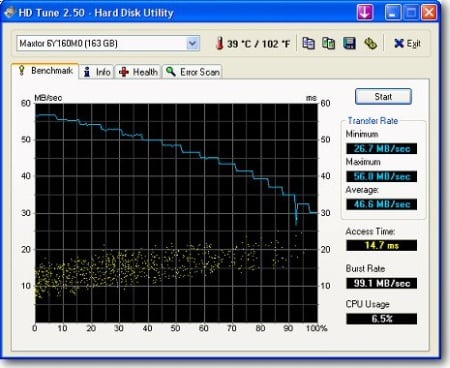

Just as we stated, some benchmarks will show a substantial improvement like this one that uses sequential reads to stress the drive. The new firmware puts the M5 Pro in the same league with the 840 Pro 256GB, at least in this test. OCZ's Vector looks weak in this test, but OCZ tiers their single queue depth reads so you have bandwidth when multitasking applications.

The single queue depth write performance hasn't improved much with the new Xtreme firmware, but there was a noticeable improvement.
HD Tach - Sequential Write Performance after Random Writes

The performance following heavy random writes has historically been an issue with most SSDs using Marvell hardware. The M5 Pro has tamed the issue quite a bit, but it's still not in the same class as LSI SandForce controllers. When shopping for an SSD though you want the best all around solution and not just corner case performance unless you are looking to enhance a specific application.
Benchmarks - AIDA64 Random Access Time
AIDA64 Random Access Time
Version and / or Patch Used: 1.60
Developer Homepage: http://www.aida64.com
Product Homepage: http://www.aida64.com
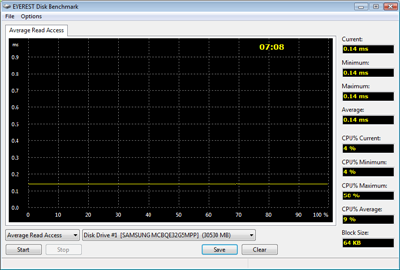
AIDA64 offers several different benchmarks for testing and optimizing your system or network. The Random Access test is one of very few if not only that will measure hard drives random access times in hundredths of milliseconds as oppose to tens of milliseconds.
Drives with only one or two tests displayed in the write test mean that they have failed the test and their Maximum and possibly their Average Scores were very high after the cache fills. This usually happens only with controllers manufactured by Jmicron..

The read latency increased with the new firmware, but the large DRAM cache for table data has always given Marvell controllers low latency performance in this test.

The write latency decreased and that helped Plextor get the M5 Pro into the 100K IOPS range.
Benchmarks - Anvil Storage Utilities
Anvil Storage Utilities
Version and / or Patch Used: RC6
So what is Anvil Storage Utilities? First of all, it's a storage benchmark for SSDs and HDDs where you can check and monitor your performance. The Standard Storage Benchmark performs a series of tests, you can run a full test or just the read or the write test or you can run a single test, i.e. 4K DQ16.
Anvil Storage Utilities is not officially available yet but we've been playing with the beta for several months now. The author, Anvil on several international forums has been updating the software steadily and is adding new features every couple of months.
The software is used several different ways and to show different aspects for each drive. We've chosen to use this software to show the performance of a drive with two different data sets. The first is with compressible data and the second data set is incompressible data. Several users have requested this data in our SSD reviews.
0-Fill Compressible Data

Incompressible Data

The Plextor M5 Pro doesn't discriminate between compressible and incompressible data. The two screenshots above show nearly identical performance between the two data types.
Read IOPS through Queue Depth Scale

We don't have performance data with some of the newer benchmarks on the old firmware. We just jumped right in with the new firmware and forgot about the newest tests.
Even though they all use different controllers and NAND flash, the top performing enthusiast class SSDs all have a common marketing point, 100K IOPs. High IOPS at high queue depths is a nice marketing point for enterprise class SSDs, but consumer SSDs rarely reach a queue depth of 32, the limit for SATA.
The lower queue depths are where most of us need high IOPS performance.
Scaling Write IOPS through Queue Scale

You may have noticed that the Plextor M5 Xtreme 256GB is on the charts today as well. The larger page size works against IOPS performance, but increases sequential performance. It works a lot like RAID stripe sizes, larger gives better sequential while smaller gives better random performance.
Benchmarks - CrystalDiskMark
CrystalDiskMark
Version and / or Patch Used: 3.0 Technical Preview
Developer Homepage: http://crystalmark.info
Product Homepage: http://crystalmark.info/software/CrystalDiskMark/index-e.html
Download here: http://crystaldew.info/category/software/crystaldiskmark
CrystalDiskMark is a disk benchmark software that allows us to benchmark 4K and 4K queue depths with accuracy.
Key Features:-
* Sequential reads/writes
* Random 4KB/512KB reads/writes
* Text copy
* Change dialog design
* internationalization (i18n)
Note: Crystal Disk Mark 3.0 Technical Preview was used for these tests since it offers the ability to measure native command queuing at 4 and 32.

It's amazing how far 4K read and write speeds have went up over the last three years. When SSDs first started making it to mainstream users, 20MB/s of 4K read performance was enthusiast class. Now, 40MB/s is the magic number everyone is shooting for (as measured in this test, IOMeter results are a little lower).

The new firmware gives a slight performance increase in 4K writes. The increased performance scales well as queue depth is increased.
Benchmarks - PCMark Vantage Hard Disk Tests
PCMark Vantage - Hard Disk Tests
Version and / or Patch Used: 1.0.0
Developer Homepage: http://www.futuremark.com
Product Homepage: http://www.futuremark.com/benchmarks/pcmark-vantage/

PCMark Vantage is the first objective hardware performance benchmark for PCs running 32 and 64 bit versions of Microsoft Windows Vista. PCMark Vantage is perfectly suited for benchmarking any type of Microsoft Windows Vista PC from multimedia home entertainment systems and laptops to dedicated workstations and high-end gaming rigs. Regardless of whether the benchmarker is an artist or an IT Professional, PCMark Vantage shows the user where their system soars or falls flat, and how to get the most performance possible out of their hardware. PCMark Vantage is easy enough for even the most casual enthusiast to use yet supports in-depth, professional industry grade testing.
FutureMark has developed a good set of hard disk tests for their PCMark Vantage Suite. Windows users can count on Vantage to show them how a drive will perform in normal day to day usage scenarios. For most users these are the tests that matter since many of the old hat ways to measure performance have become ineffective to measure true Windows performance.

HDD1 - Windows Defender
HDD2 - Gaming
HDD3 - Windows Photo Gallery
HDD4 - Vista Startup
HDD5 - Windows Movie Maker
HDD6 - Windows Media Center
HDD7 - Windows Media Player
HDD8 - Application Loading
Even though some of the tests have decreased with the new firmware, the overall chart has fluffed up and dense. It's a nice overall increase.
Benchmarks - PCMark Vantage - Drives with Data Testing
For a complete breakdown on the Drives with Data Testing please read this article. You will be able to perform this test at home with the files provided in the article - full instructions are included.
- Brief Methodology
SSDs perform differently when used for a period of time and when data is already present on the drive. The purpose of the Drives with Data testing is to show how a drive performs in these 'dirty' states. SSDs also need time to recover, either with TRIM or onboard garbage collection methods.
Drives with Data Testing - 25%, 50%, 75% Full States and Dirty / Empty Test
Files needed for 60 (64GB), 120 (128GB), 240 (256GB)
60GB Fill - 15GB, 30GB, 45GB
120GB Fill - 30GB, 60GB, 90GB
240GB Fill - 60GB, 120GB, 160GB
Empty but Dirty - a test run just after the fill tests and shows if a drive needs time to recover or if performance is instantly restored.

SSDs slow when data resides on the NAND and because of that, we created the fill test. Using the 50% of NAND capacity full to gauge performance, the new firmware does slightly better than the launch firmware. The Samsung 840 Pro still takes the crown in this capacity size, though.
Benchmarks - BootRacer
BootRacer - System Boot Time
Version and / or Patch Used: 4.0
Developer Homepage: Greatis
Product Homepage: BootRacer
Download here: http://www.greatis.com/bootracer/download.htm
Note: In this test we use the Lenovo W530 Mobile Workstation loaded with an operating system and several program files. The data on the drive at the time of the test is 45GB. The second test, 50GB Free, was run with the drives filled with block data until only 50GB of free capacity remained.

Our time to desktop test, a timed reboot that uses the computers built in timing, shows that most of the top performing consumer SSDs perform about the same.
Benchmarks - DiskBench
DiskBench - Directory Copy
Version and / or Patch Used: 2.6.2.0
Developer Homepage: Nodesoft
Product Homepage: DiskBench
Download here: http://www.nodesoft.com/diskbench/download
Note: In this test we use the Lenovo W530 Mobile Workstation and a SuperSSpeed S301 SLC 128GB SSD to move a 15GB block of data to and from the target drive. This is part of our real world test regiment. Roughly 45GB of data resides on the target drive before the '15GB Block' is transfer. The 15GB Block is the same data we built for the Data on Disk Testing and is a mix of compressible and incompressible data.

Copying data to and from the target SSD though still shows a bit of variation.
Benchmarks - Power Testing
Bapco MobileMark 2012 1.5
Version and / or Patch Used: 2012 1.5
Developer Homepage: http://www.bapco.com
Test Homepage: http://www.bapco.com
MobileMark 2012 1.5 is an application-based benchmark that reflects usage patterns of business users in the areas of office productivity, media creation and media consumption. Unlike benchmarks that only measure battery life, MobileMark 2012 measures battery life and performance simultaneously, showing how well a system design addresses the inherent tradeoffs between performance and power management.

This test still has me scratching my head. When MyDigitalSSD switched over to the new Toshiba 19nm NAND with 16KB page sizes they gained a lot of battery time. Granted, they also radically changed their firmware, but we assumed the NAND played a larger part in the increased battery performance.
Here we see the M5 Pro and the M5 Xtreme, both in 256GB capacity size, and the Xtreme where the new flash actually performed a little worse than the Pro with the older flash.
Of the drives shown, the Plextor M5 Pro and Extreme trailed all of the other drives in battery life.
PCMark Vantage HDD Test - Power Draw

Looking at the trace from PCMark Vantage we get a better understanding why the M5 Pro and Xtreme draw so much battery power. These two drives pull more power while in use than anything else does on the chart.
Final Thoughts

Even though we already reviewed the Plextor M5 Pro, we're still going to score it again today. Quite a bit has changed since its release and our initial review. The new firmware has increased the performance in a number of areas and the price has dropped a bit as well.
The only down side is the availability. There are only a few of these drives left for sale because Plextor has already ramped up production of the new model with the latest 19nm Toshiba Toggle NAND. Those with an eagle eye already compared the new Xtreme to the original Pro since the data made it into the charts today. In many of the tests the old M5 Pro with the Xtreme firmware update performed just as well as the new M5 Xtreme. What we don't know is the price of the new Xtreme model.
With the M5 Pro 256GB selling today for $209.99 and the Xtreme price unknown, the last few Pro models may be a better value. We really can't say though because Newegg and Google came up empty on the Xtreme price.
Don't count the Xtreme off your list just yet, though. We didn't touch on it much in this review, but in a few days we'll discuss the new features in the Xtreme programming that increases the garbage collection aggressiveness.

 United
States: Find other tech and computer products like this
over at
United
States: Find other tech and computer products like this
over at  United
Kingdom: Find other tech and computer products like this
over at
United
Kingdom: Find other tech and computer products like this
over at  Australia:
Find other tech and computer products like this over at
Australia:
Find other tech and computer products like this over at  Canada:
Find other tech and computer products like this over at
Canada:
Find other tech and computer products like this over at  Deutschland:
Finde andere Technik- und Computerprodukte wie dieses auf
Deutschland:
Finde andere Technik- und Computerprodukte wie dieses auf  Synopsys and Samsung achieve production tapeout of next-gen Exynos SoC on new 3nm process node
 Windows 11 could get some big changes: Start menu 'companions' and Copilot in Settings
 The iPhone 16 Pro could have a 20% brighter display than your boring old iPhone 15 Pro
 New iPhone 16 dummy unit leak shows off its refreshed camera design and more
 Corsair 6500X Mid-Tower Dual Chamber Chassis Review
 Corsair MP700 Pro SE 4TB SSD Review - As Fast as They Come
 Corsair MP600 Mini 2024 Edition 1TB SSD Review - Fastest Tiny Drive on the Planet
 Lexar SL500 1TB Portable SSD Review - The best of native USB
 Corsair Platform:6 Elevate Modular Desk Review
 4K Blu-ray Review") True Lies (1997) 4K Blu-ray Review
True Lies (1997) 4K Blu-ray Review Fractal Design North XL Full-Tower Chassis Review
 Western Digital WD Gold 24TB HDD Review - High-Capacity Masterpiece
 AOC U27G3X 27-inch Gaming Monitor Review - 4K 160Hz for $500
 MSI Vector GP68HX Gaming Laptop Review
 Building the Ultimate Home Entertainment Server with an ASUSTOR NAS and Viper Gaming NVMe SSDs
 Everything you need to know about the latest ASUS NUC Mini PCs - NUC 14 Pro and ROG NUC
 How to Overclock Your GPU and Boost Your PC Gaming with ASUS GPU Tweak III
 ASUS's AMD Radeon RX 7000 Series GPU lineup has something for every gamer
 ASUS OLED Premium Care defends the ROG Swift OLED PG32UCDM gaming monitor from burn-in