

The Bottom Line
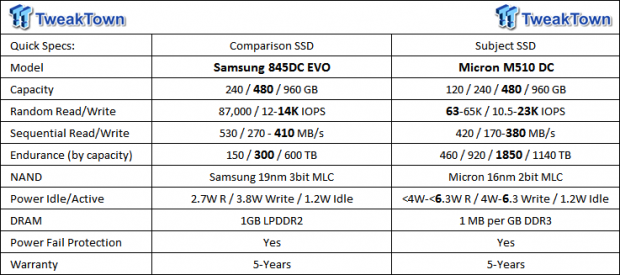
Introduction and Quick Specs
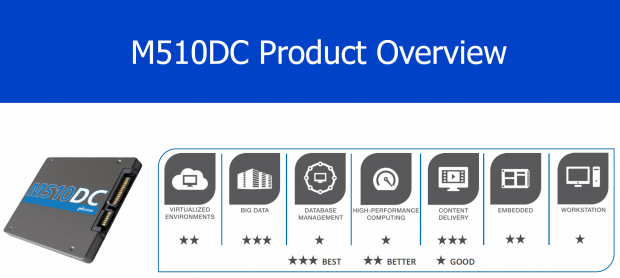
Recently released data reveals that two-thirds of SSDs utilized in today's datacenters require an endurance rating of 1 drive write per day (DWPD) or less. To address these read-centric workloads, Micron is introducing the M510DC. Micron's M510DC fills the need for a high performance read-centric datacenter storage solution.
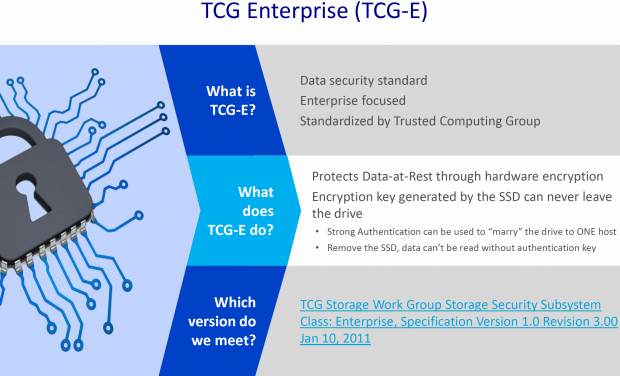
Micron's M510DC SATA III Enterprise SSD is a cost effective solution aimed at accelerating the transition from legacy HDDs to high performance all flash-based datacenter storage. Compared to HDDs, SSDs reduce storage bottlenecks by decreasing workload latency and massively increasing data throughput. Micron is marketing the M510DC as the first of its kind SSD with true TCG Enterprise level encryption. Enterprise level encryption is critical for banking, government, and medical industries. We have all witnessed data breaches and the devastating impact they have on these industries.
Micron has a large and diverse portfolio of non-volatile solid-state storage solutions. Micron's SATA portfolio includes the Crucial/Micron BX100 and MX200 for aftermarket client upgrades, the M600 for OEM Client Solutions, and the M510DC and M500DC for Enterprise Cloud/Web 2.0 storage applications. Micron's PCIe portfolio is comprised of the P420m for mission critical storage and the P320h for IO acceleration. In comparison to competing solutions, Micron rates the M510DC as having very good endurance, very good 128K sequential read/write performance, very good 4K random write performance, and an excellent price point. With far more endurance than competing TLC solutions and a lower price point than competing MLC solutions, the M510DC is an attractive option for read-centric datacenter applications with a 1-2 DWPD storage requirement.
We are seeing a transition to solutions that are more economical as SSDs become more prevalent in the datacenter. The M510DC follows this trend with a low price point, while at the same time employing a rich enterprise feature set. Designed for read-centric workloads, the M510DC will find its way into the datacenter, serving roles such as boot drives, VDI applications, content delivery and cloud storage. Micron states the M510DC is in production now and selling directly to datacenter equipment manufacturers through Micron's distribution partners.
The M510DC is a spinoff of the highly successful M500DC, with the only physical difference being the flash node. The M500DC employs higher performance, higher endurance 20nm planar NAND, and the M510DC employs more economical 16nm planar NAND. The M510DC comes in a 2.5" standard form factor. Endurance ratings and performance vary by capacity. Capacities offered include 120, 240, 480, and 960GB models.
Micron M510DC 480GB Internals and Specifications
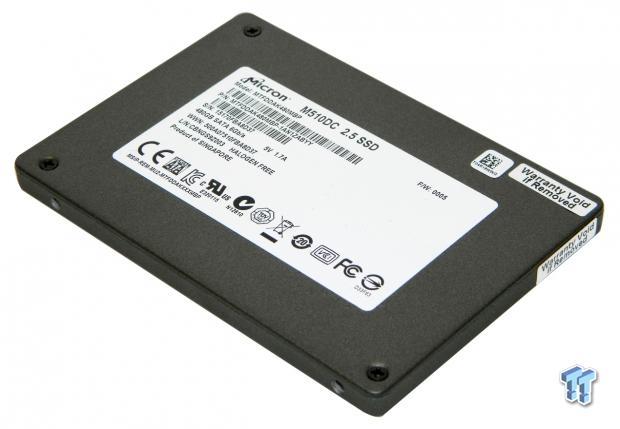
Micron M510DC 480GB Internals
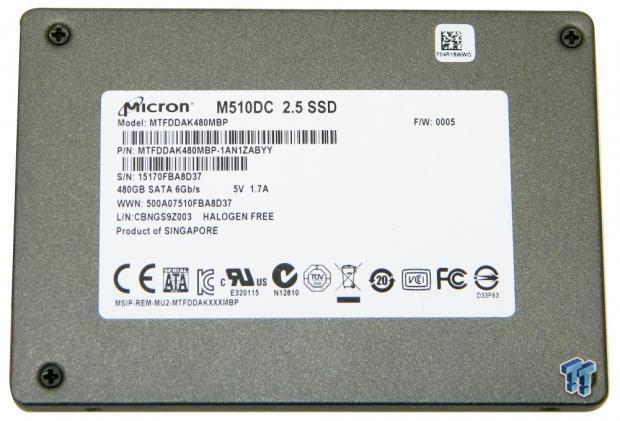
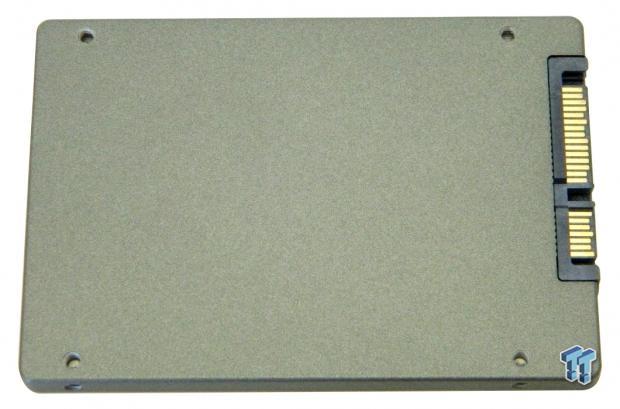
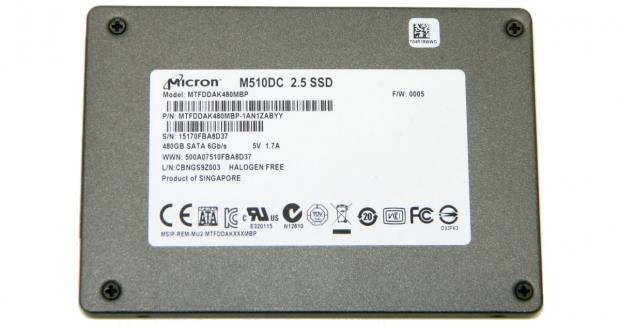
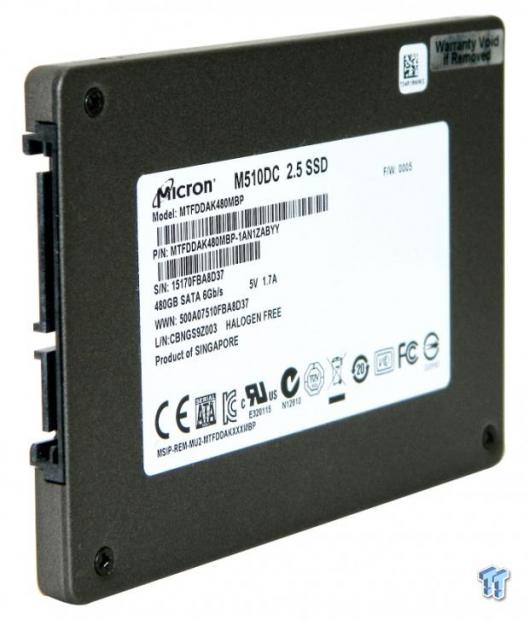
The drive's enclosure is typical Micron. Formed from both sheet and cast aluminum alloy, the 2.5"x 7mm enclosure is grey in color with an industrial style textured finish.
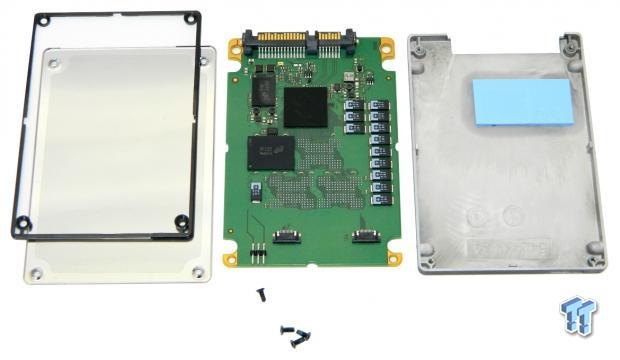
With the drive disassembled, we see there is a plastic spacer that separates the two halves of the drive's enclosure. We also note a blue thermal pad located on the cast half of the enclosure. The thermal pad contacts the drive's controller and DRAM package.
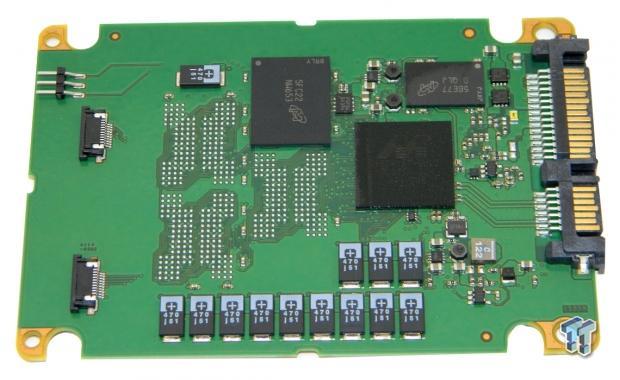
The M500DC and M510DC both employ the same PCB. The only difference between the two is the flash node. This half of the green PCB houses the drive's 8-channel Marvell 88SS9187 controller, one of the drives two 512MB DRAM packages, one of the drives five flash packages and all thirteen of the drives tantalum capacitors. In contrast to the M500DC, the M510DC employs 128GB less over provisioning with a RAW total capacity of 640GB for the 480GB model.
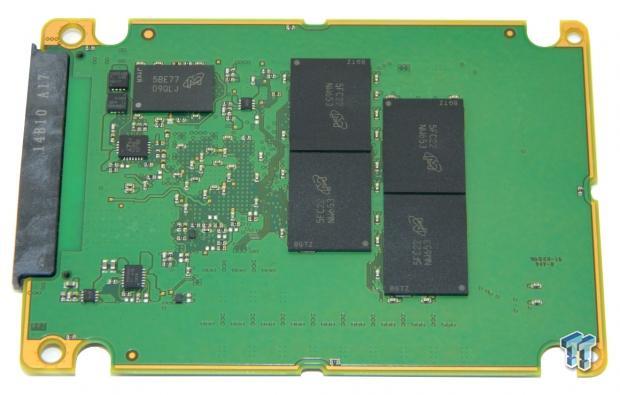
This half of the PCB houses the second of the drive's two 512MB DDR3 DRAM packages and the remaining four of the drive's five flash packages.
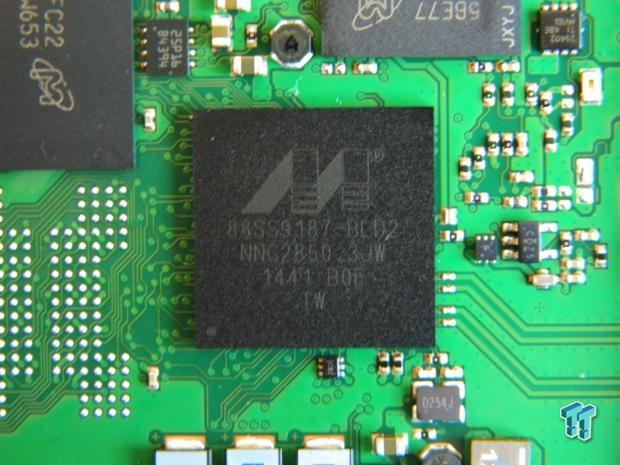
A close-in view of the M510DC's 8-channel Marvell 88SS9187-BLD2 controller.
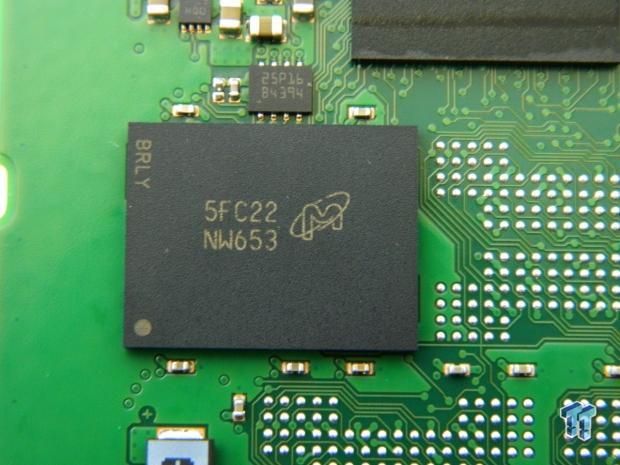
A close-in view of one of the drive's five 128GB (640GB Total) 16nm flash packages. Each package contains eight 128Gbit dies.
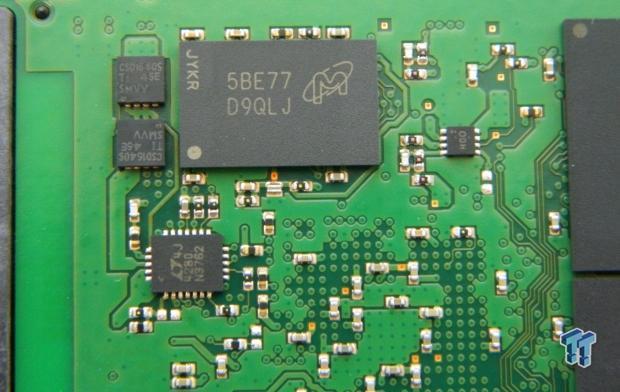
A close-in view of one of the drives two 512MB (1GB total) DDR3 -1600 DRAM packages.
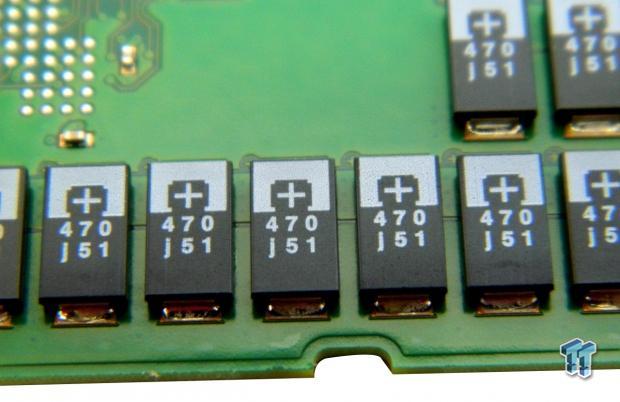
Lastly, a close-in view of some of the drives tantalum capacitors.
Specifications and Features M510DC 480GB SATA III SSD
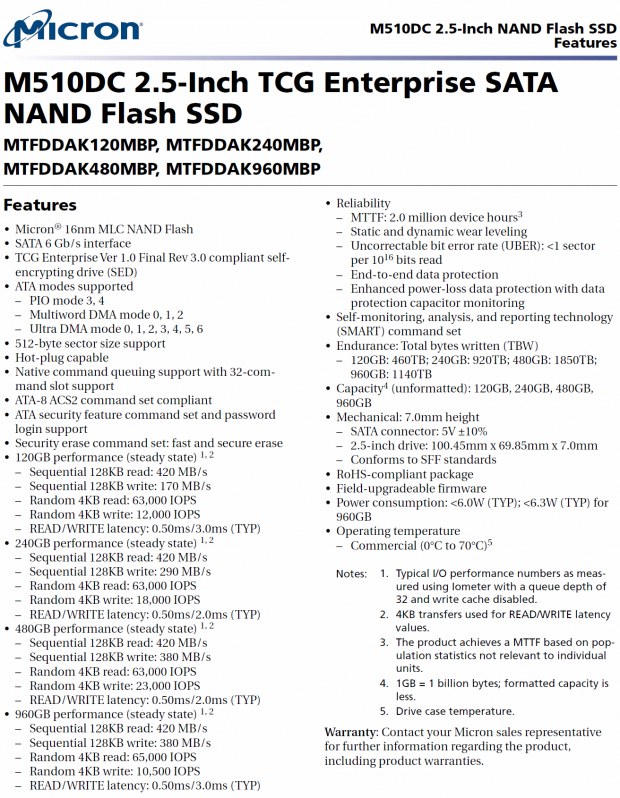
We are going to go over the 480GB M510DC's specifications, for other capacities please refer to the above mfg. spec sheet. The Micron M510DC 480GB SATA III Enterprise SSD comes in a 2.5"x 7mm standard form factor.
Features include a 6 Gb/s SATA interface, all ATA modes are supported, TCG Enterprise encryption, 512-byte sector size support, Hot-plug capable, NCQ support for 32 command slot support, ATA-8 ACS2 compliant and Security erase command set: fast and secure erase.
M510DC 480GB (steady state) performance specs:
- Sequential 128KB read: 420 MB/s
- Sequential 128KB write: 380 MB/s
- Random 4KB QD32 read: 63,000 IOPS
- Random 4KB QD32 write: 23,000 IOPS
- Read/Write latency: 0.50ms/3.0ms (typical)
Reliability: MTTF 2 million device hours, Static and dynamic wear leveling, UBER <1 sector per 1.0e16 bits read, End-to-end data protection, Enhanced power-loss protection, SMART monitoring.
Endurance: TBW (Total Bytes Written): 480GB = 1850TB
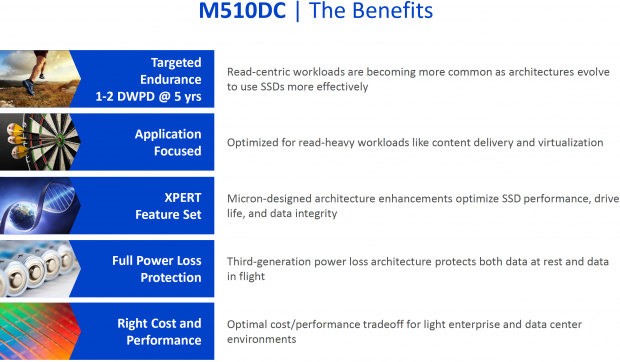
Micron Storage Executive management suite provides access to drive management, health monitoring, and secure erase capabilities. Micron fortifies the M510DC with reliability features through their XPERT storage architecture and power-loss protection.
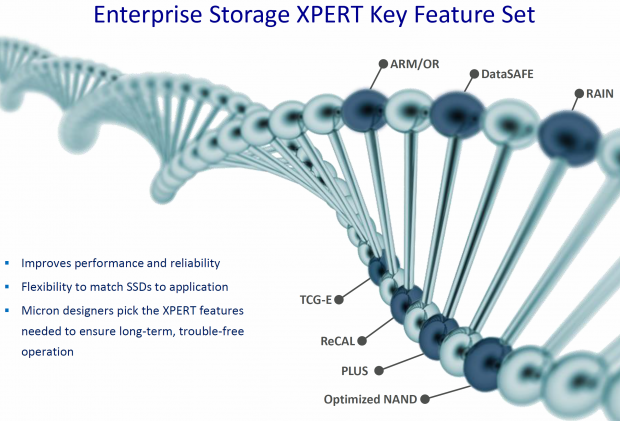
Micron's Enterprise Storage XPERT Key feature set:
- Redundant Array of Independent NAND (RAIN) -Parity based data protection
- DataSAFE - Provides for data path protection though metadata and ECC
- Reduced Command Access Latency (ReCAL) - Reduces maximum write latency and manages flash wear for consistent performance
- Adaptive Read Management/Optimized Read (ARM/O) - Dynamic NAND tuning for optimized read performance
Test System and Methodology
Test System Configuration & Testing Methodology
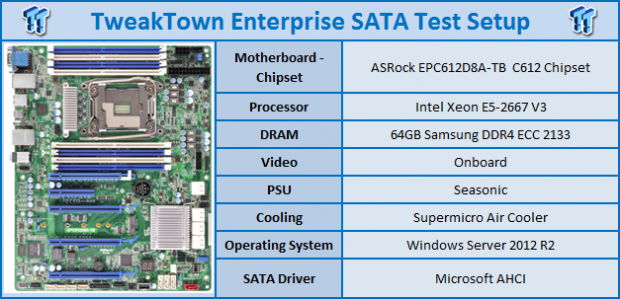
We would like to thank the following companies: ASRock, Crucial, Intel, Samsung, Seagate, and Seasonic for making our test system possible.
TweakTown's Enterprise SSD testing methodology is based upon replicating server environments as closely as possible. This means our test systems are composed of strictly server based hardware. Server motherboards, Xeon processors, ECC DRAM, and standard server air cooling. All settings in the system BIOS and within the Operating System are completely stock. Storage drivers are Windows standard drivers, except as otherwise required for the test device to operate as designed.
TweakTown strictly adheres to industry accepted Enterprise Solid State Storage testing procedures. Each individual test we perform repeats the same sequence of the following four steps:
- Secure Erase SSD
- Write entire capacity of SSD a minimum of 2x with 128KB sequential write data, seamlessly transition to next step
- Precondition SSD at maximum QD measured in step four (QD32 for SATA, QD256 for PCIe) with the test specific workload for a sufficient amount of time to reach a constant steady-state, seamlessly transition to next step
- Run test specific workload for 5-minutes at each measured Queue Depth, record results
We chart workload preconditioning IOPS or MB/s and latency for each specific test. We plot workload preconditioning using scatter charts with each recorded 1-second data point represented on the chart. This allows us to see some of the performance variability exhibited by our test subjects. We chart workloads using line charts plotting average workload IOPS or MB/s and latency at each measured QD. Utilizing line charts provides a good visual perspective of the test subject's performance curve.
To summarize, we test with 100% Server hardware, Server Operating System and we strictly adhere to industry accepted Enterprise SSD testing procedures. Our goal is to provide results that are consistent, reliable, and repeatable.
Benchmarks - 4K Random Write/Read
4K Random Write/Read
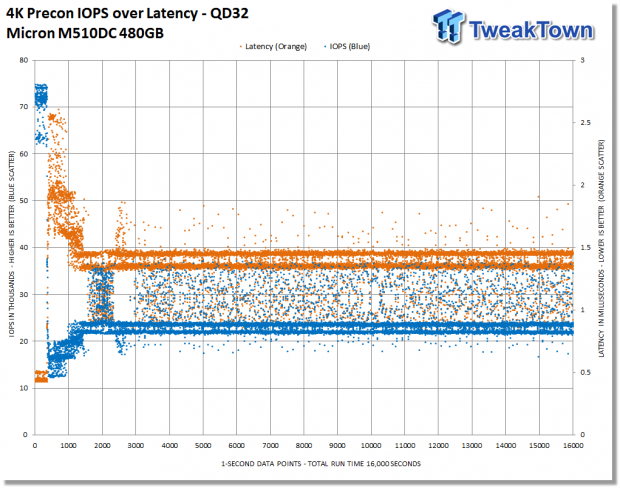
We precondition the drive for 16,000 seconds, or 4.44 hours, receiving performance data every second. We plot this data to observe the test subjects decent into steady state. We plot both IOPS and Latency. We plot IOPS (represented by blue scatter) in thousands and Latency (represented by orange scatter) in milliseconds. We observe steady state is achieved at 3,000 seconds of preconditioning.
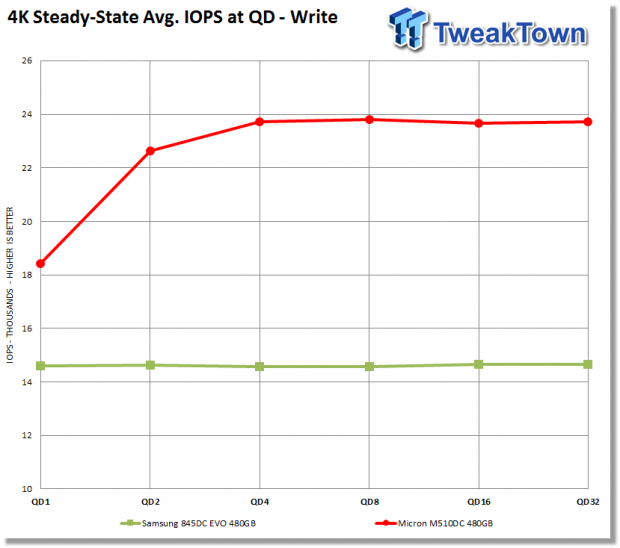

There is no contest here, the M510DC delivers vastly superior 4K random write performance. At QD4, the M510DC's performance maxes out near 24K IOPS and holds steady through QD32. The 845DC EVO displays very little variability, holding steady at around 14.5K IOPS at QD1-QD32.
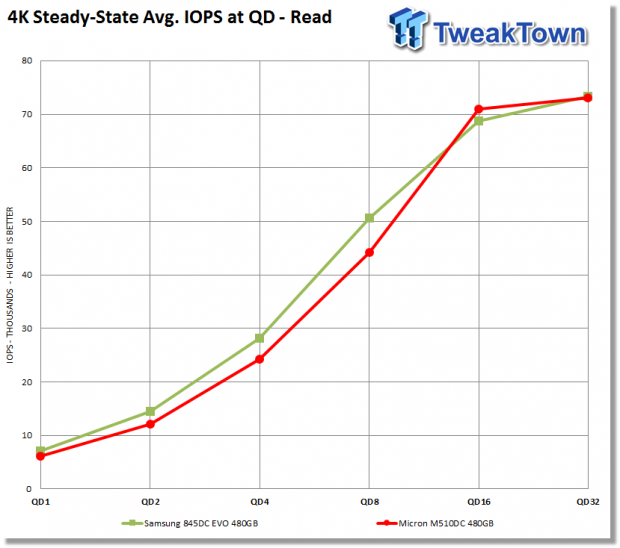
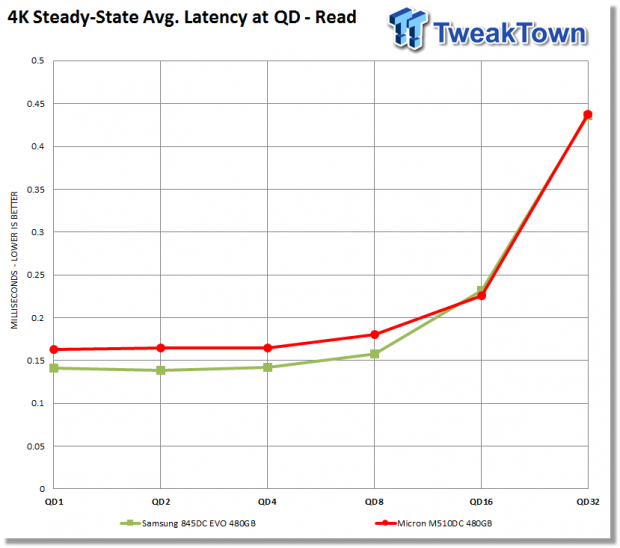
4K random read performance of the two drives is much closer to one another than 4K random write. The 845DC EVO displays better performance from QD1-QD8. At QD16, the M510DC takes a small lead over the 845DC EVO. At QD32, both drives are essentially delivering the same performance.
Conclusion: The M510DC will perform better than the 845DC EVO in a pure 4K random workload environment.
Benchmarks - 8K Random Write/Read
8K Random Write/Read
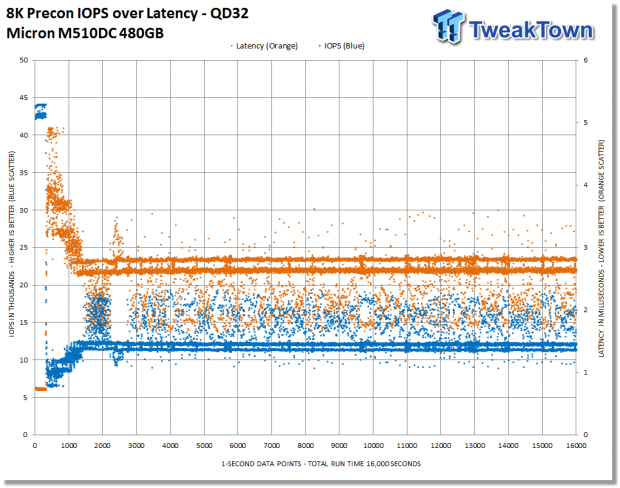
We precondition the drive for 16,000 seconds, or 4.44 hours, receiving performance data every second. We plot this data to observe the test subjects decent into steady state. We plot both IOPS and Latency. We plot IOPS (represented by blue scatter) in thousands and Latency (represented by orange scatter) in milliseconds. We observe steady state is achieved at 2,700 seconds of preconditioning.
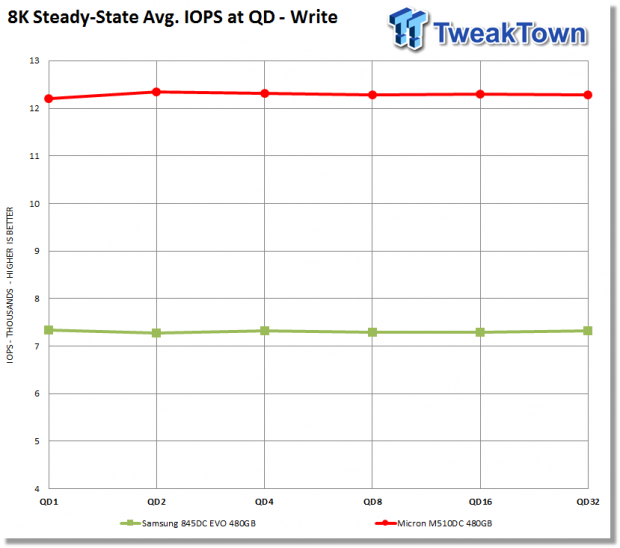
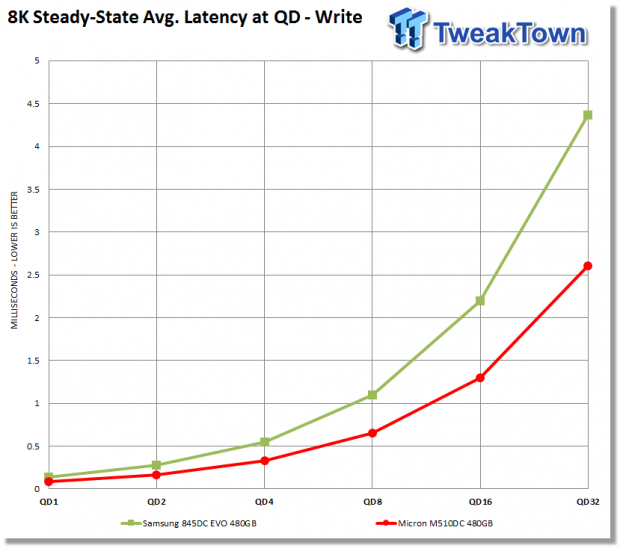
Again, there is no contest; the M510DC delivers 8K random write performance in the same manner as it does 4K random write, only this time there is very little variability across all measured queue depths. The M510DC holds steady at between 12.2K - 12.3K average IOPS throughout the entire test. The 845DC EVO also displays very little variability, holding steady at 7.3K average IOPS at QD1-32.
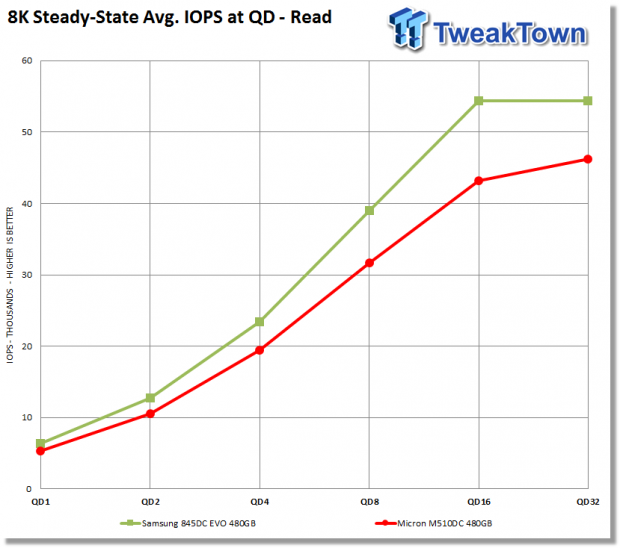
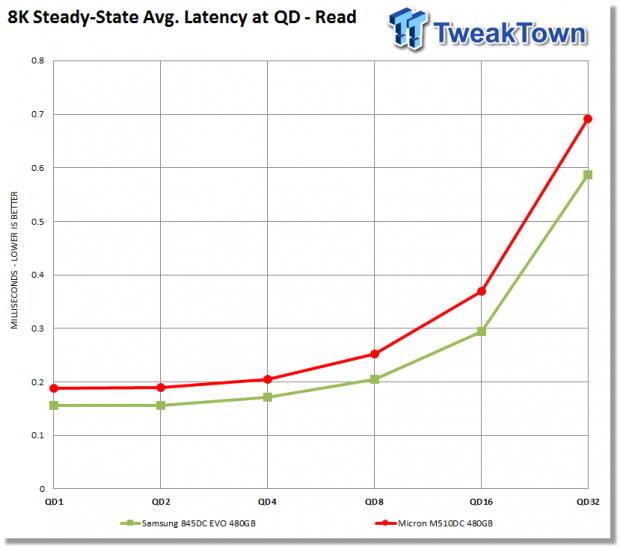
Samsung's 845DC EVO outperforms the M510DC across the board when reading 8K random data. The largest separation between the two drives occurs at QD16, with the 845DC EVO averaging 54.3K IOPS and the M510DC averaging 43.2K IOPS. The 845DC EVO achieves maximum performance at QD16. The M510DC continues to deliver increasing performance from QD1-32.
Conclusion: In a pure 8K random workload environment, the M510DC delivers better write performance and the 845DC EVO delivers better read performance.
Benchmarks - 128K Sequential Write/Read
128K Sequential Write/Read
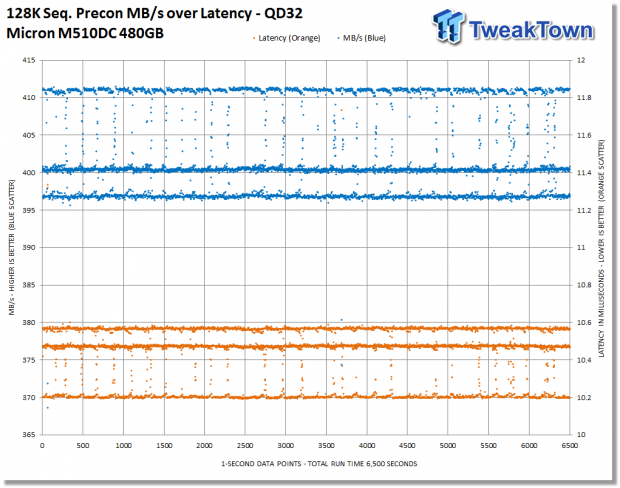
We precondition the drive for 6,500 seconds, or 1.8 hours, receiving performance data every second. A sequential steady state is achieved in a much shorter span of time than a random steady state. We plot both MB/s and Latency. We plot MB/s using blue scatter and Latency using orange scatter. We observe that the M510DC achieves steady state at 0 seconds of preconditioning, indicating that the previous 2x LBA fill phase achieved steady state.
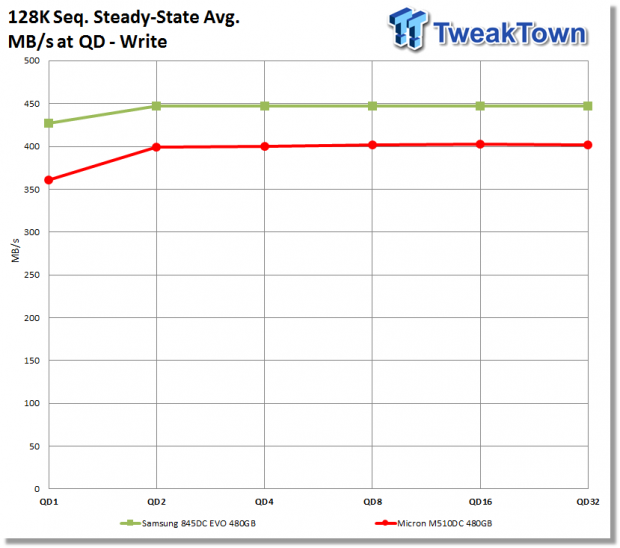
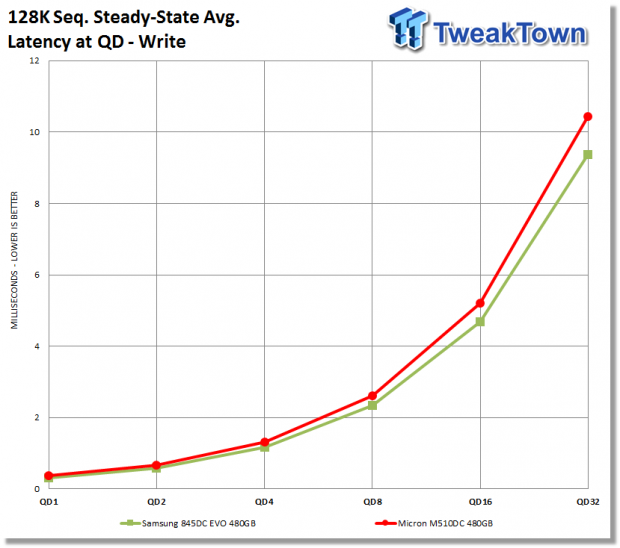
The 845DC EVO outperforms the M510DC from start to finish. Both drives deliver performance with very little variability from QD2-32. The 845DC EVO begins the test with 426 MB/s at QD1 and holds steady at 447 MB/s for the remainder of the test. The M510DC begins the test with 360 MB/s at QD1. From QD2-32, the M510DC is delivering between 400 - 402 MB/s. The M510DC is outperforming Micron's steady state sequential 128K QD32 write specification of by 22 MB/s.
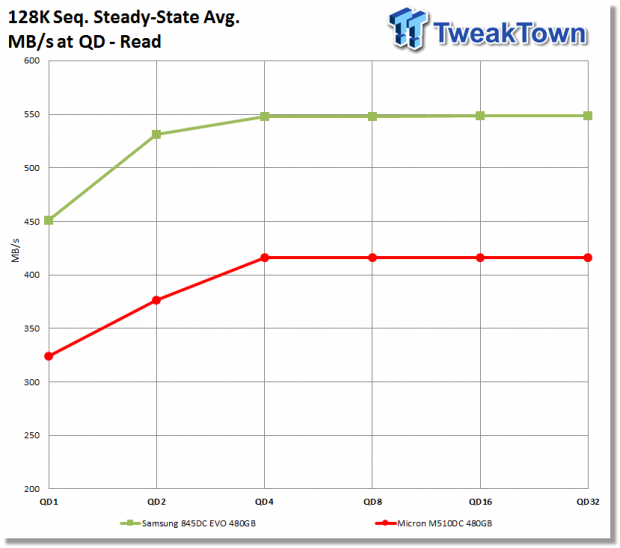
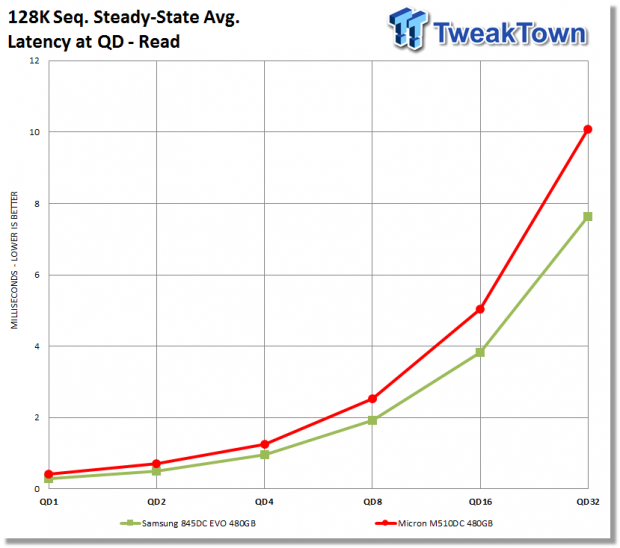
There is no contest, the 845DC EVO outperforms the M510DC by a large margin throughout the entire test. The largest gap between the drives occurs at QD2 with the 845DC EVO outperforming the M510DC by 155 MB/s. Both drives achieve maximum performance at QD4 and hold steady through QD32; the 845DC EVO at 548 MB/s, and the M510DC at 416 MB/s. The M510DC is performing slightly below Micron's sequential read specification of 420 MB/s.
Conclusion: The 845DC EVO delivers better sequential R/W performance than the M510DC.
Mixed Workload Benchmarks - Email Server
Email Server
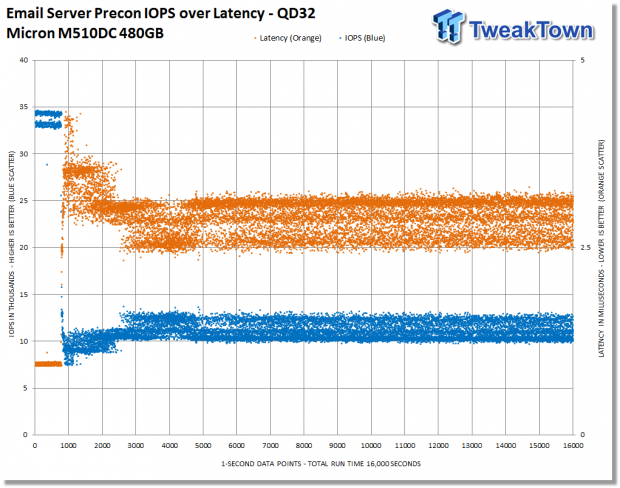
We precondition the drive for 16,000 seconds, or 4.44 hours, receiving performance data every second. We plot this data to observe the test subjects decent into steady state. We plot both IOPS and Latency. We plot IOPS (represented by blue scatter) in thousands and Latency (represented by orange scatter) in milliseconds. Steady state is achieved at 2,600 seconds.
An Email Server workload is a demanding 8K test with a 50 percent R/W distribution. This application gives a good indication of how well a drive will perform in a write heavy workload environment.
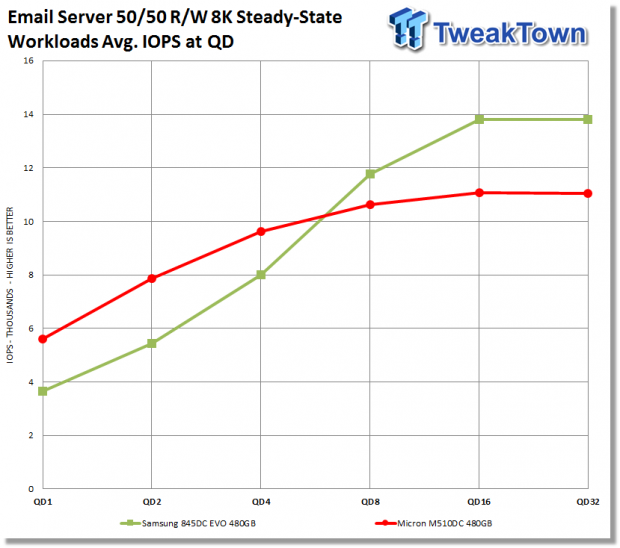
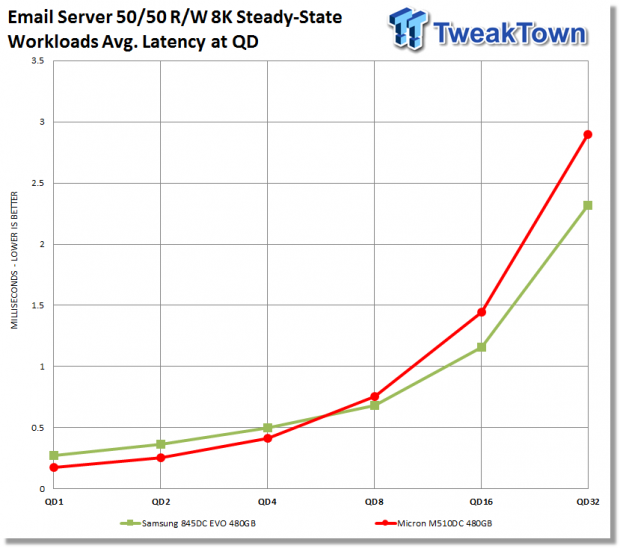
The M510DC delivers superior performance from QD1-4. The EVO takes charge from QD8-32. At QD32, the EVO is averaging 13,797 IOPS, the M510DC 11,052 IOPS. The largest gap in performance between the drives occurs at QD32. Both drives have the lead for half of the test. At QD2, the M510DC is outperforming the 845DC EVO by an average of 2,436 IOPS. At QD32, the 845DC EVO is outperforming the M510DC by an average of 2,745 IOPS.
Conclusion: The M510DC outperforms the 845DC at lower queue depths. The 845DC EVO outperforms the M510DC at higher queue depths.
Mixed Workload Benchmarks - OLTP/Database
OLTP/Database
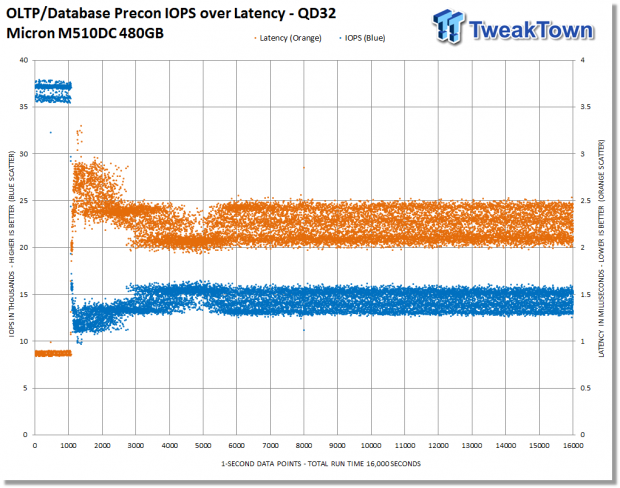
We precondition the drive for 16,000 seconds, or 4.44 hours, receiving performance data every second. We plot this data to observe the test subjects decent into steady state. We plot both IOPS and Latency. We plot IOPS (represented by blue scatter) in thousands and Latency (represented by orange scatter) in milliseconds. Steady state is achieved at 6,000 seconds.
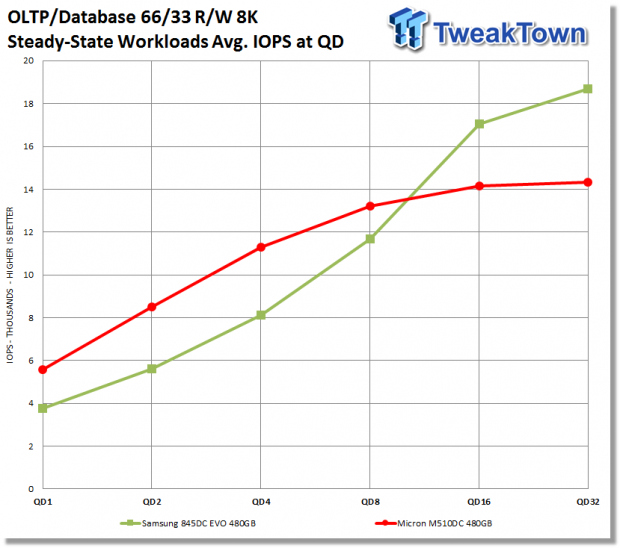
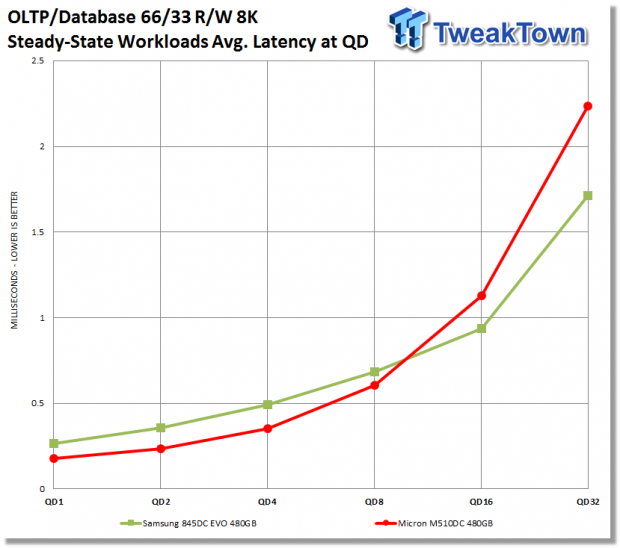
An On-Line Transaction Processing (OLTP) / Database workload is a demanding 8K test with a 66/33 percent R/W distribution. OLPT is online processing of financial transactions such as credit cards and high frequency trading in the financial sector. Database workloads are challenging for any storage solution.
In a similar fashion to what we saw from our Email Server results, both drives outperform one another at different queue depths. This time, however, the M510DC outperforms the 850DC EVO for the majority of the test. The M510DC outperforms the 845DC EVO at QD1-8 and the 845DC EVO outperforms the M510DC at QD16-32. The M510DC has its largest performance advantage at QD4. The 845DC has its largest performance advantage at QD32.
Conclusion: The M510DC outperforms the 845DC at lower queue depths. The 845DC EVO outperforms the M510DC at higher queue depths.
Mixed Workload Benchmarks - Web Server
OLTP/Database
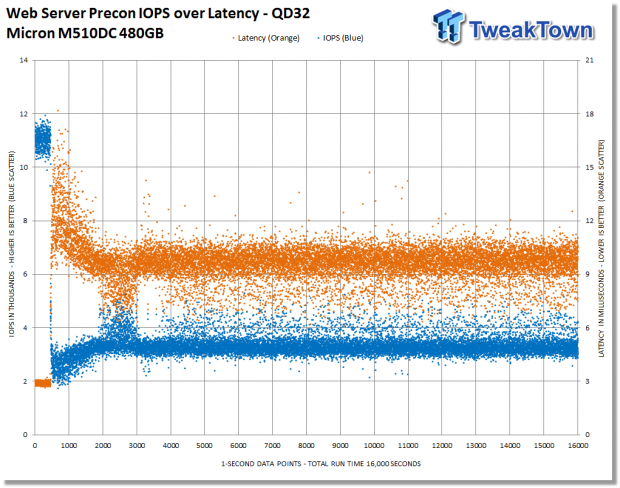
We precondition the drive for 16,000 seconds, or 4.44 hours, receiving performance data every second. We plot this data to observe the test subjects decent into steady state. We plot both IOPS and Latency. We plot IOPS (represented by blue scatter) in thousands and Latency (represented by orange scatter) in milliseconds. Steady state is achieved at 4,500 seconds.
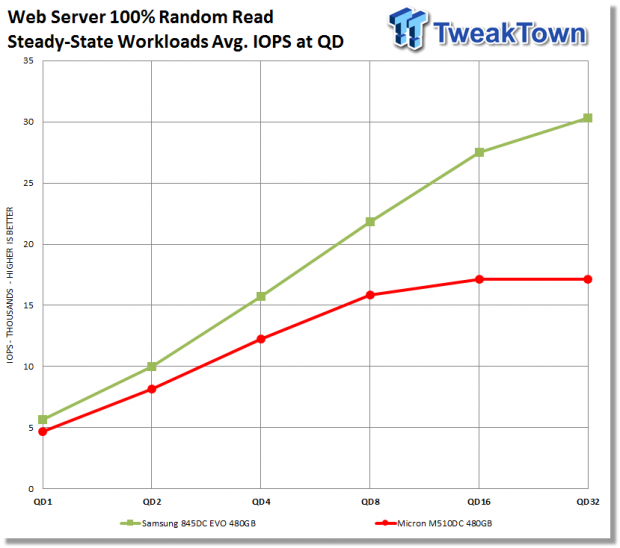
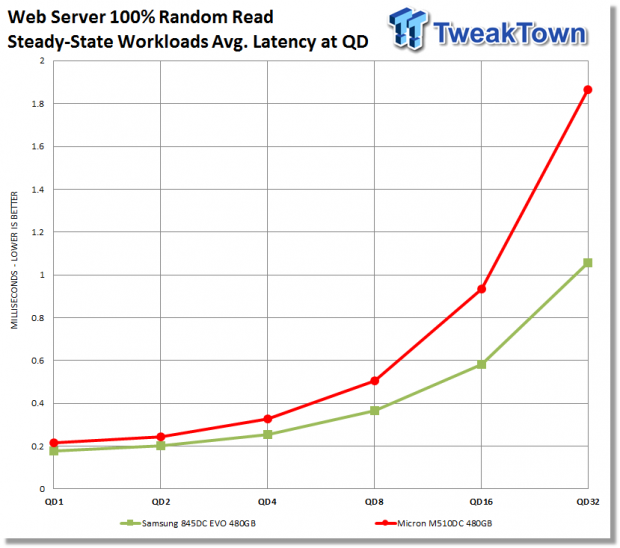
The Web Server workload is a pure random read test with a wide range of file sizes. Our test consists of the following file sizes and corresponding percentage of the overall 100 percent workload file size: 512B = 22 percent, 1KB = 15 percent, 2KB = 8 percent, 4KB = 23 percent, 8KB = 15 percent, 16KB = 2 percent, 32KB = 6 percent, 64KB = 7 percent, 128KB = 1 percent, 512KB = 1 percent.
The 845DC dominates this test. Micron's M510DC does not do as well with a wide distribution of file sizes. At QD32, the 845DC EVO leads the M510DC by over 13,000 IOPS. The M510DC doesn't perform unusually badly in this test, it's more accurate to say the 845DC EVO performs exceptionally well with this demanding random read workload.
Conclusion: The M510DC will provide vastly superior performance to HDD's in this type of environment, however, other SSD options are faster for this particular workload.
Final Thoughts
Micron designed the M510DC to speed along the transition to an all-flash datacenter eco system. The low cost and built-in data protection features of the product will also help bring an end to client side SSD's being utilized for cost savings in the datacenter. Endurance is something that gives the M510DC an advantage over many competing solutions. Two drive write per day endurance insures the M510DC will be a perfect fit for use case scenarios that require more endurance than competing solutions have to offer.
The M510DC performed extremely well in our random testing. The M510DC outperformed the 845DC EVO significantly with both 4K and 8K random write workloads. Sequential performance, however, is lower than that of some competing solutions. Mixed workloads were more of a mixed bag. The M510DC has plenty of performance at lower queue depths for applications like OLTP/Database and Email server. Our Web Server testing showed that the M510DC is not well suited for that application in comparison to competing solutions.
We would like to see higher capacity offerings, but limitations of the drive's Marvell 9187 controller dictate 960GB as the maximum capacity for this product line. We would also note that the 960GB variant with its meager 7% overprovisioning is rated for only 10.5K 4K random writes, less than half that of the 480GB version. Additionally, the 960GB version is rated for 1 drive write per day, while the lower capacity points are rated for 2 drive writes per day. The Marvell 9187 controller is a proven entity and there is something to be said for that, but it also gives competing solutions with newer controller technology a capacity advantage.
The M510DC stands out from competing solutions primarily due to the drive's class-leading endurance. As a point of comparison, Micron's M510DC has roughly 6x the endurance of Samsung's read-centric 845DC EVO. Endurance is a major consideration when it comes to choosing a storage solution, and this is why we believe the M510DC will be a successful product line for Micron.
Pros:
- Cost
- Features
- Random write performance
- Endurance
Cons:
- Low sequential Read/Write speed
- Web Performance
 Solidigm D7-PS1030 6.4TB Enterprise SSD Review - Most powerful of its kind yet
 DapuStor Haishen5 H5100 7.68TB Enterprise SSD Review - Random Read Champion
 Solidigm D7-P5810 800GB Enterprise SSD Review - Caching QLC
 Micron 7500 Max 12.8TB SSD Review - Drop-in Ready
 Solidigm D5-P5336 61.44TB SSD Review - Size Matters
 AMD Ryzen 9800X3D CPU leaked by two US retailers - but let's all agree to ignore the price tags
 Check out this GPU die shot of NVIDIA's next-gen GeForce RTX 5080 graphics card
 NVIDIA renames Blackwell Ultra to B300 series: HBM3E 12-Hi memory, TSMC CoWoS-L packaging
 SK hynix shows off HBM3E 12-Hi chips: 12 chips stacked, 40% thinner than 8-Hi stacks for 2025
 Apple slated to launch new MacBook Pro, iMac, and Mac Mini models within 7 days
 ASUS ROG Strix X870-I Gaming Wi-Fi Mini-ITX Motherboard Review
 ENDORFY Fluctus 120 PWM and Fluctus 120 PWM ARGB Cooling Fans Review
 Samsung 990 EVO Plus 2TB SSD Review - The DRAMless Powerhouse
 Lexar Play 2280 4TB SSD Review - Made for PlayStation 5
 XPG Invader X BTF Mid-Tower Chassis Review
 Crucial T500 4TB SSD Review - World's Best Performing 4-Channel SSD
 Patriot Viper Elite 5 RGB DDR5-6000 CAS 30 48GB Dual-Channel Memory Kit Review
 TeamGroup PD20M Mag 2TB External SSD Review - The Ultimate iPhone Accessory
 ASRock Phantom Gaming X870 Riptide Wi-Fi Motherboard Review
 Turtle Beach Kone II Air Wireless Gaming Mouse Review - Comfortably Huge
 ASUS Wi-Fi 7 routers push the boundary of wireless speed with AI-powered optimization
 ASUS's new AI NUC range delivers compact versatility and cutting-edge performance
 ASUS ROG Crosshair X870E Hero - Easy DIY, Cutting-Edge Features, and Next-Level Performance
 How NVIDIA RTX AI technology is pushing PC gaming forward
 Analysis: Why the Sony PlayStation 5 Pro console costs $700