
The Bottom Line
Introduction
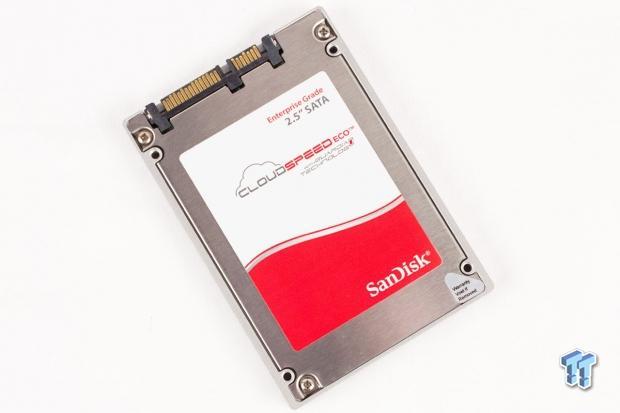
SanDisk offers a complete range of storage offerings that span the entire range of flash products; from the highest capacity PCIe offerings on the market to the highest capacity 4TB SAS SSDs, SanDisk has the bases covered. SanDisk has also pioneered the fusion of flash storage and the low latency memory bus with their revolutionary ULLtraDIMM product, which is covered in our SanDisk ULLtraDIMM DDR3 400GB Enterprise SSD Review.
These high-end solutions provide bleeding edge performance through SAS, PCIe, and memory channels, but SanDisk also provides solutions for the ever-growing 6Gb/s SATA segment. SATA SSDs offer wide compatibility with existing infrastructure, and an economical price point. SanDisk's CloudSpeed SSDs address read-centric and mixed-use workloads with three different offerings. The CloudSpeed Ultra delivers three DWPD (Drive Write Per Day) for heavier workloads and a higher random write speed of 30,000 IOPS, and the CloudSpeed Ascend offers one DWPD with 14,000 IOPS of random write performance. Both of these upper-tier SATA SSDs utilize eMLC to deliver a five-year warranty period.
The CloudSpeed Eco we are evaluating today leverages standard consumer class MLC (cMLC) to deliver the lowest price point, and one DWPD of endurance for a three-year warranty period. The CloudSpeed Eco addresses web servers, web 2.0 content repositories, photo sharing, media streaming, and VOD applications.
The price-sensitive SATA SSD segment values endurance and reliability over raw performance, and the CloudSpeed Eco employs SanDisk's proprietary Guardian Technology Platform to provide power-loss protection, and end-to-end data path protection. The Eco also features a BER of one per 10^17, and a two-million hour MTBF. We take a closer look at the three components of Guardian Technology on the following page.

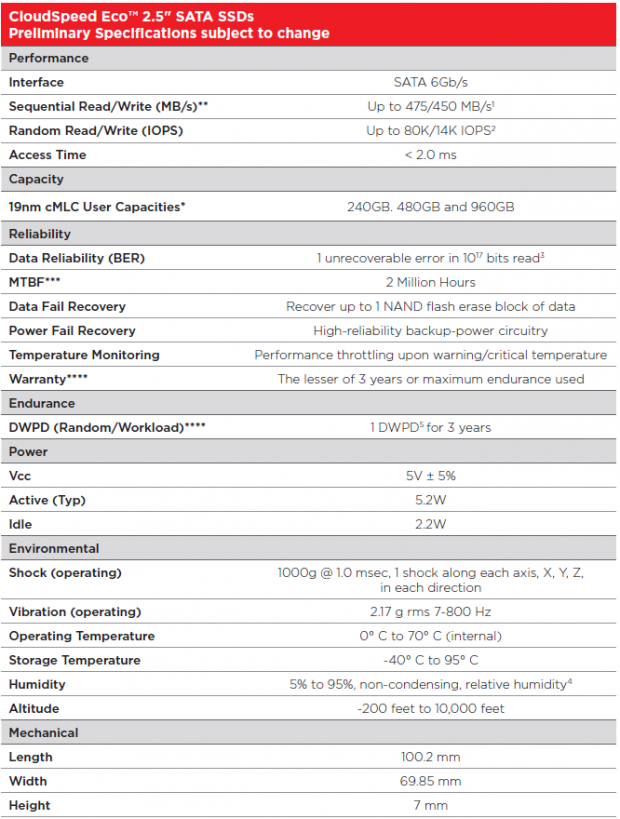
The 6Gb/s SATA CloudSpeed Eco leverages SanDisk's 19nm MLC NAND, and comes in capacities of 240, 480, and 960GB. Random and sequential read performance are crucial in the value segment, and the Eco delivers up to 80,000 random read IOPS and 475 MB/s of sequential read speed. Random write speed weighs in at 14,000 IOPS, and sequential write speeds reach 450 MB/s.
The Eco leverages the Marvell 9189 controller running proprietary SanDisk firmware featuring the Guardian Technology Platform, and 1GB of DDR3-1600 DRAM to deliver a consistent performance profile that offers excellent performance in RAID arrays. The Eco SSDs feature thermal monitoring, which throttles performance if the SSD exceeds the rated thermal envelope.
The CloudSpeed family has progressed through previous CloudSpeed 500 and CloudSpeed 1000E products to the three new models that provide a low price point. Let's take a closer look at the CloudSpeed Eco.
PRICING: You can find the SanDisk CloudSpeed Eco 960GB SSD for sale below. The prices listed are valid at the time of writing, but can change at any time. Click the link to see the very latest pricing for the best deal.
United States: The CloudSpeed Eco 960GB SSD retails for $995.00 at Amazon.
Guardian Technology Platform

SanDisk's award-winning Guardian Technology Platform is a proprietary approach that manages the physics of the NAND, and not just the errors. It consists of three integral components.
FlashGuard
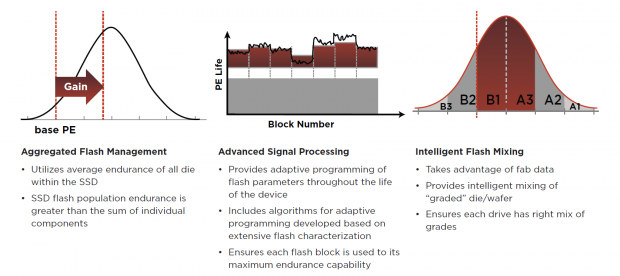
SanDisk subjects all NAND to an extensive characterization process before assembly. Aggregated Flash Management ensures there is an even distribution of different classes of NAND to benefit the whole. Once assembled, the Guardian Technology Platform takes over, and NAND settings are monitored and adjusted constantly. Retention and wear metrics are typically programmed during NAND processing, and are never altered. With Guardian, adaptive programming tailors the NAND settings at the base level by dynamically adjusting flash parameters over the course of the SSDs life. This creates an exponential increase in NAND endurance.
As NAND geometries shrink, endurance also shrinks, and data errors multiply. SMART utilizes adaptive ASP (Advanced Signal Processing) in concert with advanced two-level BCH ECC algorithms to combat data errors. Typical SSDs can only achieve wear leveling on each NAND package, but Aggregated Flash Processing treats all of the flash elements as a pool, and provides global cross-die wear leveling. The wear leveling algorithms also monitor the health of individual flash cells, and dynamically focus the heaviest workloads on the healthiest flash. The result is impressive endurance metrics.
DataGuard
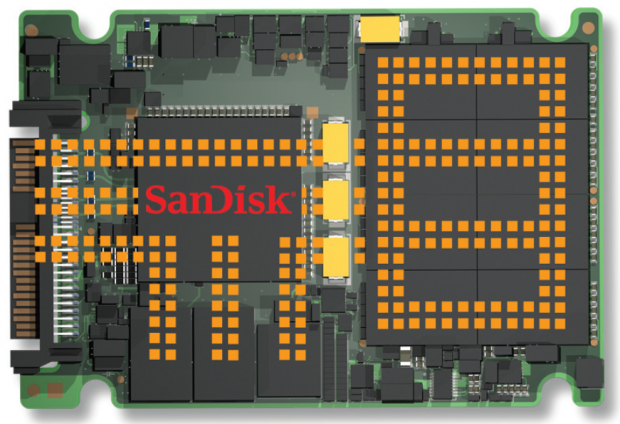
DataGuard provides full data path protection, and the F.R.A.M.E. (Flexible Redundant Array of Memory Elements) functionality. F.R.A.M.E. is a cross-die data redundancy feature, similar to parity, which allows for data reconstruction in the event of a catastrophic event, such as a flash page or block failure (some incarnations can even recover from an entire die failure). This internal XOR provides embedded fault tolerance, and a BER rating of one unrecoverable error per 10^17.
EverGuard
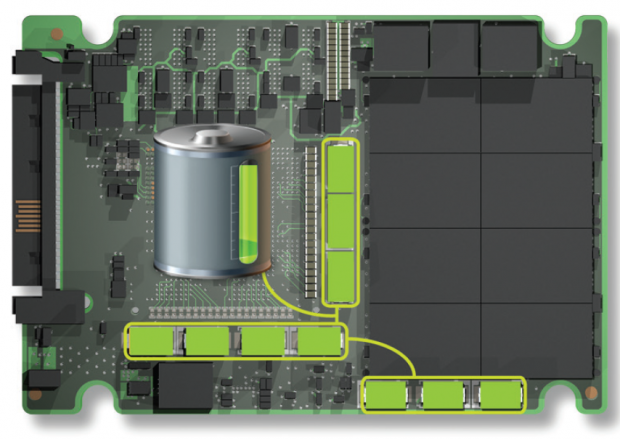
EverGuard is a third generation host power-loss protection design that protects against unexpected power interruptions. An array of discrete PolyTantalum capacitors provide power to flush all data in transit to the NAND during power loss. These Tantalum capacitors are rated for high temperature environments, and do not experience degradation over time. There are additional architectural features that reduce power hold up time requirements, such as advanced controller power management, and lower pages reserved for power-down writes.
CloudSpeed Eco Internals and Specifications
CloudSpeed Eco Internals
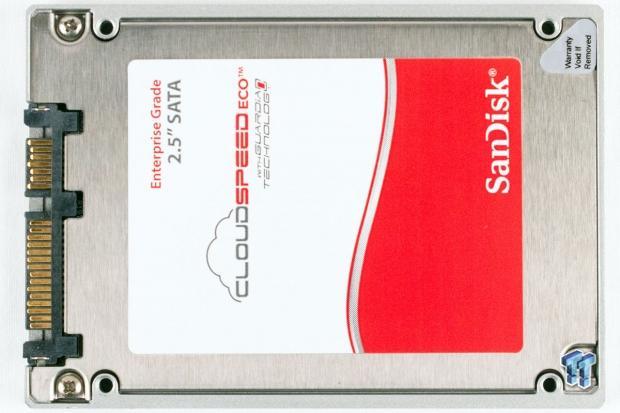
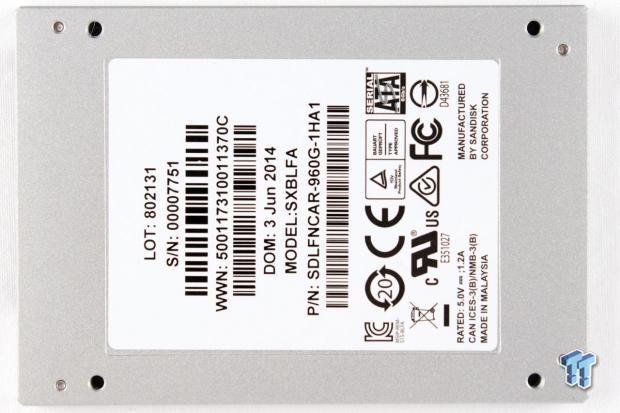
The SanDisk CloudSpeed Eco comes in a 2.5" form factor with a slim 7mm z-height. The SSD features the 6Gb/s SATA connection, and the fasteners are sealed with Loctite to prevent loosening in high-vibration environments.
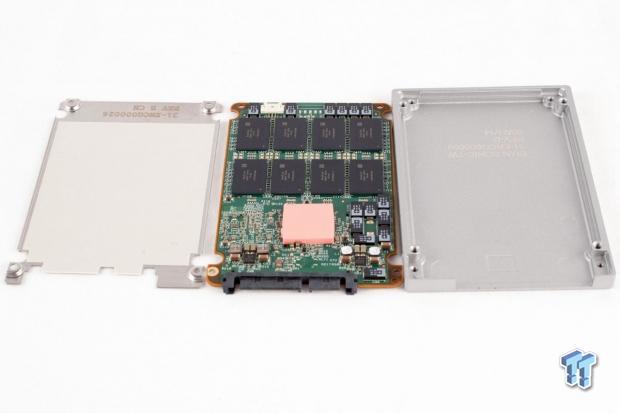
The PCB is nestled snugly inside a custom-molded case without any additional internal fasteners. The large pink thermal pad actually doesn't have a component underneath; the SSD controller resides on the flip side of the PCB. The Eco cools the controller by pulling heat from the underside and shedding it into the case.
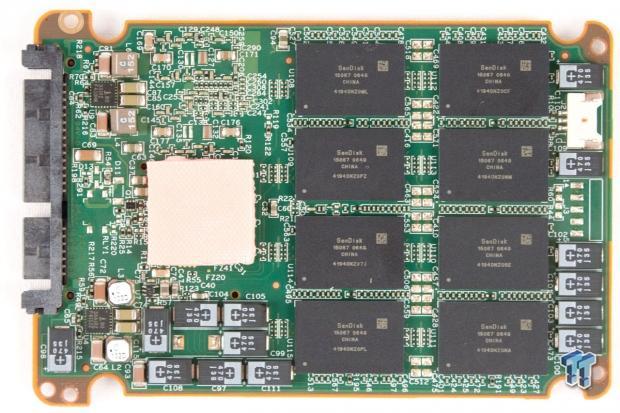

16 total packages of SanDisk 19nm NAND provide 960GB of user-addressable capacity. We also note the 14 power capacitors on the rear of the PCB, and open pads for additional capacitors on the top. These capacitors, in tandem with firmware optimizations, persist any data in-flight to the NAND media in the event of host power loss.
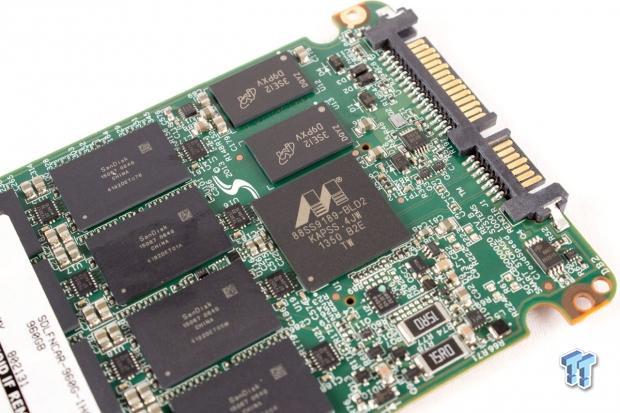
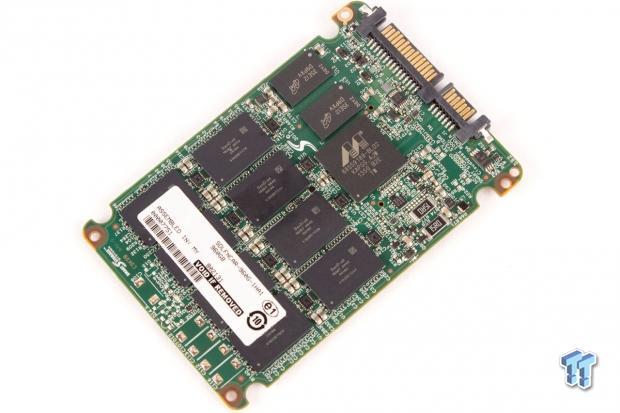
The proven and reliable Marvell 88SS9189-BLD2 controller runs SanDisk's proprietary firmware implementation that features the Guardian Technology Platform. Two 512MB Micron DRAM packages flank the controller to provide a total of 1GB of DDR3-1600 cache.
CloudSpeed Eco Specifications
The CloudSpeed Eco is available with the SDLFNDAR-240G-1HXX, SDLFNDAR-480G-1HXX, and SDLFNDAR-960G-1HXX part numbers.
Test System and Methodology

Our approach to storage testing targets long-term performance with a high level of granularity. Many testing methods record peak and average measurements during the test period. These average values give a basic understanding of performance, but fall short in providing the clearest view possible of I/O QoS (Quality of Service).
While under load, all storage solutions deliver variable levels of performance. 'Average' results do little to indicate performance variability experienced during actual deployment. The degree of variability is especially pertinent, as many applications can hang or lag as they wait for I/O requests to complete. While this fluctuation is normal, the degree of variability is what separates enterprise storage solutions from typical client-side hardware.
Providing ongoing measurements from our workloads with one-second reporting intervals illustrates product differentiation in relation to I/O QoS. Scatter charts give readers a basic understanding of I/O latency distribution without directly observing numerous graphs. This testing methodology illustrates performance variability, and includes average measurements during the measurement window.
IOPS data that ignores latency is useless. Consistent latency is the goal of every storage solution, and measurements such as Maximum Latency only illuminate the single longest I/O received during testing. This can be misleading, as a single 'outlying I/O' can skew the view of an otherwise superb solution. Standard Deviation measurements consider latency distribution, but do not always effectively illustrate I/O distribution with enough granularity to provide a clear picture of system performance. We utilize high-granularity I/O latency charts to illuminate performance during our test runs, and our IOPS to Latency measurements highlight IOPS performance at specific latency points.
Our testing regimen follows SNIA principles to ensure consistent, repeatable testing, and utilizes multithreaded workloads found in typical production environments. We measure power consumption during precondition runs. This provides measurements in time-based fashion, with results every second, to illuminate the behavior of power consumption in steady state conditions. We also present IOPS-to-watts measurements to highlight efficiency.
This evaluation features SSDs of varying capacity, and overprovisioning variations require consideration during performance and power consumption analyses. The SanDisk CloudSpeed Eco and Toshiba HK3R2 samples have 960GB of user-addressable capacity; the Micron M500DC features 800GB, and the Intel DC S3500 model is 480GB. The SSDs are tested over their full LBA range to highlight performance at maximum utilization. The first page of results will provide the 'key' to understanding and interpreting our test methodology.
Benchmarks - 4k Random Read/Write
4k Random Read/Write
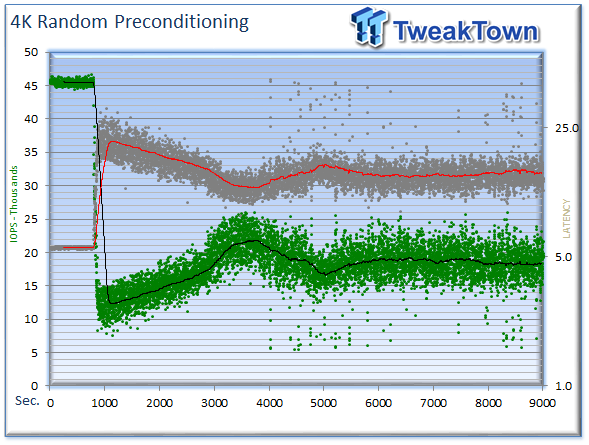
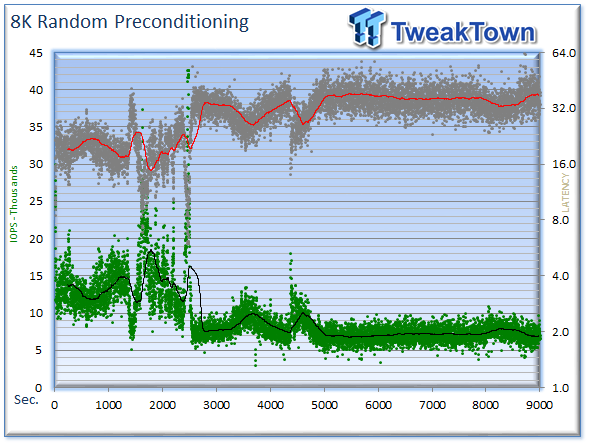
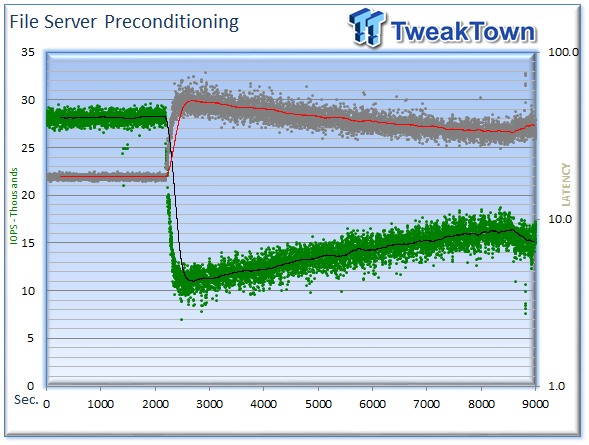
We precondition the 960GB SanDisk CloudSpeed Eco for 9,000 seconds, or two and a half hours, receiving performance reports every second. We plot this data to illustrate the drive's descent into steady state.
This dual-axis chart consists of 18,000 data points, with the IOPS on the left, and the latency on the right. The green dots signify IOPS, and the grey dots are latency measurements during the test. We place latency data in a logarithmic scale to bring it into comparison range. The lines through the data scatter are the average during the test. This type of testing presents standard deviation and maximum/minimum I/O in a visual manner.
Note that the IOPS and latency figures are nearly mirror images of each other. This illustrates high-granularity testing can give our readers a good feel for latency distribution by viewing IOPS at one-second intervals. This should be in mind when viewing our test results below. This downward slope of performance only occurs during the first few hours of use, and we present precondition results only to confirm steady state convergence.
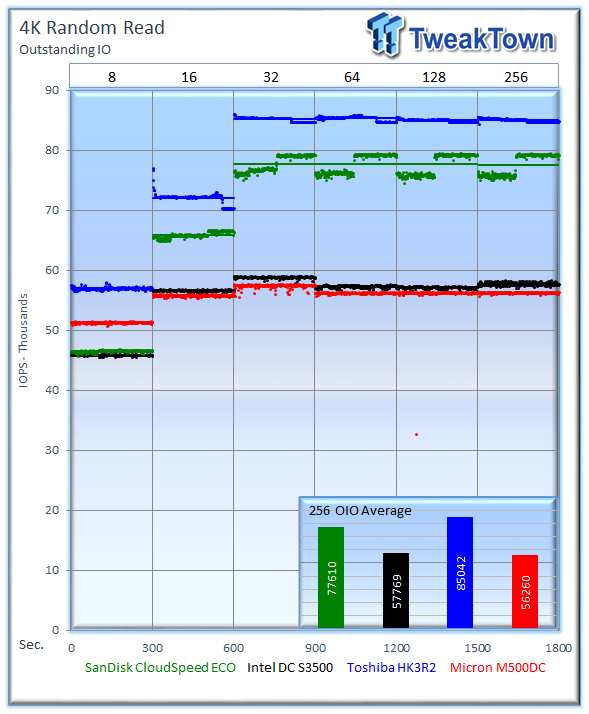
Each level tested includes 300 data points (five minutes of one second reports) to illustrate performance variability. The line for each OIO depth represents the average speed reported during the five-minute interval. We include a smaller embedded chart that lists performance at the highest load for easy interpretation.
4k random speed measurements are an important metric when comparing drive performance, as the hardest type of file access for any storage solution to master is small-file random. 4k random performance is a heavily marketed figure, and is one of the most sought-after performance specifications.
The CloudSpeed Eco places second in random read performance with 85,042 IOPS.
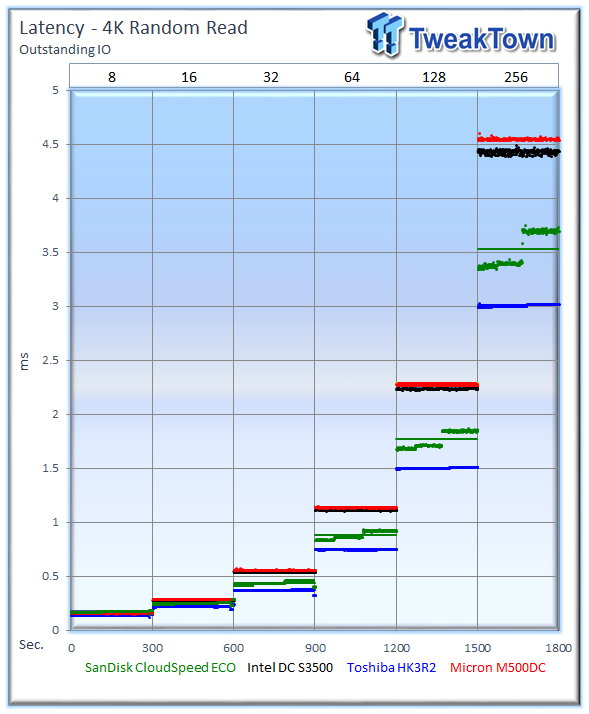
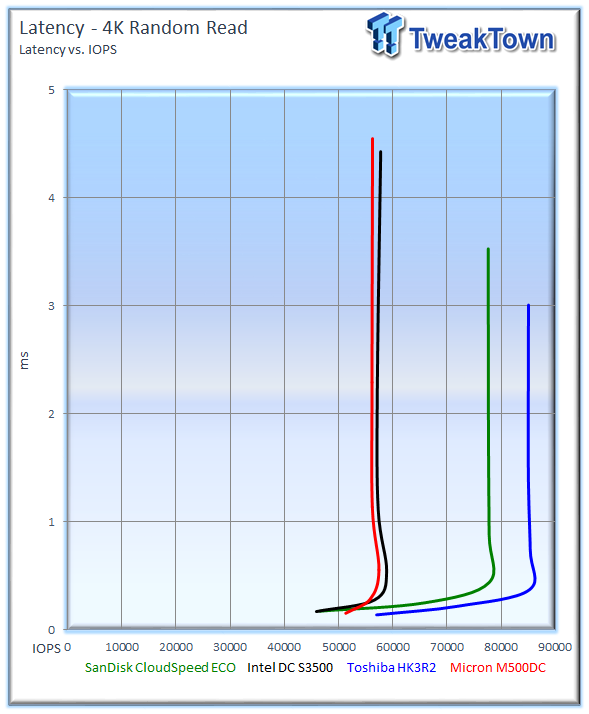
Our Latency v IOPS charts compare the amount of performance attained from each solution at specific latency measurements. Many applications have specific latency requirements. These charts present relevant metrics in an easy-to-read manner for readers who are familiar with their application requirements.
The CloudSpeed Eco takes second place in our Latency-v-IOPS testing, and the random read performance outpaces the Micron M500DC and Intel DC S3500.
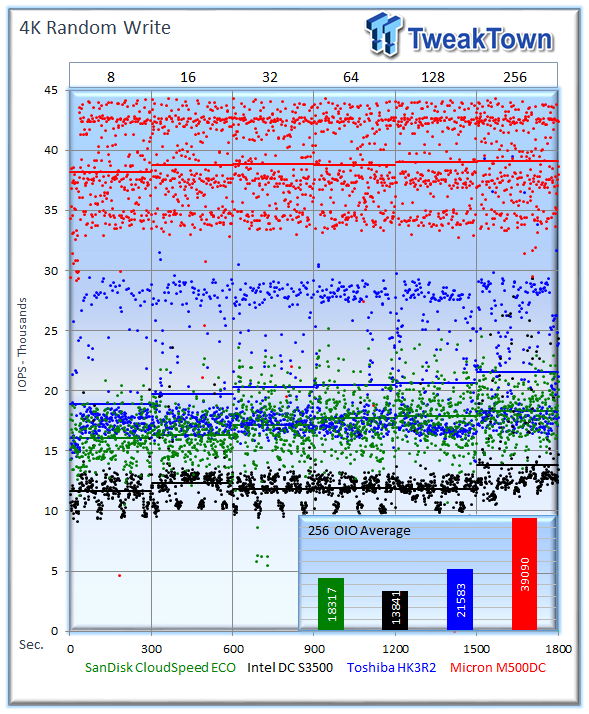
Garbage collection routines are more pronounced in heavy write workloads, leading to performance variability.
The Eco places third in our random write testing, but displays a consistent performance profile with less variability than the HK3R2, and the M500DC.
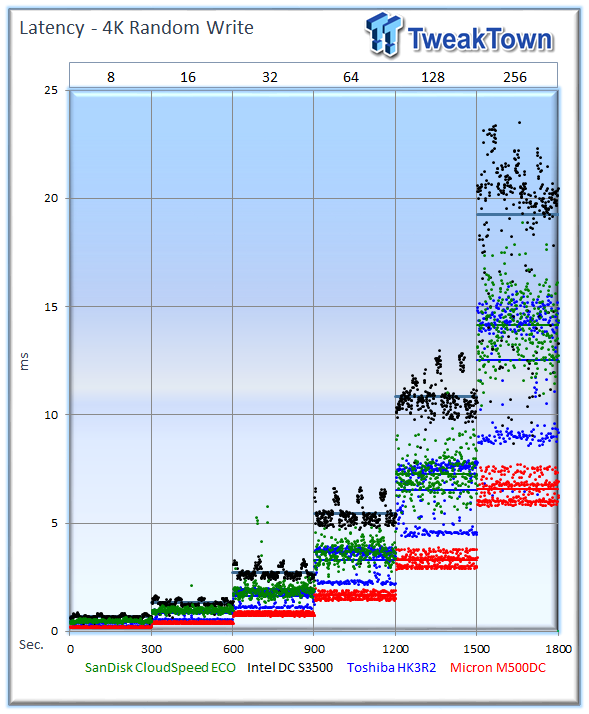
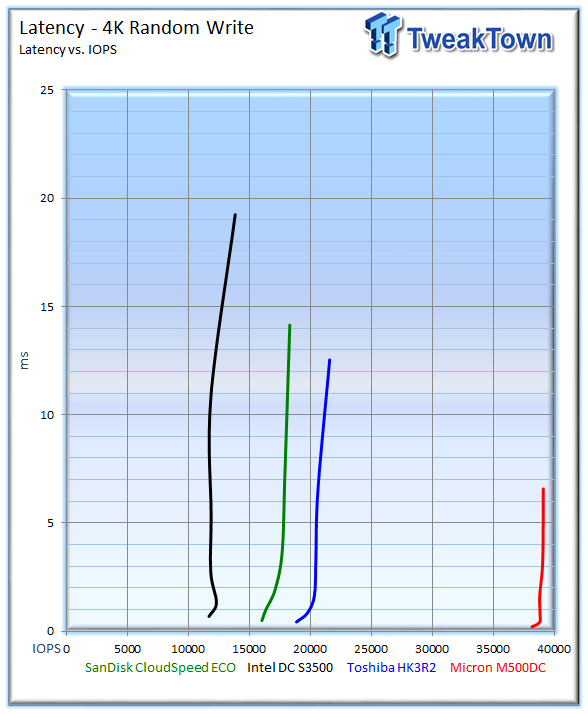
The Micron M500DC has the best overall latency in the write workload, and the CloudSpeed Eco takes third place.
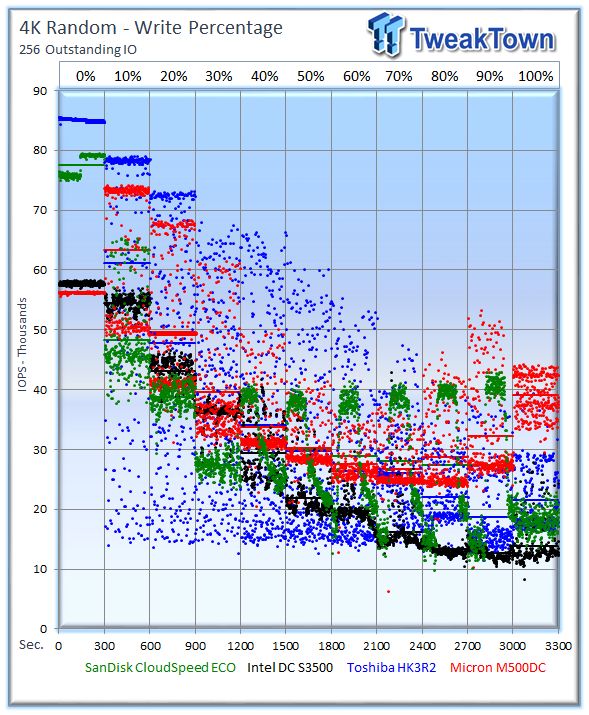
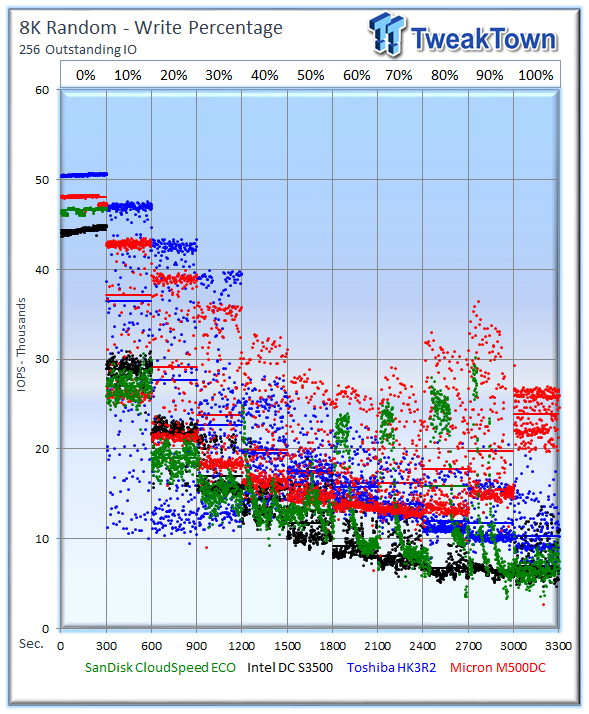
Our write percentage testing illustrates the varying performance of each solution with mixed workloads. The 100% column to the right is a pure 4k write workload, and 0% represents a pure 4k read workload.
The CloudSpeed Eco experiences variability in the 40-90% write mixtures, highlighting its recovery mechanisms at work during the measurement windows. The average speed beats all but the M500DC in those write mixtures.
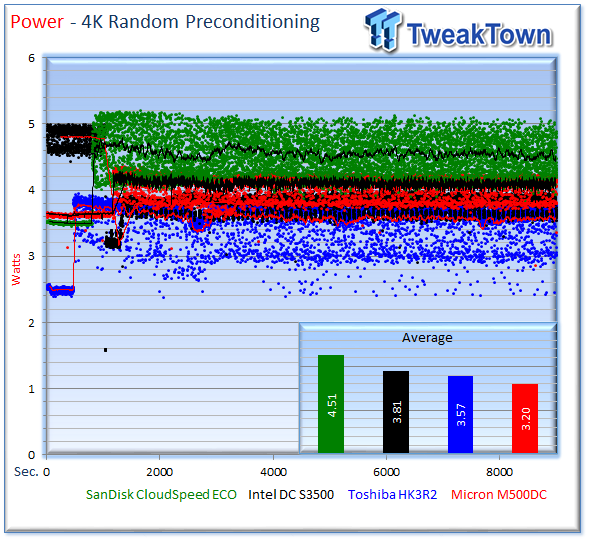
We record power consumption measurements during our precondition run. We calculate the stated average results after the device has settled into steady state during the last five minutes of the test.
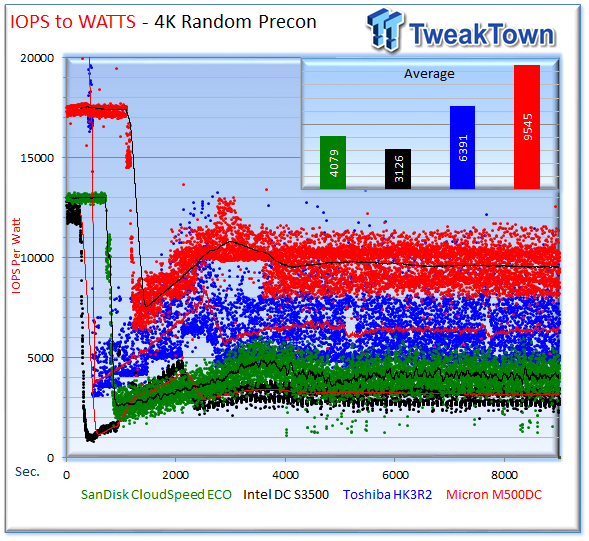
IOPS-to-watts measurements are generated from data recorded during our precondition run, and the stated average is from the last five minutes of the test.
The CloudSpeed Eco's efficiency places third in the test.
Benchmarks - 8k Random Read/Write
8k Random Read/Write
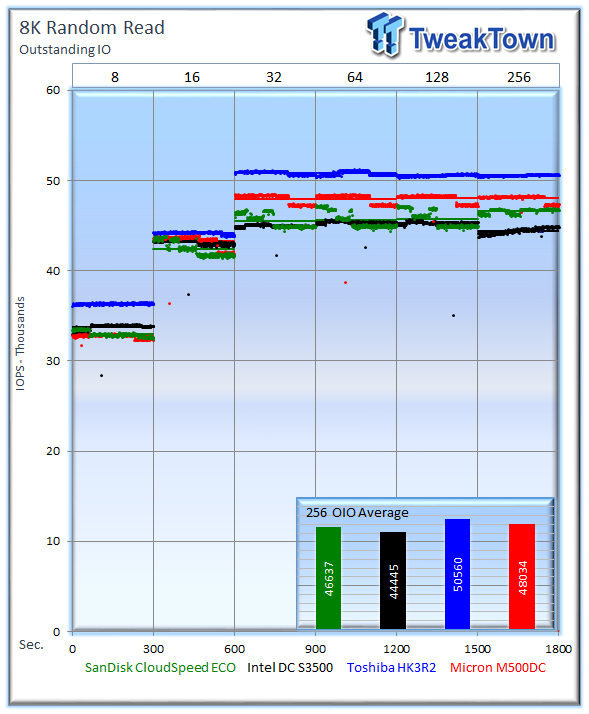
Many server workloads rely heavily upon 8k performance, and we include this as a standard with each evaluation. Many of our server workloads also test 8k performance with various mixed read/write distributions.
The CloudSpeed Eco offers competitive 8k random performance, but places third in overall random read speed.
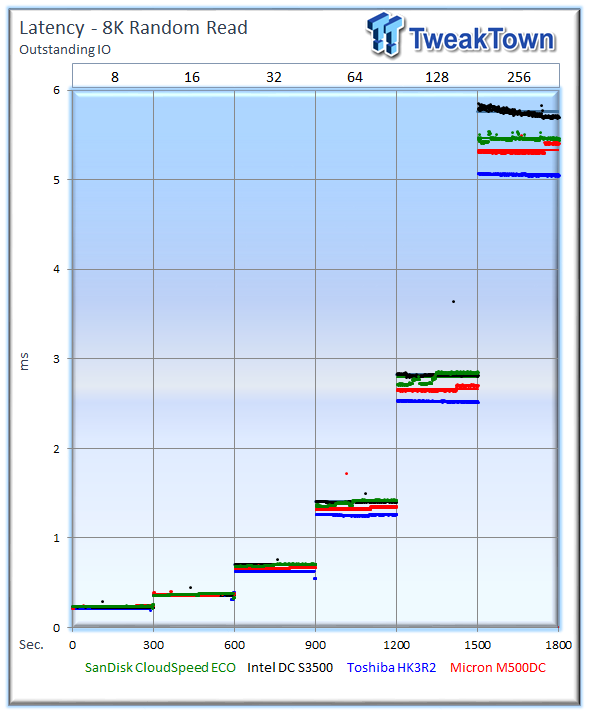
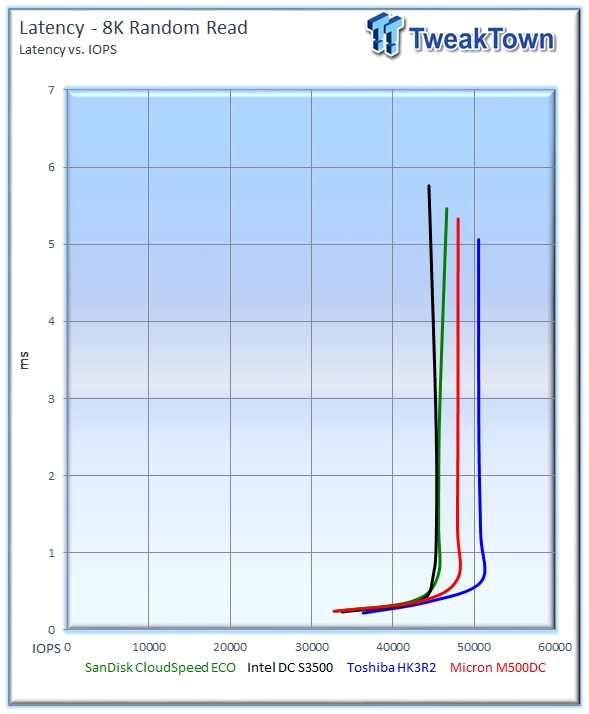
The Eco and the DC S3500 vie for third place, with the Eco coming out on top.
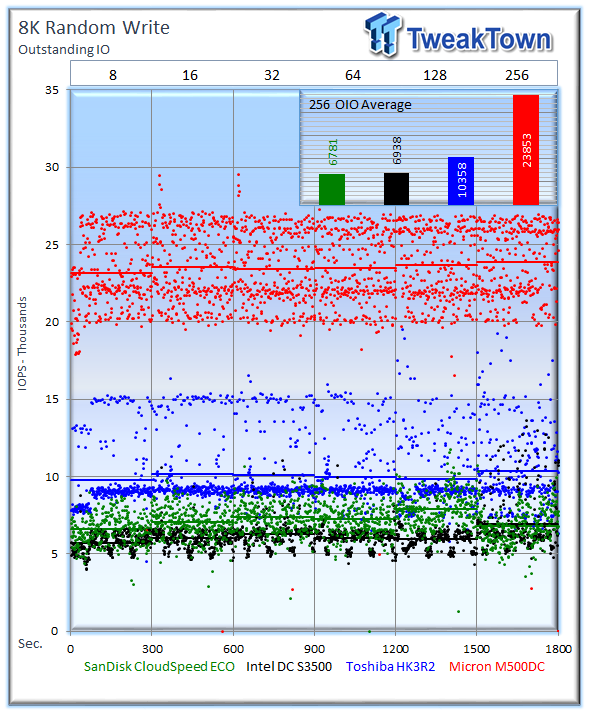
The CloudSpeed Eco falls into fourth place during the 256OIO 8k random write workload, but takes a lead against the DC S3500 at lighter workloads.
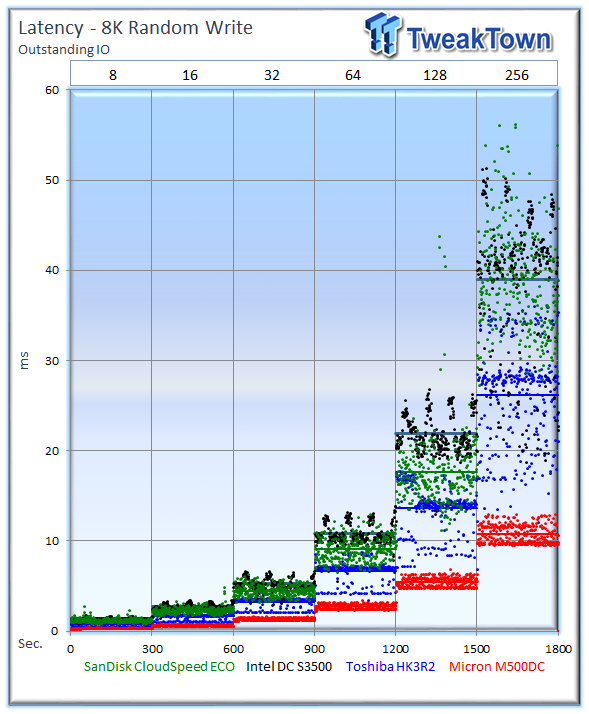
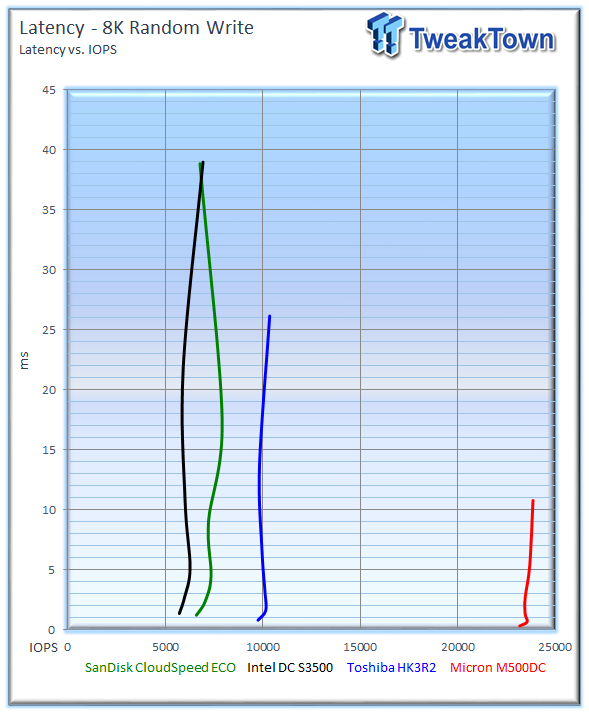
The CloudSpeed Eco placed fourth in 8k random write speed under heavy load, but beats the DC S3500 in the majority of the latency efficiency test.
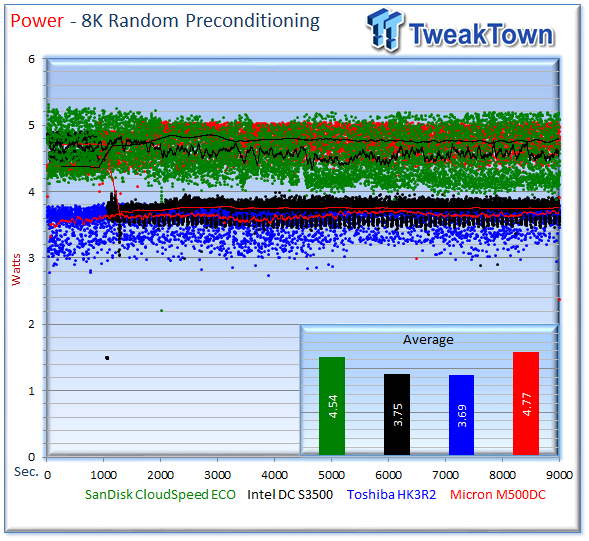
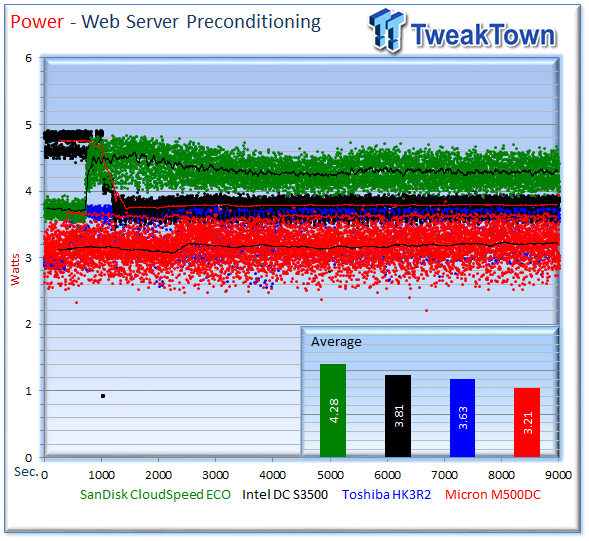
The SanDisk CloudSpeed Eco takes third place in the power testing with lower power draw than the M500DC.
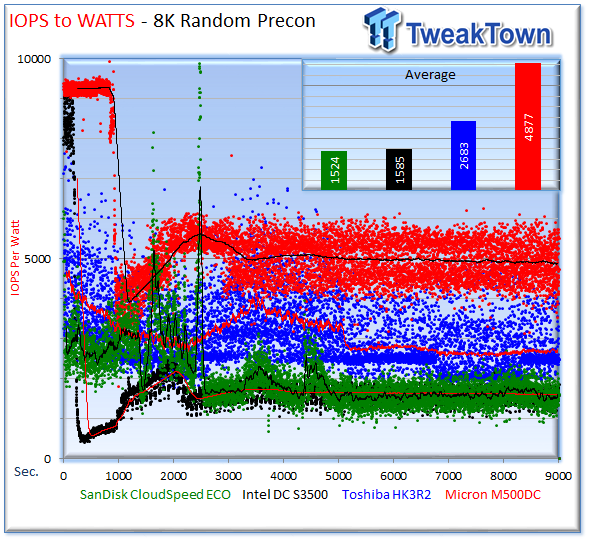
The Eco falls into a similar efficiency profile as the DC S3500.
Benchmarks - 128k Sequential Read/Write
128k Sequential Read/Write
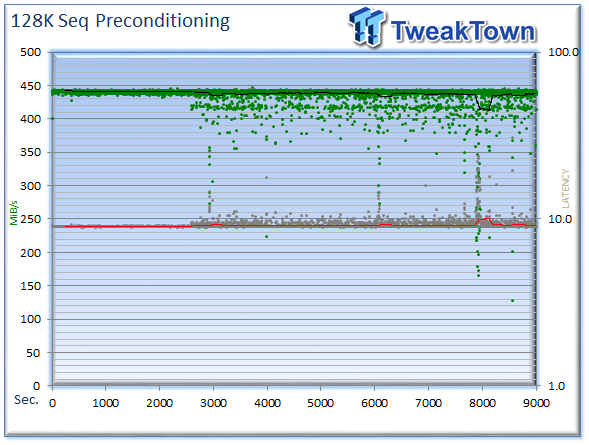
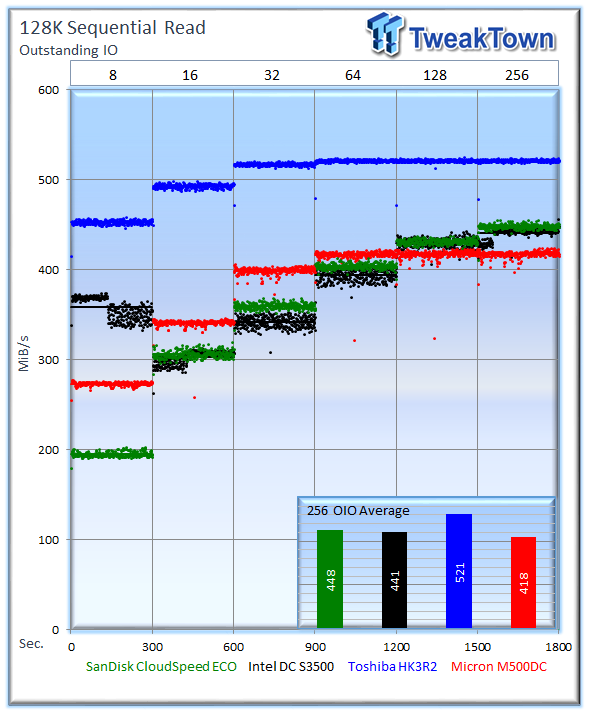
128k sequential speed reflects the maximum sequential throughput of the SSD, and is indicative of performance in OLAP, batch processing, streaming, content delivery applications, and backup scenarios. The CloudSpeed Eco requires some parallelism to realize optimum sequential performance, but rebounds at 256 OIO with an average of 448MB/s.
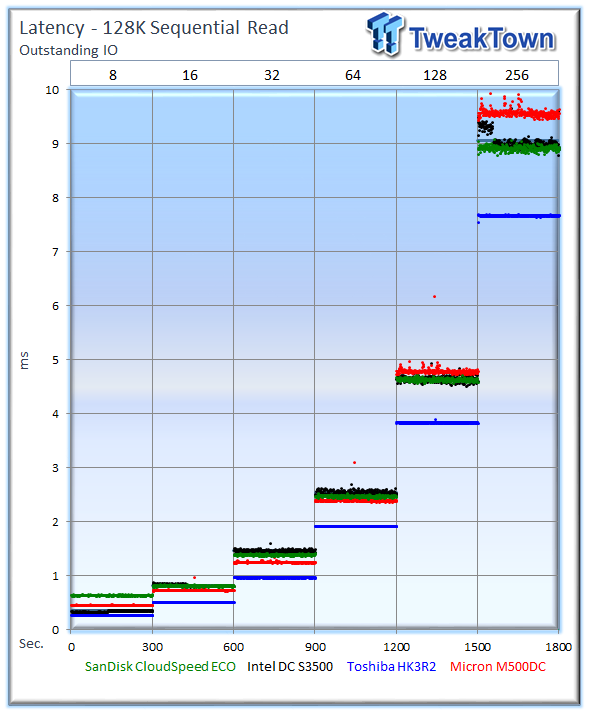
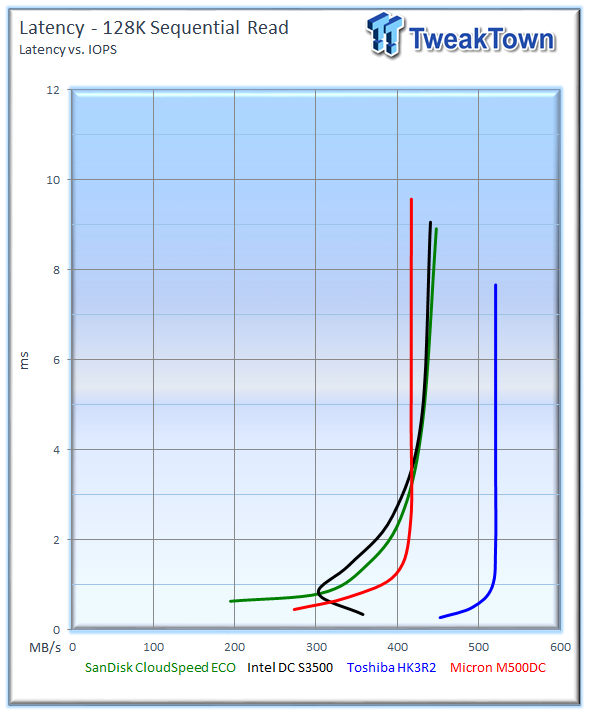
The CloudSpeed Eco takes second place in the test while under heavy load.
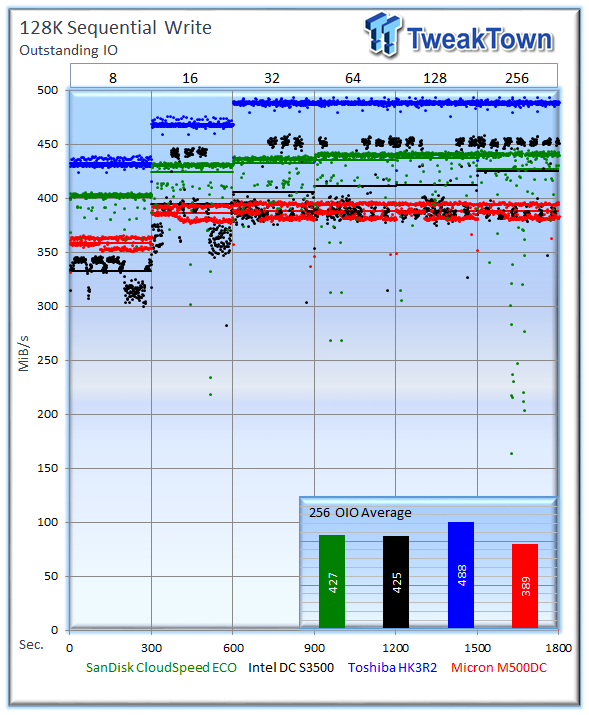
Sequential write performance is important in tasks such as caching, replication, HPC, and database logging. The CloudSpeed Eco takes second place in every category during our 128k sequential write testing.
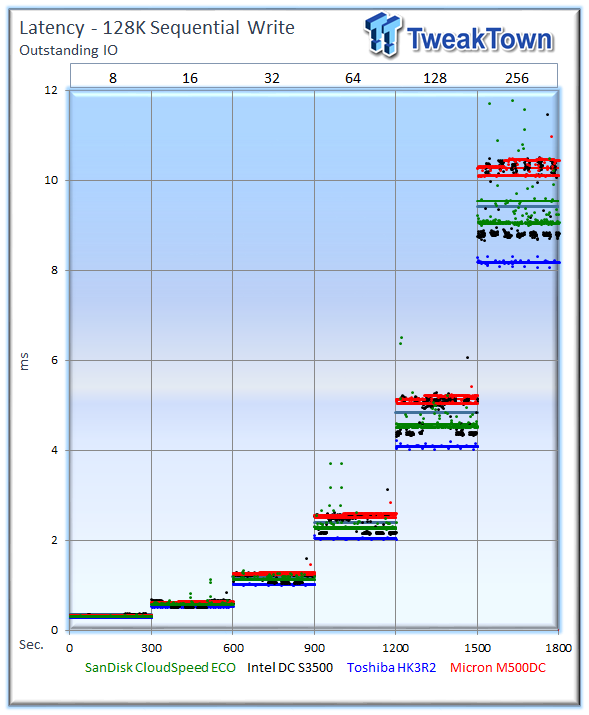
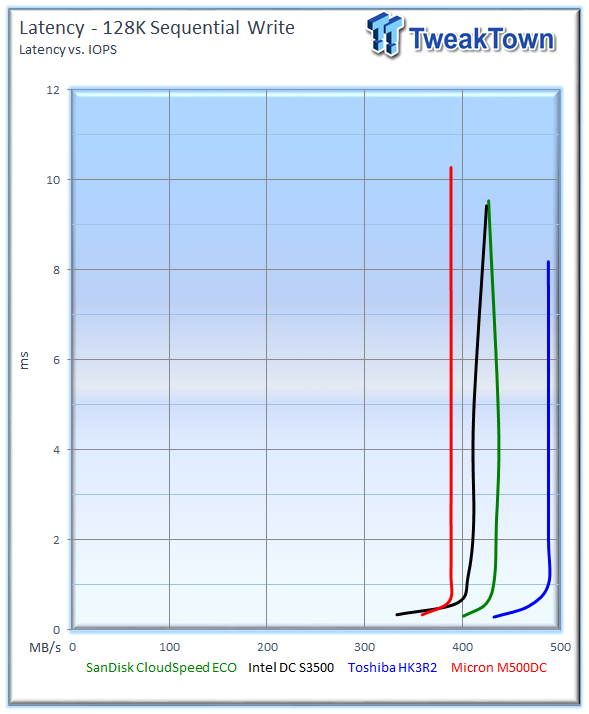
The CloudSpeed Eco's strong sequential write performance shines through in the latency comparisons.
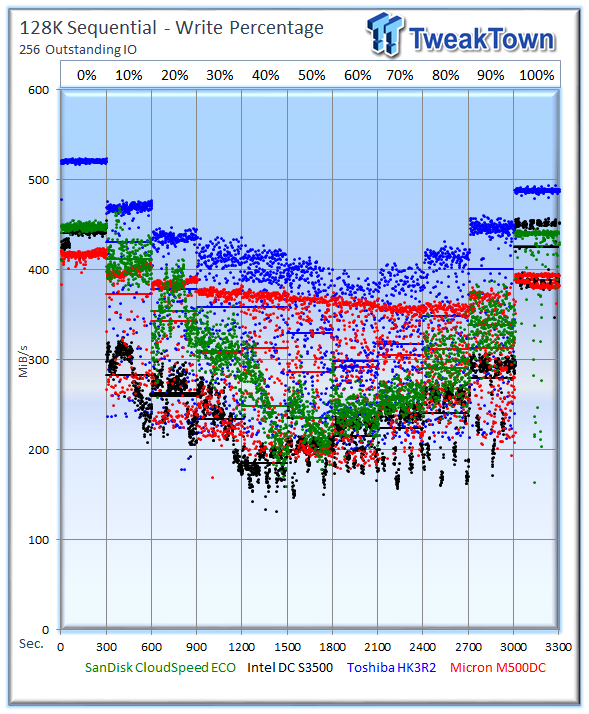
The Eco delivers a more consistent performance profile than the two leaders in the 128K mixed sequential testing.
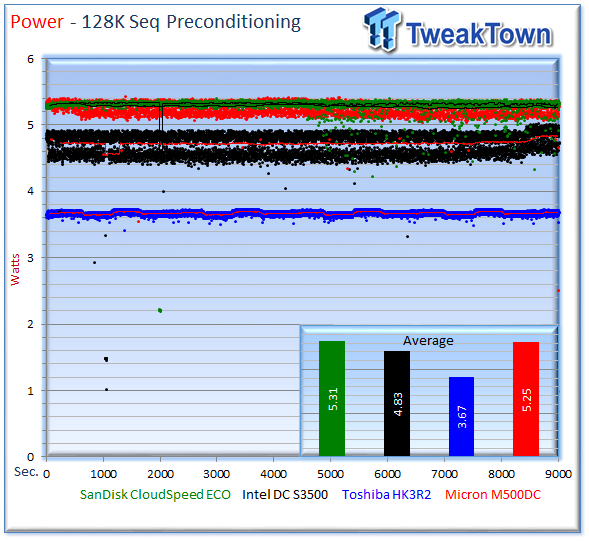
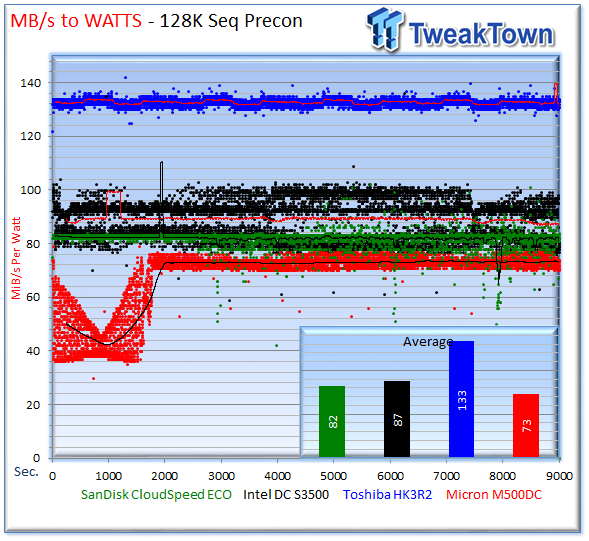
The CloudSpeed Eco draws more power during the measurement window, but its high speed allows it nearly tie with the DC S3500.
Benchmarks - Database/OLTP and Web Server
Database/OLTP
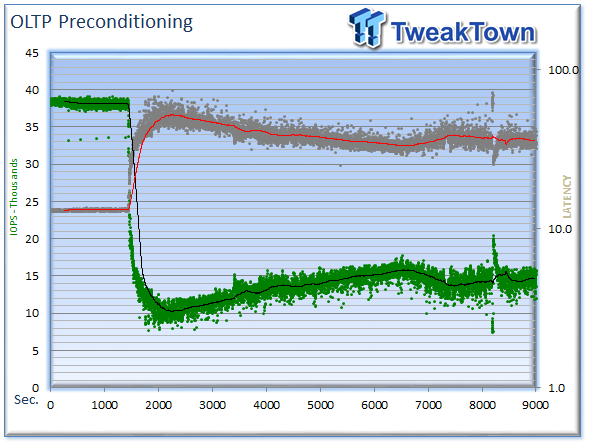
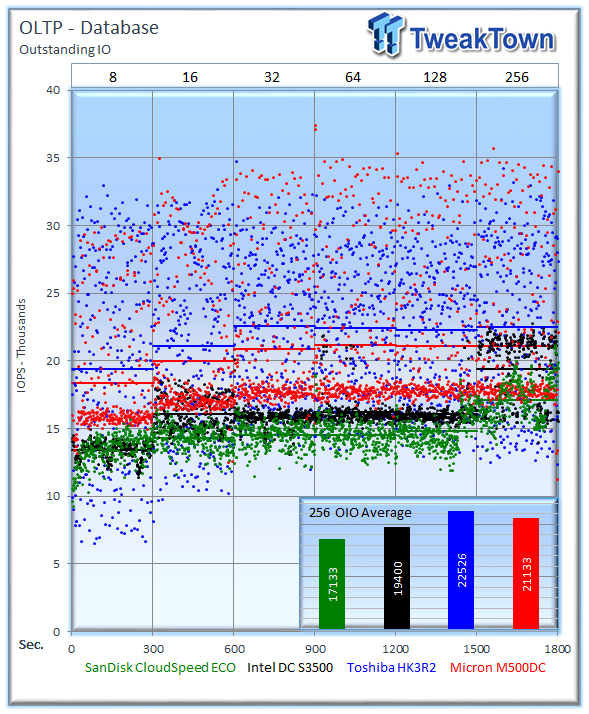
This test consists of Database and On-Line Transaction Processing (OLTP) workloads. OLTP is the processing of transactions such as credit cards and high frequency trading in the financial sector. Databases are the bread and butter of many enterprise deployments. These demanding 8k random workloads with a 66 percent read and 33 percent write distribution bring even the best solutions down to earth. The CloudSpeed Eco trails the other offerings in the OLTP workload.
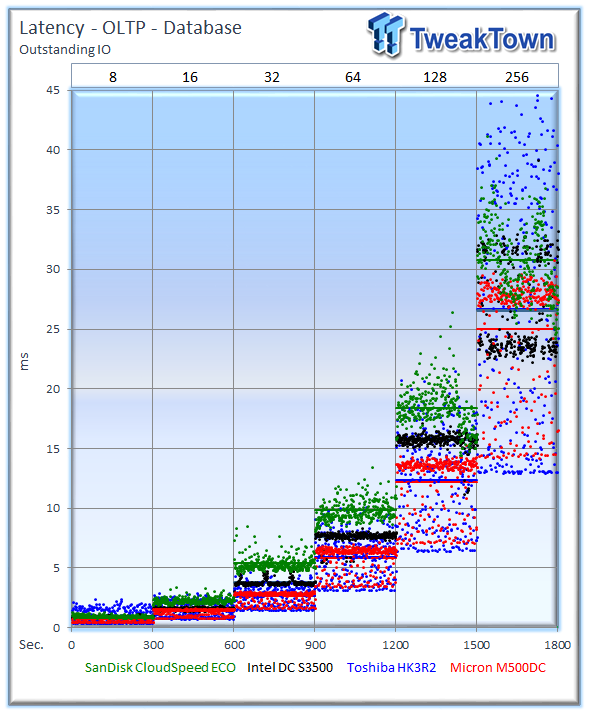
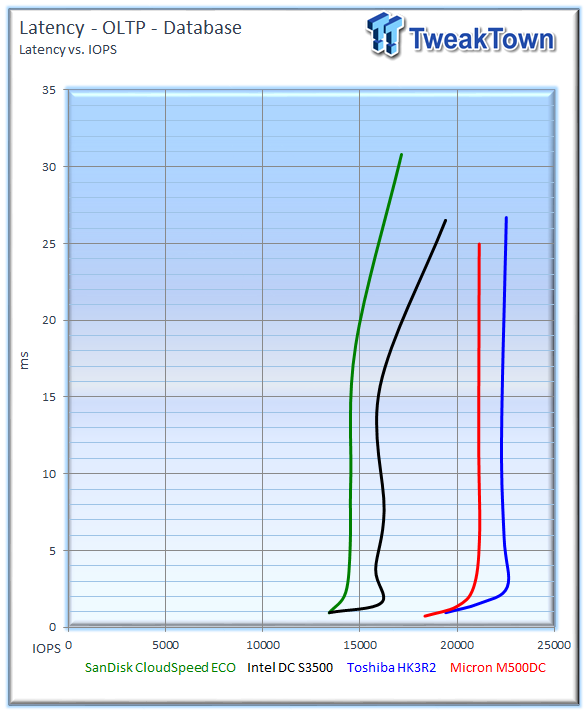
The Eco falls into last place in the latency efficiency testing during this workload.
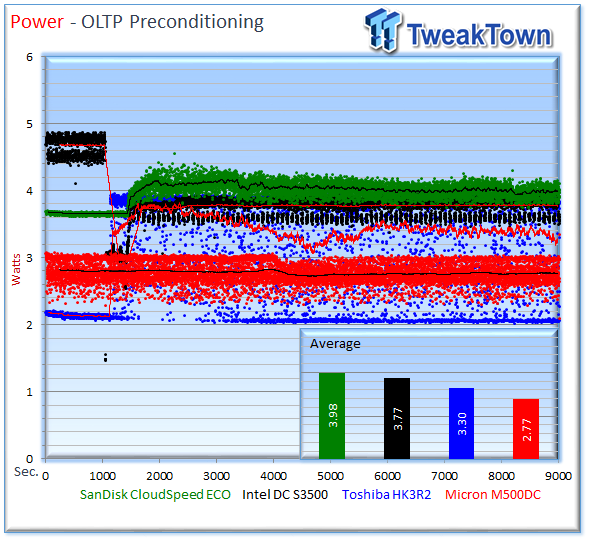
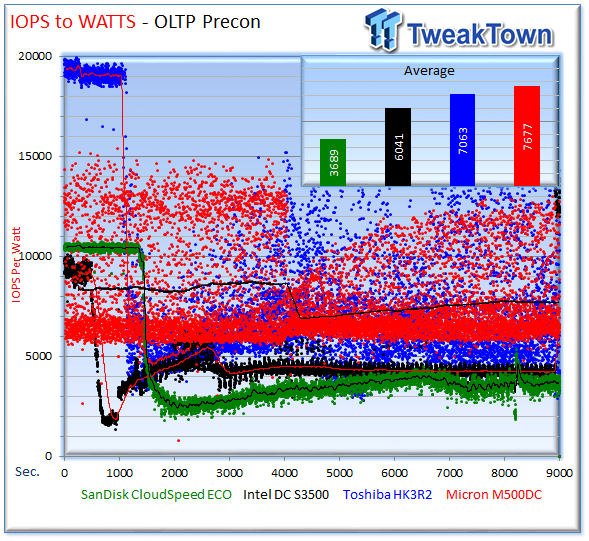
The chart gets muddy with several SSDs in close competition, but the higher power consumption of the Eco reduces its overall efficiency in the OLTP workload.
Web Server
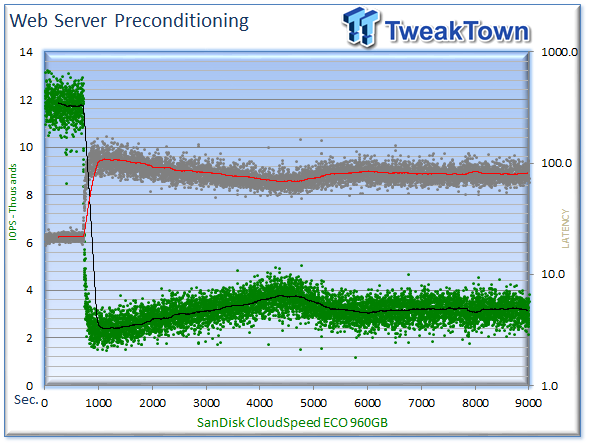
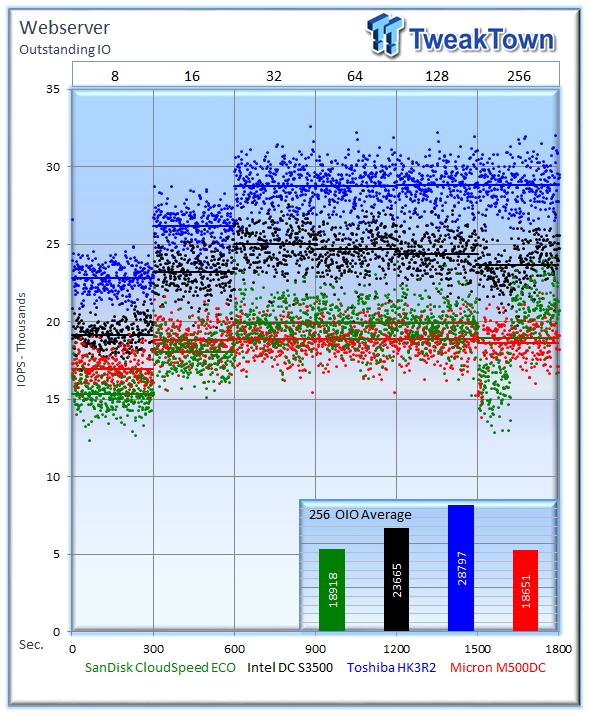
The Web Server workload is read-only, with a wide range of file sizes. Web servers are responsible for generating content users view over the Internet, much like the very page you are reading. The speed of the underlying storage system has a massive impact on the speed and responsiveness of the server hosting the website.
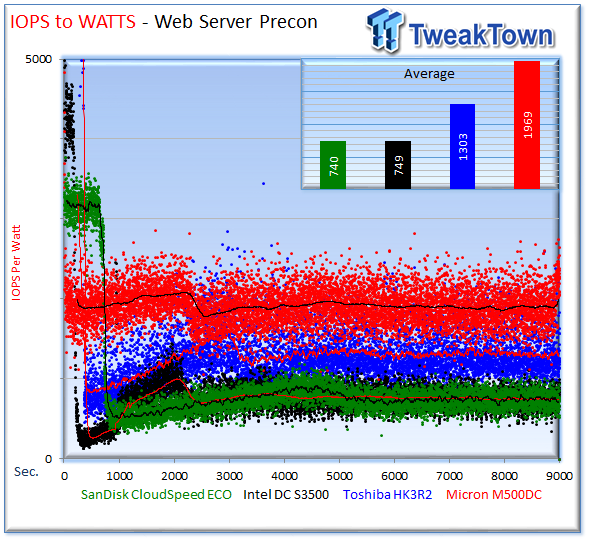
The CloudSpeed Eco leverages its fast read speed to place third in the test, beating the M500DC.
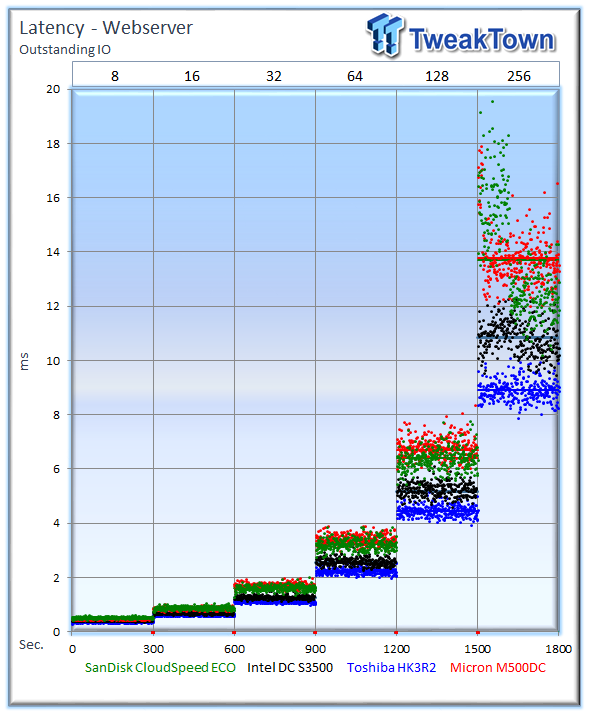
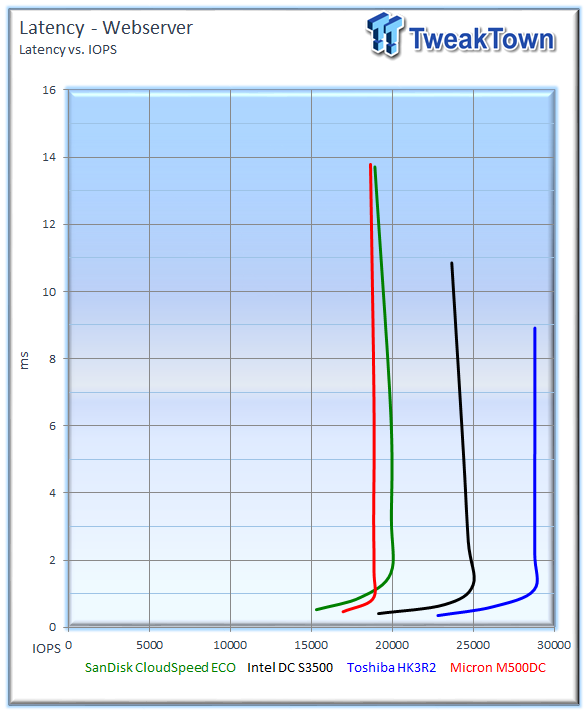
The CloudSpeed Eco places just above the M500DC in latency performance.
Benchmarks - Email Server
File Server
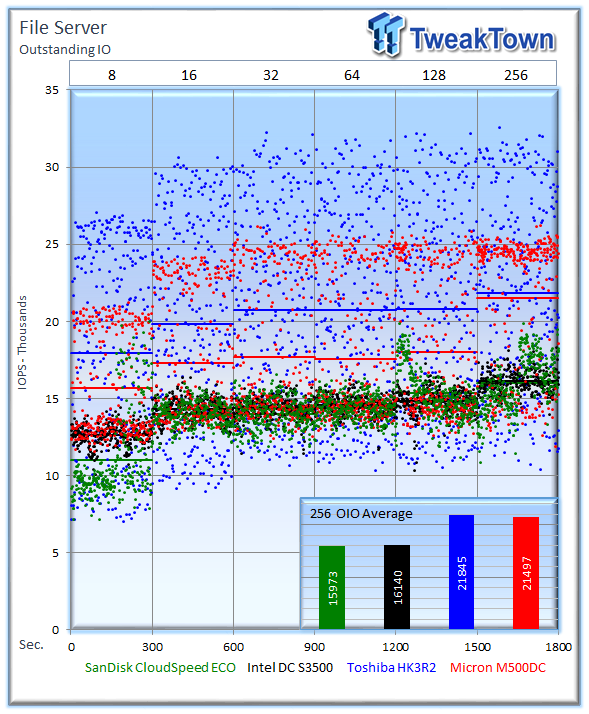
The File Server workload tests a wide variety of different file sizes simultaneously with an 80% read and 20% write distribution. The wide variety of simultaneous file size requests is very taxing on storage subsystems.
The CloudSpeed Eco provides a consistent performance profile during the test, and tracks very closely with the DC S3500.
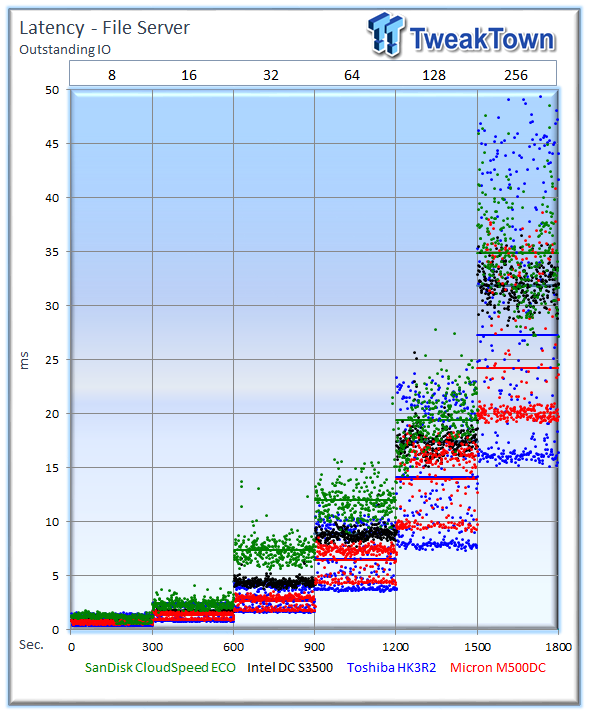
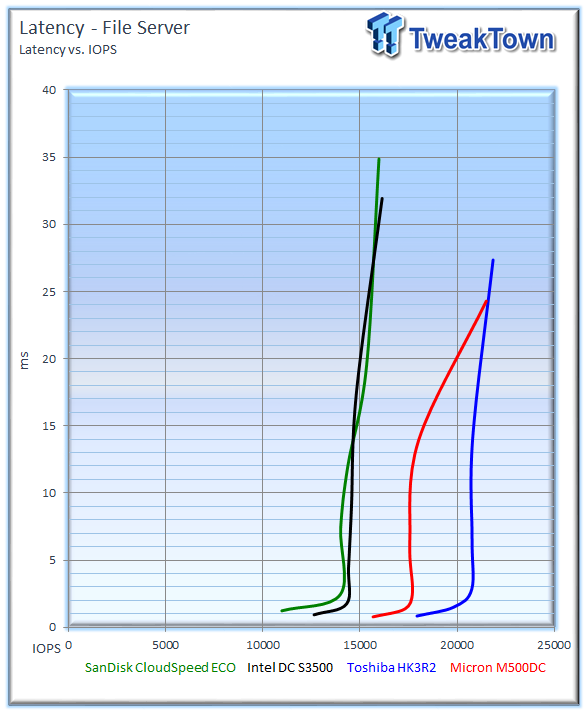
The CloudSpeed Eco continues to compete with the DC S3500 in latency characteristics.
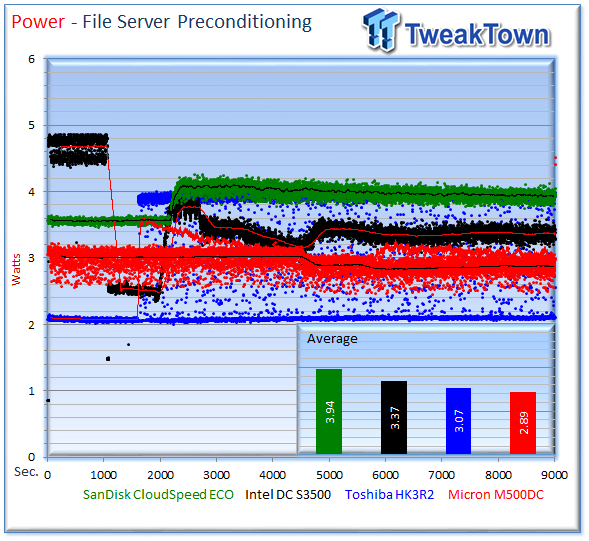
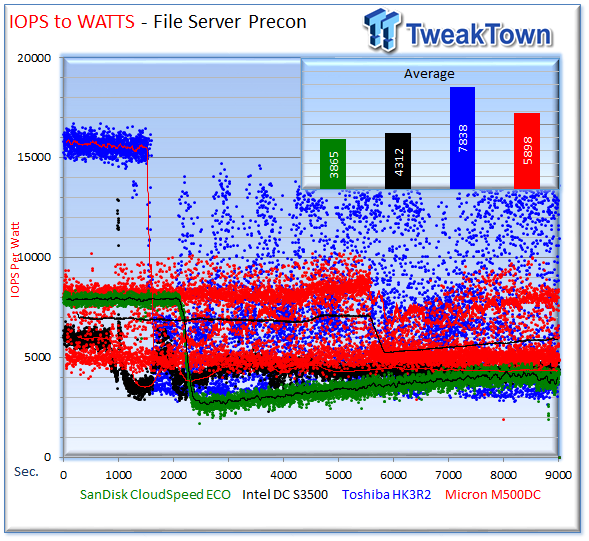
The Eco isn't as competitive with power consumption as the other solutions during the file server workload.
Final Thoughts
The price-conscious SATA segment is incredibly competitive, especially in the OEM space. SanDisk is qualified with five of the largest server vendors, and four of the largest storage vendors. The CloudSpeed Eco leverages a custom Marvell controller with firmware utilizing the Guardian Technology Platform, and is optimized to deliver high capacity and consistent QoS at a very competitive price point.
Top performance is not always the most important factor with the read-centric class of SSDs. Many SSDs can deliver enough performance to satisfy the majority of read-centric workloads. Addressable capacity, which affects the dollar-per-GB of the competing SSDs, comes to the forefront. More addressable capacity directly equates to better TCO. The CloudSpeed Eco exposes a high percentage of its flash as user-addressable capacity. This has an impact on performance, but allows SanDisk to provide very aggressive pricing. The M500DC has very impressive performance metrics, but falls in a higher price-per-GB bracket due to less user-addressable capacity.
SanDisk also offers robust data protection features embedded into their Guardian Technology Platform that provides key features, such as power-loss protection and end-to-end data path protection. The other competitors in this class also feature power-loss protection, which makes this segment particularly competitive on a price basis.
The CloudSpeed Eco's strong suit is solid random read performance in 4k and 8k workloads. The Eco scored lower marks in pure random write workloads, but often exhibited a tighter performance envelope than the competition. The Eco also scored well in our mixed testing with high averages under heavier write workloads, but experienced some variability during the test. The Eco placed second in sequential read and write workloads, providing performance that will address media streaming and VOD workloads well. The mixed sequential testing was encouraging; the Eco took second place in the majority of the test.
The CloudSpeed Eco did not perform as well in our server workloads as other competitors. The CloudSpeed Eco architecture focuses on a consistent QoS in favor of higher peak performance that can result in performance inconsistency. Inconsistent SSDs can hamper RAID performance due to the speed of the RAID array falling to the level of the slowest I/O. Multiple SSDs generating these outlying I/O's in an array compromise overall speed, and the tried-and-true method of boosting performance by adding more SSDs simply multiplies the problem. The Eco displayed a consistent performance profile in many of our tests that will be well suited for RAID arrays.
The CloudSpeed Eco features a lower three-year warranty period than the other SSDs in the test pool, but this is common in the OEM market. SanDisk proprietary Guardian Technology Suite and trusted components deliver an extremely price-competitive SSD geared for read-centric workloads. The Eco's high addressable capacity and low price earns it the TweakTown Best Value Award.
PRICING: You can find the SanDisk CloudSpeed Eco 960GB SSD for sale below. The prices listed are valid at the time of writing, but can change at any time. Click the link to see the very latest pricing for the best deal.
United States: The CloudSpeed Eco 960GB SSD retails for $995.00 at Amazon.
