Introduction
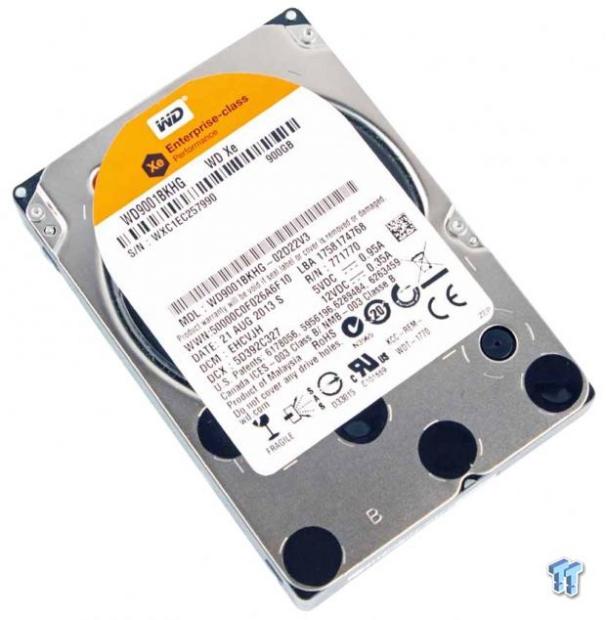
The WD Xe is designed for mainstream server and storage applications. The Xe comes in capacities of 300, 450, 600, and 900 GB in a 2.5-inch form factor. The Xe spins at 10,000 RPM, has 32MB of cache, and features an average latency of 3.6ms. The Xe actually has a dual-core processor to help deliver top performance under the most demanding workloads, and it sports a sustained sequential data rate up to 204 MB/s.
WD provides several solutions for the datacenter, including the WD Re for the most demanding durability, and the WD Se for NAS and scale-out infrastructures. The WD Red fills the role of a drive for smaller deployments that typically service SOHO and SMB environments.
The Xe is the fastest of the WD drives; they currently do not offer a 15k option. The WD Xe actually has up to 67 percent lower power consumption compared to some 15,000 RPM drives, and WD feels the TCO savings are well worth the investment in their mainstream performance hard drive. WD focuses on power conservation, and the Xe draws under 8 watts during operation and 5.2 watts while idle.
The WD Xe has a host of features that enhance performance and reliability, including a full-duplex dual-port 6Gb/s SAS connection. This connection eliminates single point of failure to service HA (High Availability) environments. RAID-specific TLER (Time-Limited Error Recovery) helps protect data during extended hard-drive error recovery processes.
Reliability is always a concern in any environment, and the Xe features WD's StableTrac technology. This secures the motor shaft at both ends to combat vibration, stabilizing the platter for accurate tracking during read and write operations. Reducing vibration is important, but a multi-axis shock sensor that automatically detects and compensates for 'shock events' handles the inevitable vibration induced from multi-drive deployments. These features work in concert with the NoTouch ramp load technology that ensures the recording head never touches the disk's spinning platters. This protects the recording head and media from undue wear and protects the drive during shipment.
This multi-layered approach is topped off with RAFF (Rotary Acceleration Feed Forward) technology to optimize operation and performance in vibration prone environments, which applies to just about every server rack. There are actually two actuators to control the Xe's head movement. One provides coarse displacement using standard electromagnetic actuators, and the secondary actuator uses piezoelectric motion to fine-tune head travel. The head's fly height is adjusted in real-time for optimum performance. The culmination of these enhancements is a robust 2,000,000-hour MTBF.
WD also goes to extreme lengths to test their drives for reliability. Datacenter drives are subjected to over 5 million hours of functional testing, and over 20 million hours of interoperability testing using a vast number of server and storage systems. The drives are also tested during extended thermal burn-in and cycling. WD feels quite confident in their testing program and guarantees the life of the drive with an industry standard five-year warranty.
WD Xe 10k Internals and Specifications
WD Xe 10k Internals


The Xe comes in the standard 15mm 2.5-inch form factor.


The dense foam pads help protect the PCB from vibration, and the white thermal pads allow the controller components to shed heat into the drive housing.
The upper left of the PCB holds two DRAM packages that total 32MB. A Winbond motor controller is placed on the right side of the PCB, and the secondary processor is near the bottom edge.

The Marvell i1248-C2 controller is the primary controller for the drive.

The SAS 6Gb/s connection provides the SCSI command set and dual-port functionality.
WD Xe 10k Specifications
The Xe series also offers an SED option with the AES-256 encryption engine for Crypto erase functionality. The drive is rated for 600,000 load/unload cycles and has a non-recoverable read errors per bits read ranking of 10 in 10E17.
The Xe is also available in a WDxxxHKHG model. The 2.5-inch drive is mounted into a 3.5-inch adaptor that also acts as a large heat sink. This keeps the drive cool and allows for compatibility in legacy applications.


Test System and Methodology


Our approach testing storage is designed specifically to target long-term performance with a high level of granularity. Many testing methods record peak and average measurements during the test period. These average values give a basic understanding of performance but fall short in providing the clearest view possible of I/O Quality of Service (QoS).
'Average' results do little to indicate the performance variability experienced during actual deployment. The degree of variability is especially pertinent as many applications can hang or lag as they wait for I/O requests to complete. This testing methodology illustrates performance variability and includes average measurements during the measurement window.
While under load, all storage solutions deliver variable levels of performance. While this fluctuation is normal, the degree of variability is what separates enterprise storage solutions from typical client-side hardware. Providing ongoing measurements from our workloads with one-second reporting intervals illustrates product differentiation in relation to I/O QoS. Scatter charts give readers a basic understanding of I/O latency distribution without directly observing numerous graphs.
Consistent latency is the goal of every storage solution, and measurements such as Maximum Latency only illuminate the single longest I/O received during testing. This can be misleading as a single 'outlying I/O' can skew the view of an otherwise superb solution. Standard Deviation measurements consider latency distribution but do not always effectively illustrate I/O distribution with enough granularity to provide a clear picture of system performance. We use histograms to illuminate the latency of every single I/O issued during our test runs.
We measure power consumption during test runs. This provides measurements in time-based fashion, with results every second, to illuminate power consumption behavior. This significantly affects the TCO of the storage solution. We also present IOPS-to-Watts measurements to highlight the efficiency of the storage solution.
We conduct our tests over the full LBA range to allow each HDD to highlight its average performance. The Seagate Enterprise Performance v7 is a 1.2TB capacity drive, while the WD Xe and the Toshiba AL13SEB900 are both 900GB drives. These varying capacities should be taken into account when viewing results. The first page of results provides the 'key' to understanding and interpreting our test methodology.
4k Random Read/Write
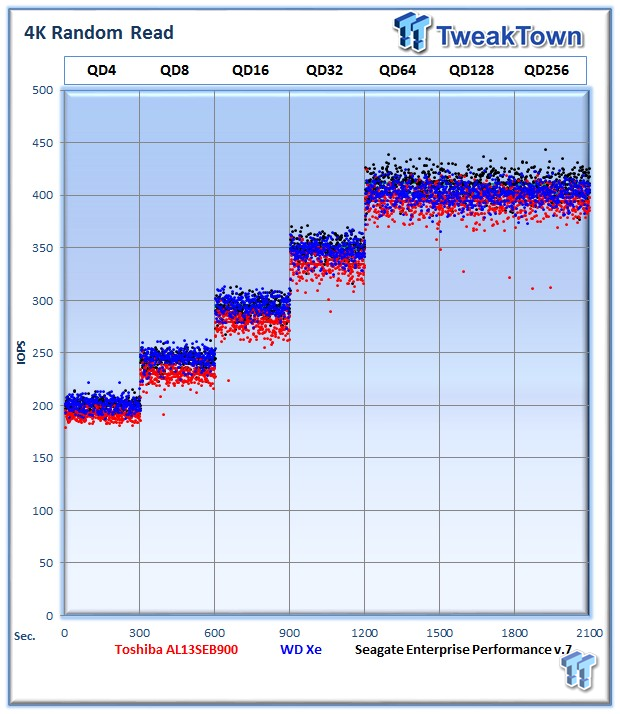
Each QD for every parameter tested includes 300 data points (five minutes of one second reports) to illustrate the degree of performance variability. The line for each QD represents the average speed reported during the five-minute interval.
4k random speed measurements are an important metric when comparing drive performance as the hardest type of file access for any storage solution to master is small-file random. One of the most sought-after performance specifications, 4k random performance is a heavily marketed figure.
The WD Xe provides 402 4k random read IOPS at QD256. The Toshiba AL13SE averages 394 IOPS, while the Seagate v7 leads the heavy 4k read workload with an average of 410 IOPS at QD256.

The WD Xe doesn't provide as robust performance with lower thread counts, but it rises to the challenge as the load intensifies with an average of 402 IOPS at QD256. This trails the AL13SE's 380 IOPS and the v7, which averages 365 IOPS.

Our write percentage testing illustrates the varying performance of each solution with mixed workloads. The 100 percent column to the right is a pure write workload of the 4k file size, and 0 percent represents a pure 4k read workload.
The Xe starts out well with a heavy read workload but slows as we mix in more write activity.

The WD Xe delivers more commands within a lower latency range than the other drives, but it unfortunately also has a number of operations dispersed within the higher latency ranges, muddying the performance picture.

We record the power consumption measurements during our test run at QD256.
The WD Xe really leads in this test by a large margin with a very conservative power draw of 5.76 watts. The AL13SE pulls 6.78 watts during the measurement window, slightly higher than the v7, which averaged 6.88W.


IOPS to Watts measurements are generated from data recorded during our test. The WD Xe tops both IOPS to Watts charts, highlighting that even with its lower write performance, it can deliver excellent efficiency.
8k Random Read/Write

8k random read and write speed is a metric that is not tested for consumer use, but this is an important aspect of performance for enterprise environments. With several different workloads relying heavily upon 8k performance, we include this as a standard with each evaluation. Many of our Server Emulations below will also test 8k performance with various mixed read/write workloads.
The WD Xe averages 395 IOPS, and the Toshiba AL13SE delivers an average of 389 IOPS at QD256. The Seagate v7 averages 404 IOPS.

The WD Xe exhibits the same tendency for less performance at lower queue depths with random write activity. The Xe delivers 340 IOPS at QD256, the AL13SE is at 377 IOPS, and the v7 measures in at 361 IOPS.
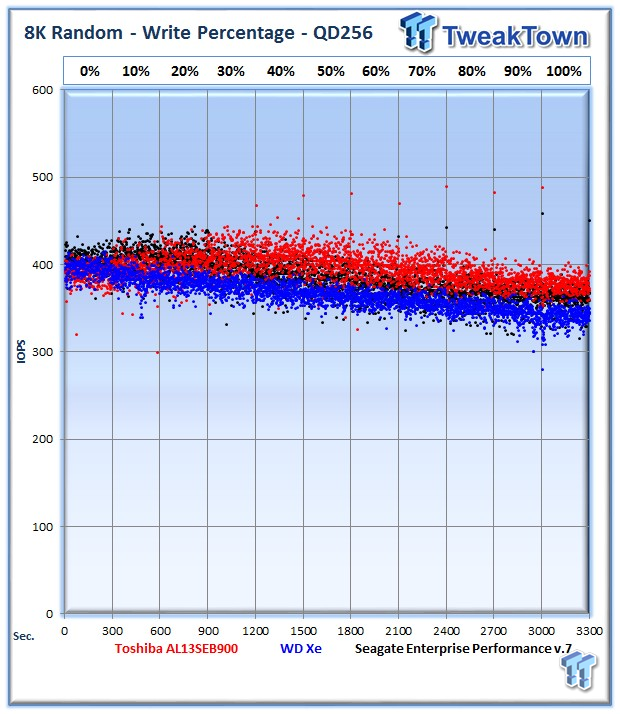
The WD Xe again tops the charts with heavy read activity on the left, but it loses ground as we move to the right.

The wide range of latency is not quite as orderly as the other two drives in the test pool.

The WD Xe again exhibits excellent power consumption with a low average of 7.01 watts. This is nearly a 1.5 watt advantage, a big deal when we stack up hundreds of drives in a production environment.


The WD Xe leans on its stellar power consumption to provide enhanced efficiency.
128k Sequential Read/Write

The 128k sequential speeds reflect the maximum sequential throughput of the HDD using a realistic file size encountered in an enterprise scenario.
The WD Xe cuts across its platter very quickly as evidenced by the seesaw looking performance figures. This effect stems from the heads flying across the whole platter during each test period. The Xe averages 179 MB/s, the Toshiba AL13SE averages 184 MB/s, and the Seagate v7 takes the lead with its average of 195 MB/s.

The WD Xe averages 179 MB/s, the AL13SE 182 MB/s, and the Seagate leads again with 195 MB/s.

The Xe provides solid performance in the mixed read/write testing.

The WD Xe exhibits good consistency in this test, but the Seagate drive delivers lower overall latency.

The WD Xe again delivers a dominating performance in power consumption, drawing a miserly 6.22 watts.


It was not hard to predict the Xe would win the efficiency testing due to its conservative power draw.
Database/OLTP and Web Server
Database/OLTP

This test emulates Database and On-Line Transaction Processing (OLTP) workloads. OLTP is in essence the processing of transactions such as credit cards and high frequency trading in the financial sector. Enterprise HDDs are uniquely well suited for the financial sector with their low latency and high random workload performance. Databases are the bread and butter of many enterprise deployments. These are demanding 8k random workloads with a 66 percent read and 33 percent write distribution that can bring even the highest performing solutions down to earth.
The WD Xe averages 371 IOPS at QD 256. The AL13SE and the v7 are nearly too close to call with only 2 IOPS separating the two drives in this test.


The XE averages 6.79 watts. The AL13SE averages 7.71 watts during the test period, and v7 has a 7.56W average.

The WD Xe ekes out the win among the trio.
Web Server

The Web Server profile is a read-only test with a wide range of file sizes. Web servers are responsible for generating content for users to view over the Internet, much like the very page you are reading. The speed of the underlying storage system has a massive impact on the speed and responsiveness of the server that is hosting the website.
The WD Xe leans on its great read performance to deliver 389 IOPS at QD256; the AL13SE takes the lead with 399 IOPS, while the AL13SE trails with 381 IOPS.


The WD Xe averages 7.02 watts.

The WD Xe delivers an average of 54 IOPS per Watt.
File Server and Email Server
File Server

The File Server profile represents typical file server workloads. This profile tests a wide variety of different file sizes simultaneously with an 80 percent read and 20 percent write distribution.
The Xe lags behind the other two drives with an average of 478 IOPS; the AL13SE averages 514 IOPS at QD256, and the v7 leads with an average of 527 IOPS.
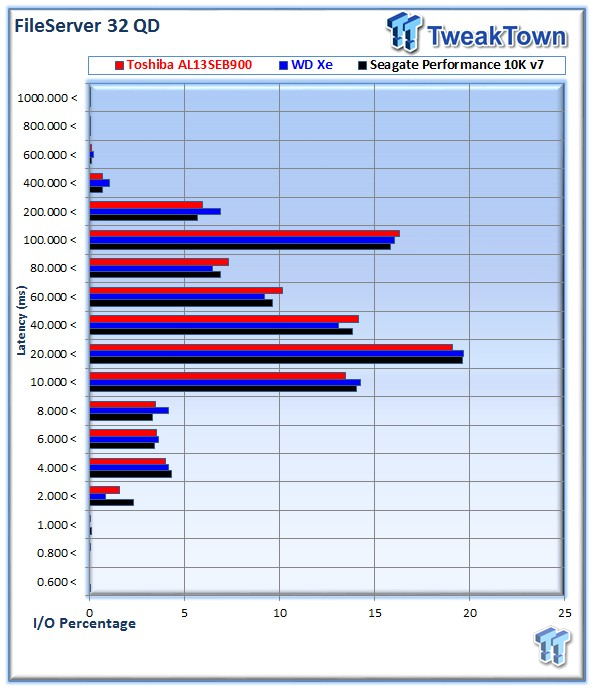
The v7 takes a slight lead in latency performance.


The Xe sucks a miserly 7 watts, but it loses its only efficiency test during our regimen.
Email Server

The Email Server profile is a very demanding 8k test with a 50 percent read and 50 percent write distribution. This application is indicative of the performance of the solution in heavy write workloads.
This heavy write workload leads to an average of 363 IOPS from the WD Xe. The AL13SE wins with an average of 391 IOPS, beating the 383 IOPS from the v7.


The WD Xe consumes only 7.22 watts during the test.

The difference between drives is nearly indistinguishable in the power and efficiency testing.
Final Thoughts
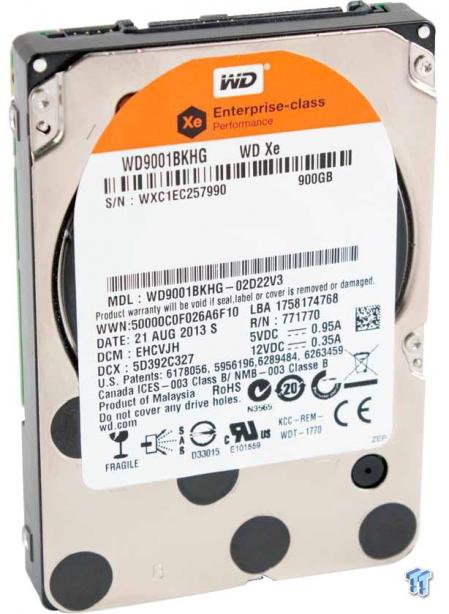
WD has chosen to sit out the 15k RPM market segment. Instead, WD offers a range of products from the NAS-centric IntelliPower WD RED to the 7,200 RPM WD Se and Re for the datacenter. Their subsidiary HGST has a 15k model, but for WDk the Xe is the top of the performance segment. The WD Xe and the Toshiba AL13SE top out at 900 GB, while the Seagate Enterprise Performance v7 has the capacity lead at 1.2TB.
The Xe did not regularly top our charts during testing, but it does have its strengths. The random read performance was superior to the two competing drives, and this high read performance resulted in a good score in our read-heavy webserver testing. Sequential testing was a bright spot for the Xe, and it also excelled at mixed sequential workloads.
The WD Xe unfortunately suffers lower random write performance than its competitors, particularly at lower queue depths. These drives are designed for demanding applications, but performance at the lower queue depths is important in light and bursty workloads. This lower write performance became clear in our write percentage testing where the Xe quickly lost steam as we mixed in a heavier write workload.
The WD Xe consistently provided superior power consumption in comparison to the Toshiba AL13SE and the Seagate Performance v7. This frugal power consumption is matched with a commanding lead in our IOPS to Watts performance measurements. This crucial metric can make a massive difference in TCO over the operational life of the units.
A difference of a 1-1.5 watts in most workloads will equate to massive power and energy savings in a production environment. Hundreds, and sometimes thousands, of drives per deployment add to energy costs quickly. The ongoing power cost will total more than the initial capital expenditure to purchase the drives. With huge power savings over its rivals, the WD Xe has carved itself out quite the niche.
While the difference in performance in most workloads was a handful of IOPS, the tremendous gains in power efficiency will outweigh the performance for many customers. In the majority of production environments, drives are deployed en masse into RAID and parity environments. These groupings of drives can mask small performance differences between drive models.
The WD Xe certainly does not skimp on enterprise-class features. WD has infused the Xe with a healthy dollop of their core IP, including StableTrac, RAFF, NoTouch ramp load technology, and RAID specific TLER. The Xe has been through significant pre-launch testing and has spent an extended period in general availability. The focus on quality leads to a MTBF of 2,000,000 hours and a five-year warranty.
In the enterprise space, measuring the merits of every storage device on performance alone is a foolhardy proposition. Instead, there is a complex mixture of factors that come into play. With advanced tiering and caching systems maximizing the performance tier, power consumption is becoming a larger factor.
PRICING: You can find the Western Digital Xe for sale below. The prices listed are valid at the time of writing but can change at any time. Click the link to see the very latest pricing for the best deal.
United States: The Western Digital Xe (900GB) retails for $350.00 at Amazon.
Canada: The Western Digital Xe (900GB) retails for CDN$780.75 at Amazon Canada.

