
Introduction

For the last eight months we've tried to get this drive in for review and we've finally made it happen. The Mushkin Chronos Deluxe 480GB isn't highest performing drive on the market today, although it was very close to the top when we started working with Mushkin to get this model over to us. It doesn't come with an extravagant accessory package and it's not even that cool to look at with a fairly dull gray case. So why did we want one in for a review so bad? The price.
For nearly a year now the Mushkin Chronos DX 480GB has led the price war in this capacity size. Others have dipped into the DX's price territory on a few occasions, but nothing has been there for long. At the time of writing, Newegg had the 480GB model in stock and listed at $339.99. A year ago 240GB SSDs sold for around that same amount. Several times in the last eight months Newegg had a special on the Chronos Deluxe and the price dipped to just $299.99.
There are two Chronos models, the base Chronos with asynchronous NAND flash and the Deluxe model with synchronous flash�.i.e. the good stuff. It's important to point out, this isn't the drive you want to overlook, this is the good stuff and its current price is less than many others async flash drives.
For this price you are getting a whole lot of drive with a whole lot of storage space.
Specifications, Pricing and Availability

Mushkin offers the Chronos Deluxe in several capacity sizes and even in two form factors. The form factors are 9.5mm, or standard notebook size and 7mm, the new ultrabook slim form factor.
The capacity ranges from 60GB to the 480GB model we're looking at today. There are a few odd stops along the way, 90GB and 180GB accompany the usual 60GB, 120GB, 240GB and 480GB. Mushkin also makes a Chronos non-DX model, but this model uses asynchronous flash and is not the same as the DX we are using today.
The performance varies for each capacity size and the largest 480GB size has a few oddities. It offers excellent LSI SandForce sequential performance, but the 4K write speed in this size is lower than the 240GB drive. Mushkin specs the Chronos DX 480GB at 540MB/s sequential read and 455MB/s sequential write speeds.
We've wanted to review this model for a long time because of the price. At the time of writing Newegg lists the 480GB Chronos DX for $339.99. We've seen this capacity size sell off and on at Newegg for as low as $299.99. That makes the Mushkin Chronos Deluxe the lowest priced large capacity on the market today with good synchronous or Toggle Mode flash.
The Chronos Deluxe line ships with a standard three year warranty, desktop adapter bracket and mounting screws for the installation.
Packaging

The Mushkin 2.5" SSD packaging changed quite a bit since we reviewed the 240GB Chronos Deluxe more than a year ago. Mushkin uses a long flat box instead of a shorter, fat one.

On the back Mushkin advertises their other products, but doesn't give us a lot of information about the drive inside the package.

The inner package is made from plastic and keeps the drive secure and all of the accessories from moving around.
Mushkin Chronos DX 480GB SSD

Here we get our first look at the actual drive. Mushkin offers two versions of the Chronos DX, the 9.5mm Z-height version we have on hand and a new 7mm version for ultrabook installations.

The case is sturdy aluminum all the way around and all of the mounting positions are located where they should be.

The beveled edge adds a bit of pizzazz to the outside of the drive.

The included desktop adapter bracket offsets the drive so the SATA power and data connectors are closer to being in line with your existing 3.5" HDDs.

Inside we found a LSI SandForce SF-2281 VB1 controller and sixteen Micron 25nm synchronous flash chips.

You may recall the last time we reviewed the Chronos Deluxe, in 240GB capacity size, the drive used 24nm Toshiba Toggle flash. The 24nm Toshiba has dried up now that the factory is producing 19nm flash. The 19nm is still a bit difficult to source, but supplies are starting to pick up.
Benchmarks - Test System Setup and ATTO Baseline Performance
Desktop Test System

Lenovo W530 - Mobile Workstation
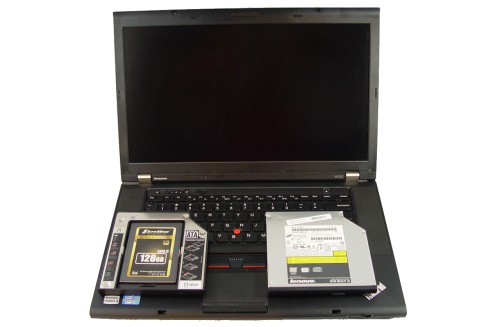
We use two systems for SSD testing. The desktop runs a majority of the tests and the Lenovo W530 runs the notebook power tests as well as the real-world file transfer benchmark.
ATTO Baseline Performance
Version and / or Patch Used: 2.34
ATTO is used by many disk manufacturers to determine the read and write speeds that will be presented to customers.

In ATTO we achieved 548MB/s read performance and 525MB/s write performance in our initial best case test at QD4. This is a good start for the Chronos DX 480GB. Let's see how it does in the more advanced tests.
Benchmarks - Sequential Performance
HD Tune Pro
Version and / or Patch Used: 4.00
Developer Homepage: http://www.efdsoftware.com
Product Homepage: http://www.hdtune.com
HD Tune is a Hard Disk utility which has the following functions:
Benchmark: measures the performance
Info: shows detailed information
Health: checks the health status by using SMART
Error Scan: scans the surface for errors
Temperature display
HD Tune Pro gives us accurate read, write and access time results and for the last couple of years has been gaining popularity amongst reviewers. It is now considered a must have application for storage device testing.

We have a handful of other large capacity drives in the chart today to compare the Mushkin Chronos Deluxe. The controller and flash combination in the Chronos DX has proven itself many times and delivers predictable performance over a long period of time. In our sequential read test we achieved an average read speed of just over 426MB/s.

The sequential write speed measured at 408MB/s with compressible data. We'll look at incompressible data deeper in the review.
Benchmarks - AIDA64 Random Access Time
AIDA64 Random Access Time
Version and / or Patch Used: 1.60
Developer Homepage: http://www.aida64.com
Product Homepage: http://www.aida64.com
AIDA64 offers several different benchmarks for testing and optimizing your system or network. The Random Access test is one of very few if not only that will measure hard drives random access times in hundredths of milliseconds as oppose to tens of milliseconds.
Drives with only one or two tests displayed in the write test mean that they have failed the test and their Maximum and possibly their Average Scores were very high after the cache fills. This usually happens only with controllers manufactured by JMicron and Toshiba.

We measured the read latency at .09ms average; this is consistent with other LSI SandForce drives using similar flash.

The same can be said for the write latency. We're not really going to run into anything significantly different today with the performance from a hundred other drives before the Chronos Deluxe. The main thing is the capacity size and the price.
Benchmarks - Anvil Storage Utilities
Anvil Storage Utilities
Version and / or Patch Used: RC5
So what is Anvil Storage Utilities? First of all, it's a storage benchmark for SSDs and HDDs where you can check and monitor your performance. The Standard Storage Benchmark performs a series of tests, you can run a full test or just the read or the write test or you can run a single test, i.e. 4K DQ16.
Anvil Storage Utilities is not officially available yet but we've been playing with the beta for several months now. The author, Anvil on several international forums has been updating the software steadily and is adding new features every couple of months.
The software is used several different ways and to show different aspects for each drive. We've chosen to use this software to show the performance of a drive with two different data sets. The first is with compressible data and the second data set is incompressible data. Several users have requested this data in our SSD reviews.
Fill Compressible Data

Incompressible Data

Here we see a few key issues with the Mushkin Chronos Deluxe 480GB. The first is the lower 4K performance on the 480GB capacity size. The SandForce architecture doesn't use a DRAM buffer to store table data so that information comes from the NAND and internal buffers. 480GB of space is a lot of information to keep track of.
The second issue is the incompressible data performance. This is an area where SandForce based SSDs are slower than others on the market.
Scaling Read IOPS through Queue Depth

Here we see a list of random read 4K IOPS performance as measured in Anvil. Companies like to talk about their high IOPS performance, but those only come at high queue depths. Desktop users rarely hit high queue depths so lower IOPS rating are what should be looked at when comparing daily use performance. The Mushkin Chronos DX 480GB does very well in the QD1, QD2 and QD4 test, even against the new OCZ Vector 512GB.
Scaling Write IOPS through Queue Depth

The Mushkin Chronos DX 480GB is significantly slower than the other drives in the chart when writing 4K data.
Benchmarks - CrystalDiskMark
CrystalDiskMark
Version and / or Patch Used: 3.0 Technical Preview
Developer Homepage: http://crystalmark.info
Product Homepage: http://crystalmark.info/software/CrystalDiskMark/index-e.html
Download here: http://crystaldew.info/category/software/crystaldiskmark
CrystalDiskMark is a disk benchmark software that allows us to benchmark 4K and 4K queue depths with accuracy.
Key Features:-
* Sequential reads/writes
* Random 4KB/512KB reads/writes
* Text copy
* Change dialog design
* internationalization (i18n)
Note: Crystal Disk Mark 3.0 Technical Preview was used for these tests since it offers the ability to measure native command queuing at 4 and 32.

Incompressible data doesn't affect reads as we see here in CDM.

Incompressible data when writing to the drive slow the DX 480GB down quite a bit. Here we see the sequential performance drop to just 281MB/s.
Benchmarks - PCMark Vantage Hard Disk Tests
PCMark Vantage - Hard Disk Tests
Version and / or Patch Used: 1.0.0
Developer Homepage: http://www.futuremark.com
Product Homepage: http://www.futuremark.com/benchmarks/pcmark-vantage/

PCMark Vantage is the first objective hardware performance benchmark for PCs running 32 and 64 bit versions of Microsoft Windows Vista. PCMark Vantage is perfectly suited for benchmarking any type of Microsoft Windows Vista PC from multimedia home entertainment systems and laptops to dedicated workstations and high-end gaming rigs. Regardless of whether the benchmarker is an artist or an IT Professional, PCMark Vantage shows the user where their system soars or falls flat, and how to get the most performance possible out of their hardware. PCMark Vantage is easy enough for even the most casual enthusiast to use yet supports in-depth, professional industry grade testing.
FutureMark has developed a good set of hard disk tests for their PCMark Vantage Suite. Windows users can count on Vantage to show them how a drive will perform in normal day to day usage scenarios. For most users these are the tests that matter since many of the old hat ways to measure performance have become ineffective to measure true Windows performance.

HDD1 - Windows Defender
HDD2 - Gaming
HDD3 - Windows Photo Gallery
HDD4 - Vista Startup
HDD5 - Windows Movie Maker
HDD6 - Windows Media Center
HDD7 - Windows Media Player
HDD8 - Application Loading
So far we've singled out individual performance aspects of the Mushkin Chronos DX 480GB, but real-world performance is a mixture of everything. This is where the LSI SandForce controller really shines, in daily use, real-world environments. With the drive empty, we see the Deluxe as a well rounded drive that is faster than some of the newer products on the market in some tests and even keeps pace with the other drives in the others.
Benchmarks - PCMark Vantage - Drives with Data Testing
For a complete breakdown on the Drives with Data Testing please read this article. You will be able to perform this test at home with the files provided in the article - full instructions are included.
- Brief Methodology
SSDs perform differently when used for a period of time and when data is already present on the drive. The purpose of the Drives with Data testing is to show how a drive performs in these 'dirty' states. SSDs also need time to recover, either with TRIM or onboard garbage collection methods.
Drives with Data Testing - 25%, 50%, 75% Full States and Dirty / Empty Test
Files needed for 60 (64GB), 120 (128GB), 240 (256GB)
60GB Fill - 15GB, 30GB, 45GB
120GB Fill - 30GB, 60GB, 90GB
240GB Fill - 60GB, 120GB, 160GB
Empty but Dirty - a test run just after the fill tests and shows if a drive needs time to recover or if performance is instantly restored.

The SandForce architecture is also a strong performer when data resides on the drive since it compresses data that is compressed. That means not all of the data gets stored on the flash so more spare area is available for background tasks and keeping the drive running faster. This is a big advantage for the Mushkin Chronos Deluxe as you can see in our chart. Using the 50% capacity filled, the DX is faster than all of the other SSDs on the chart.
Benchmarks - BootRacer
BootRacer - System Boot Time
Version and / or Patch Used: 4.0
Developer Homepage: Greatis
Product Homepage: BootRacer
Download here: http://www.greatis.com/bootracer/download.htm
Note: In this test we use the Lenovo W530 Mobile Workstation loaded with an operating system and several program files. The data on the drive at the time of the test is 45GB. The second test, 50GB Free, was run with the drives filled with block data until only 50GB of free capacity remained.

The time taken to boot into Windows doesn't change significantly either in our two tests. Here we have the first test with a fairly fresh install with only 25GB of the capacity taken. In the second test only 50GB remains out of the 512GB total flash available, that's 462GB used on the drive and the boot time increases by less than a second.
Benchmarks - DiskBench
DiskBench - Directory Copy
Version and / or Patch Used: 2.6.2.0
Developer Homepage: Nodesoft
Product Homepage: DiskBench
Download here: http://www.nodesoft.com/diskbench/download
Note: In this test we use the Lenovo W530 Mobile Workstation and a SuperSSpeed S301 SLC 128GB SSD to move a 15GB block of data to and from the target drive. This is part of our real world test regiment. Roughly 45GB of data resides on the target drive before the '15GB Block' is transfer. The 15GB Block is the same data we built for the Data on Disk Testing and is a mix of compressible and incompressible data.

All of the drives in this chart manage to read mixed data (compressible and incompressible) for transfers at around 300MB/s. Writing data from a file transfer is where we see significant differences. The Chronos DX 480GB managed to write mixed data at 252MB/s.
Benchmarks - Power Testing
Bapco MobileMark 2012 1.5
Version and / or Patch Used: 2012 1.5
Developer Homepage: http://www.bapco.com
Test Homepage: http://www.bapco.com
MobileMark 2012 1.5 is an application-based benchmark that reflects usage patterns of business users in the areas of office productivity, media creation and media consumption. Unlike benchmarks that only measure battery life, MobileMark 2012 measures battery life and performance simultaneously, showing how well a system design addresses the inherent tradeoffs between performance and power management.

Surprisingly power consumption is a bit high on the Chronos DX as seen in our notebook power test. There are many things that contribute to the power consumption on an SSD. To keep it simple we don't get into analyzing voltage regulators used and all of the tiny details since the overall power consumption is what's important.
PCMark Vantage HDD Test - Power Draw

Here we get a chance to see why the power consumption is so high on the Chronos DX 480GB. The idle power is a little higher than the OCZ Vertex 3 (light lime green). When writing data to the flash, the DX 480GB uses more power than any other drive on our chart. The tall spikes are random writes, the DX 480GB does really well there, but the higher idle and sequential reads really hurt this drive when measuring power consumption.
Final Thoughts

We can type about any performance short comings until we are blue in the fingers or about how new technology is starting to push LSI SandForce products to the back of the bus, but none of that really matters. Above we see the Newegg listing for the Chronos DX 480GB (on the left) and the Chronos 480GB base model (on the right). The one you want is the DX that we reviewed today and it's only $20 more than the asynchronous flash model and $30 less than the next lowest priced SSD with synchronous flash in this capacity group (480GB - 512GB). The Mushkin Chronos Deluxe 480GB is the lowest cost, good drive on the market.
With the price laid out we can talk a bit about performance. The LSI SandForce architecture is very good, even in its old age for an SSD. The data compression makes it so drives like the Mushkin Chronos DX can still compete with the newer products because they are still very fast, even comparable to drives that just hit the market.
The 50% of capacity fill test gives us a good understanding of what's really happening to SSDs when you get a lot of data on the drives and how they behave. When looking at that corner case, and it is a very big corner, the Mushkin Chronos DX does very well against the new drives on the market and is even a little faster than nearly all of them.
What you end up with is a drive that costs much less than it really should, performs very well and offers a lot of storage space. If you're looking for a high capacity SSD, this is the one you should consider first unless you want to spend $200 more on a product that performs a little faster before you start stuffing data on it.

 United
States: Find other tech and computer products like this
over at
United
States: Find other tech and computer products like this
over at  United
Kingdom: Find other tech and computer products like this
over at
United
Kingdom: Find other tech and computer products like this
over at  Australia:
Find other tech and computer products like this over at
Australia:
Find other tech and computer products like this over at  Canada:
Find other tech and computer products like this over at
Canada:
Find other tech and computer products like this over at  Deutschland:
Finde andere Technik- und Computerprodukte wie dieses auf
Deutschland:
Finde andere Technik- und Computerprodukte wie dieses auf  Samsung is preparing to create the world's first petabyte SSD
 NASA reveals plans to build levitating robots on the surface of the Moon
 This DIY user built his own 256-core RISC-V Megacluster CPU running at 14.7GHz
 AMD's high-end Ryzen AI 'Strix Halo' APUs spotted: 16C/32T Zen 5, 120W TDP, 64GB memory
 Halo and Destiny creator Bungie's first big game is free on Steam
 Corsair 6500X Mid-Tower Dual Chamber Chassis Review
 Corsair MP700 Pro SE 4TB SSD Review - As Fast as They Come
 Corsair MP600 Mini 2024 Edition 1TB SSD Review - Fastest Tiny Drive on the Planet
 Lexar SL500 1TB Portable SSD Review - The best of native USB
 Corsair Platform:6 Elevate Modular Desk Review
 4K Blu-ray Review") True Lies (1997) 4K Blu-ray Review
True Lies (1997) 4K Blu-ray Review Fractal Design North XL Full-Tower Chassis Review
 Western Digital WD Gold 24TB HDD Review - High-Capacity Masterpiece
 AOC U27G3X 27-inch Gaming Monitor Review - 4K 160Hz for $500
 MSI Vector GP68HX Gaming Laptop Review
 Building the Ultimate Home Entertainment Server with an ASUSTOR NAS and Viper Gaming NVMe SSDs
 Everything you need to know about the latest ASUS NUC Mini PCs - NUC 14 Pro and ROG NUC
 How to Overclock Your GPU and Boost Your PC Gaming with ASUS GPU Tweak III
 ASUS's AMD Radeon RX 7000 Series GPU lineup has something for every gamer
 ASUS OLED Premium Care defends the ROG Swift OLED PG32UCDM gaming monitor from burn-in