The Bottom Line
Introduction, Drive Specifications, Pricing and Availability
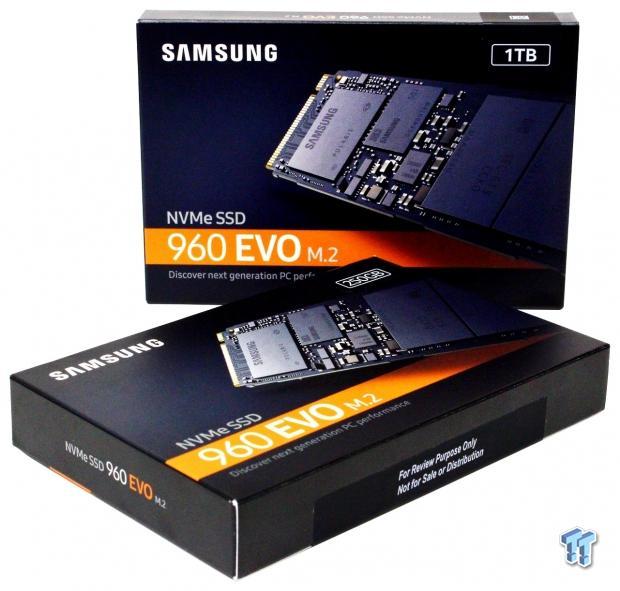
Right on the heels of releasing the world's fastest consumer SSD, the 960 Pro, Samsung drops the hammer again by releasing their 960 EVO. With the 960 Pro, Samsung targeted professionals and enthusiasts willing to pay a premium to have the best performance money can buy. With the 960 EVO, Samsung is targeting the mainstream market where affordability is the key ingredient. Samsung's 960 EVO strikes a perfect balance between price and performance. Facilitating the 960 EVO's affordability is Samsung's third-generation V-NAND 3-bit flash. 3-bit flash is much cheaper per gigabyte to produce than 2-bit flash resulting in lower cost to the consumer.
To date, only two TLC-based consumer NVMe SSDs have hit the market; the Intel 600P and now Samsung's 960 EVO. Intel's 600P has become popular with mainstream consumers because it is literally half the cost of current MLC-based NVMe SSDs. Mainstream users, for the most part, are willing to sacrifice some performance for lower cost of ownership. In the case of Intel's 600P, they are willing to sacrifice a ton of performance for lower cost. This is where Samsung sees a golden opportunity for their new 960 EVO. Samsung designed the 960 EVO to deliver massive performance at a super-low price point, giving the mainstream user the best of both worlds.
The key to Samsung's performance advantage is their flash. Samsung's V-NAND 3D flash has proven to be a game changer. Samsung is way ahead of the curve when it comes to NAND flash technology. At this time, we are starting to see competing first generation 3D flash hit the market while Samsung is currently developing their fourth-generation 3D NAND flash.
Samsung's 3-bit EVO series has been massively successful; in fact, it is by far the world's bestselling line of SSDs. We have to look no further than the 850 EVO to see why. The 3-bit V-NAND-powered 850 EVO outperforms all competing TLC and MLC SATA SSDs on the market; doing so with a very low cost per gigabyte. Samsung is looking to perform a similar feat in the NVMe arena with the 960 EVO. The 960 EVO is a bit of a different animal than the 850 EVO because of the NVMe interface.
The SATA-based 850 EVO is, for the most part, just as fast or even faster than the 2-bit 850 Pro. This is because the SATA interface is so restrictive that Samsung's 3-bit V-NAND appears to deliver performance that is just as good as 2-bit V-NAND. This is not the case with the 960 EVO. It is not going to be competing with the 960 Pro in terms of performance. Over the NVMe interface, 2-bit flash clearly delivers better performance than 3-bit.
The 960 EVO and the 960 Pro share a common NVMe controller. "Polaris" is Samsung's second-generation NVMe controller. Samsung's Polaris NVMe controller is a 5-core design that replaces the 3-core UBX controller found on the 950 Pro. The additional channels along with architectural improvements make Polaris the best performing consumer NVMe controller ever released. Polaris dedicates four cores to the NAND array, and one core is dedicated to optimizing the communication between the host and controller. To maximize the 960 EVO's 3-bit MLC performance, Samsung employs two types NAND flash; 128Gb 3-bit V-NAND for the 250GB model and 256Gb 3-bit V-NAND for the 500GB and 1TB models.
In terms of read/write performance, the 960 EVO is second only to the 960 Pro. At similar capacity points, the 960 EVO outperforms the potent 950 Pro by as much as 45% when reading sequential data and by as much as 67% when writing sequential data. Additionally, 4K random performance is up by as much as 200% comparatively. To get burst performance this good with 3-bit flash, Samsung has developed caching technology called "Intelligent TurboWrite." Intelligent TurboWrite is a more refined version of the TurboWrite technology found on the 850 EVO. Intelligent TurboWrite dedicates a portion of the drive's flash array as an SLC buffer layer. Intelligent TurboWrite identifies user workloads intelligently and defines the appropriate SLC buffer. Samsung's Intelligent TurboWrite has a default and dynamic size that breaks down as follows.

TurboWrite makes it possible for the 960 EVO to reach sequential read/write speeds of up to 3200/1900 MB/s and random read/write performance of up to 380,000/360,000 IOPS.
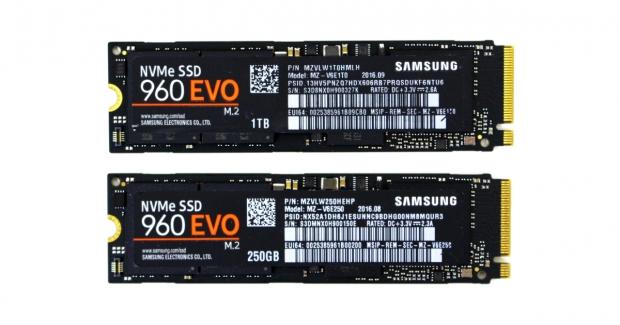
Like the 950/960 Pro, the 960 EVO is a single-sided M.2 22mm x 80mm design. A 2280 single-sided design is most desirable because it will fit into just about any laptop on the market with an M.2 PCIe slot. Additionally, a single-sided design is easier to cool. To further assist heat dissipation under load, Samsung has developed an innovative heat-dissipating label that extends peak data transferability by over 60% in comparison to the 950 Pro. Samsung's unique four-layer heat dissipating label has a thin copper layer that helps to shed heat faster than would be possible without the label.
To compliment the 960 Series SSDs, Samsung is introducing a new 2.0 version of their proprietary NVMe driver. Samsung's new NVMe driver 2.0 is designed to ensure full compatibility and maximum performance for 960 users. We will be utilizing Samsung's new NVMe 2.0 driver for most of our testing. Samsung has also revamped their Magician software. The new version of Magician offers a more personalized, intuitive interface along with host of new features. Unfortunately, we do not have the new version in-hand, so we will have to show you the new interface and features when we can do so.
Specifications
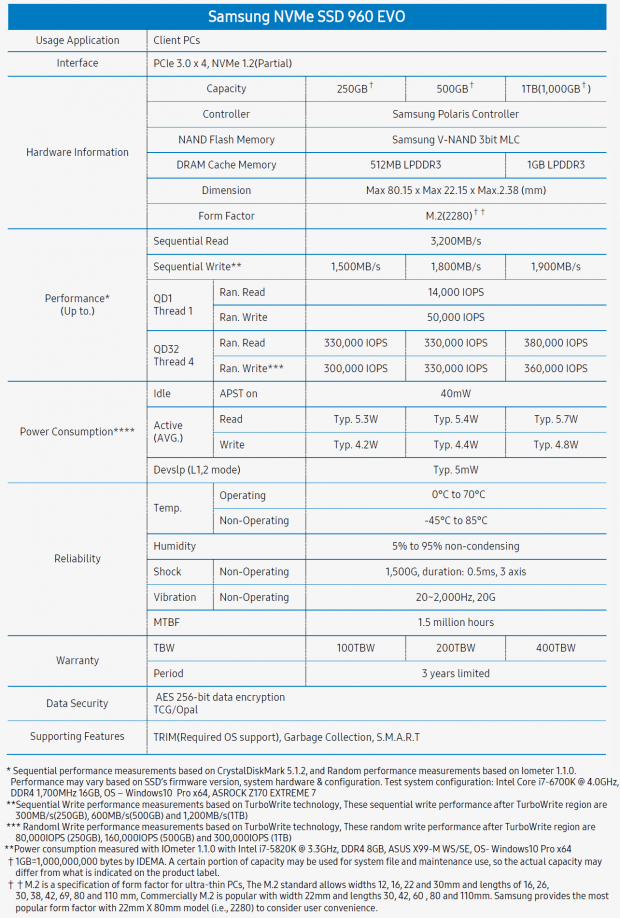
Samsung's 960 EVO M.2 x 2280 NVMe SSD is available in three capacities: 250GB, 500GB, and 1TB.
- Sequential Read: up to 3,200 MB/s
- Sequential Write: up to 1,900 MB/s
- Max 4K Random Read Speed: up to 380,000 IOPS
- Max 4K Random Write Speed: up to 360,000 IOPS
- Max 4K QD1 Random Read Speed: up to 14,000 IOPS
- Max 4K QD1 Random Write Speed: up to 50,000 IOPS
- Endurance: up to 400 TBW
- MTTF: 1.5 Million Hours
- Warranty: 3-Year Limited Warranty
- Active Power Consumption: 4.4-5.7W Avg.
- DevSlp: 5mW
- Data Security: AES 256-bit for User Data Encryption, TGC/Opal
- SMART
- TRIM
- Garbage Collection
- Software: Magician, Migration, Samsung NVMe 2.0 Driver
MSRP: 250GB = $129, 500GB = $249, 1TB = $479
Drive Details
Samsung 960 EVO M.2 NVMe PCIe SSD
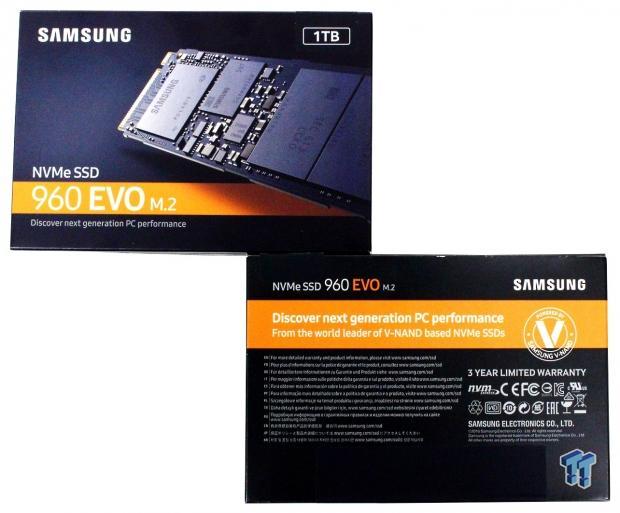
The front of the packaging is black and orange themed. There is a picture of the drive without the manufacturer label. The enclosed drive's capacity is given on the top right corner on the front of the package. The rear of the packaging carries the same black and orange theme as the front. The drive's V-NAND technology and three-year warranty are advertised here.
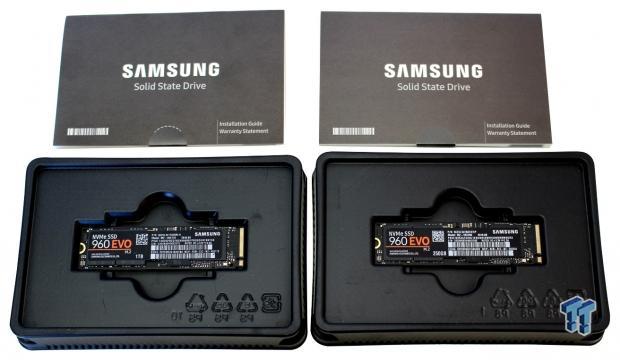
Inside of the packaging, the drive and installation guide sit in a plastic tray.
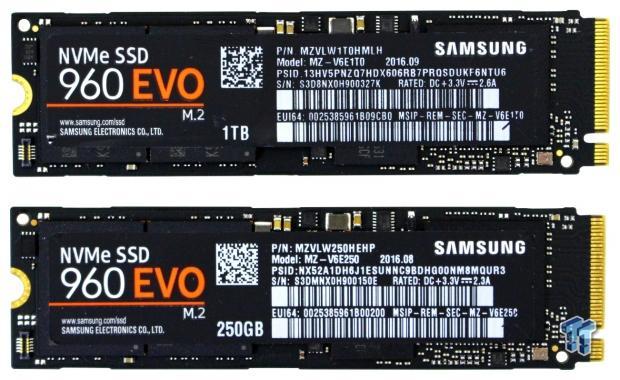
The front of the drive has a manufacturer label that covers the flash packages, DRAM package, and controller.
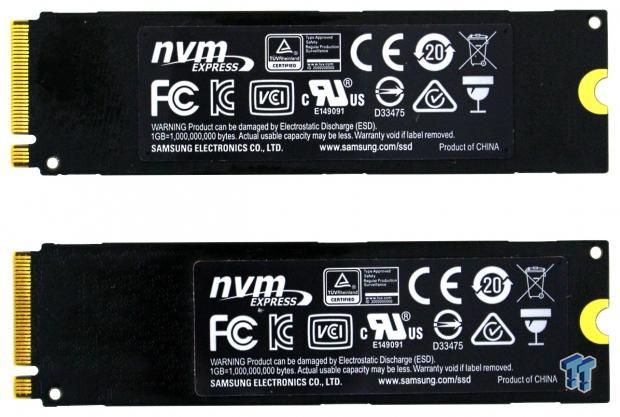
The back of the drive features the thermally conductive label we touched on earlier.

With the label removed, we see two flash packages, a DRAM package, and the drive's Polaris controller.
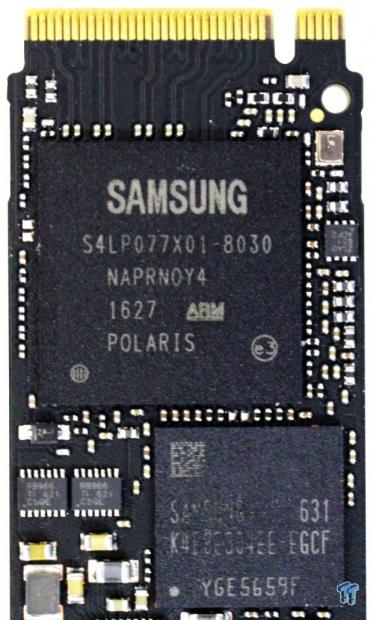
A close-in view of the drives edge connector and Polaris NVMe controller.
Test System Setup, & Drive Properties
Jon's Consumer PCIe SSD Review Test System Specifications
- Motherboard: ASRock OC Formula Z170 - Buy from Amazon / Read our review
- CPU: Intel Core i7 6700K @ 4.7GHz - Buy from Amazon / Read our review
- Cooler: Swiftech H2O-320 Edge - Buy from Amazon / Read our review
- Memory: Corsair Vengeance LPX DDR4 16GB 3200MHz - Buy from Amazon
- Video Card: Onboard Video
- Case: IN WIN X-Frame - Buy from Amazon / Read our review
- Power Supply: Seasonic Platinum 1000 Watt Modular - Buy from Amazon / Read our review
- OS: Microsoft Windows 10 Professional 64-bit - Buy from Amazon
- Drivers: Intel RAID option ROM version 14.6.0.1029 and Samsung version 2.0 NVMe driver
We would like to thank ASRock, Crucial, Intel, Corsair, RamCity, IN WIN, and Seasonic for making our test system possible.
Drive Properties
Samsung 960 EVO 250GB OS Disk 75% Full
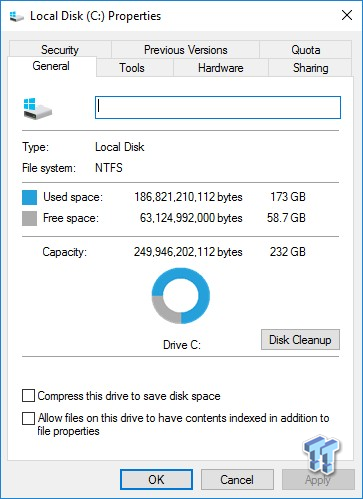
Drive Properties
Samsung 960 EVO 1TB OS Disk 75% Full
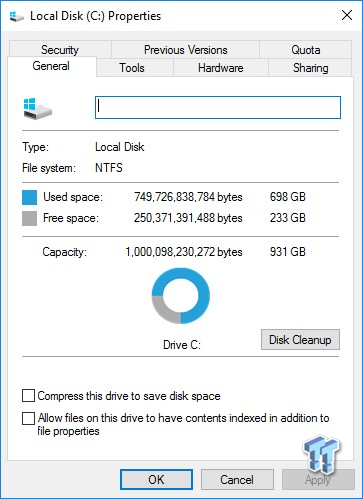
The majority of our testing is performed with our test drive as our boot volume. Our boot volume is 75% full for all OS Disk "C" drive testing to replicate a typical consumer OS volume implementation. We feel that most of you will be utilizing your SSDs for your boot volume and that presenting you with results from an OS volume is more relevant than presenting you with empty secondary volume results.
System settings: Cstates and Speed stepping are both disabled in our systems BIOS. Windows High-Performance power plan is enabled. Windows write caching is enabled, and Windows buffer flushing is disabled. We are utilizing Windows 10 Pro 64-bit OS (Build 14393) for all of our testing except for our MOP (Maxed-Out Performance) benchmarks where we switch to Windows Server 2008 R2 64-bit. Empty Windows 10 benchmark screenshots will also be shown on our MOP page.
We will be charting both capacities and providing benchmark screenshots for the 1TB model.
Synthetic Benchmarks - ATTO & Anvil Storage Utilities
ATTO
Version and / or Patch Used: 3.05
ATTO is a timeless benchmark used to provide manufacturers with data used for marketing storage products. When evaluating ATTO performance we focus on the drive's performance curve.
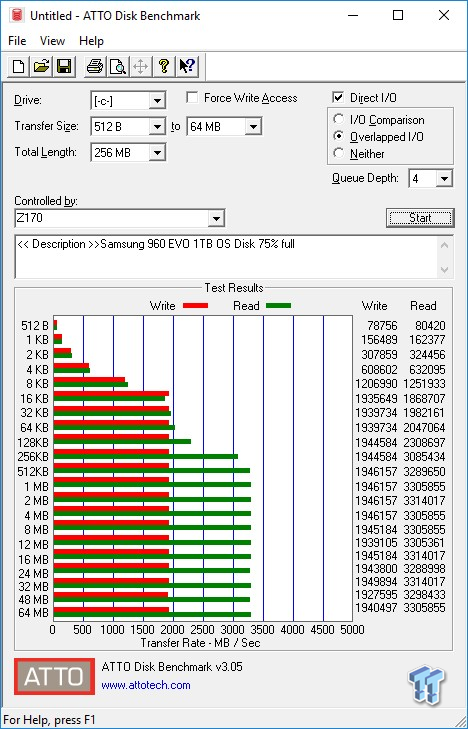
Sequential read/write transfers max out at an impressive 3,314/1,949 MB/s. Keep in mind this is our OS volume, and it is filled to 75% of its total capacity. We note the impressive performance at 4K transfers. The highest sequential read performance is achieved at 32MB transfers. The highest sequential write performance is achieved at 2MB transfers.
Sequential Write
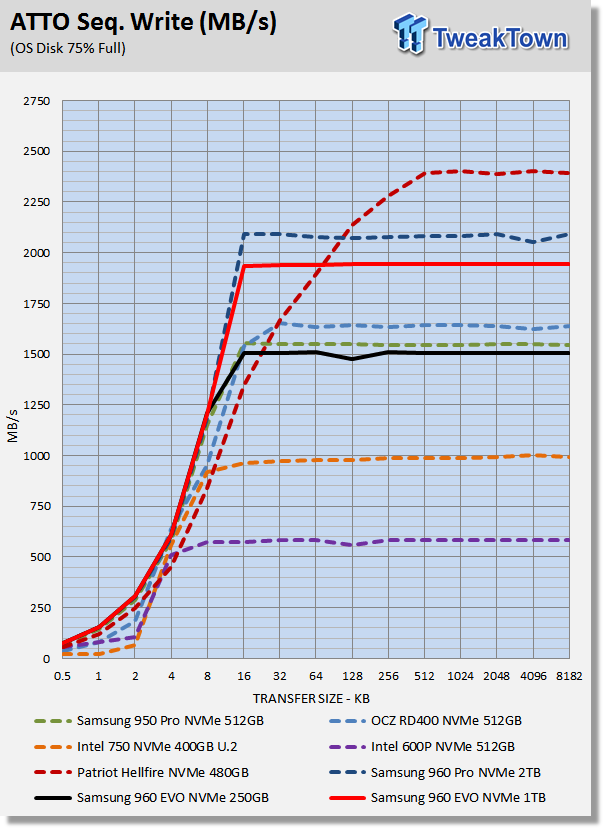
The 250GB and 1TB EVO's both display superior small-file performance. Both capacities ramp up quickly, essentially reaching full speed at 16KB transfers. In terms of peak performance, the 250GB model is nearly as fast as the 512GB 950 Pro.
Patriot's Hellfire delivers the highest peak performance but does so with an inferior performance curve. The Hellfire is only capable of this kind of sequential write performance when the data is 100% compressible, which is an unrealistic scenario. Overall, the 960 Pro is the winner of this test, followed closely by the 960 EVO 1TB.
Sequential Read

Again, the EVO's both ramp up quickly. Both EVO's peak at 512KB transfers with the 1TB model hitting 3,300 MB/s and the 250GB model at 3,200 MB/s. The 960 EVO's performance curve flattens off a bit at 16KB-64KB transfers before picking up steam again and finishing strong.
OCZ's RD400 follows a similar performance pattern to that of the 960 EVO, albeit with less performance. The EVO's at both capacity points meet or exceed Samsung's factory specifications.
Anvil Storage Utilities
Version and / or Patch Used: 1.1.0
Anvil's Storage Utilities is a storage benchmark designed to measure the storage performance of SSDs. The Standard Storage Benchmark performs a series of tests; you can run a full test or just the read or write test, or you can run a single test, i.e. 4K QD16. When evaluating performance with Anvils, we focus on total score.
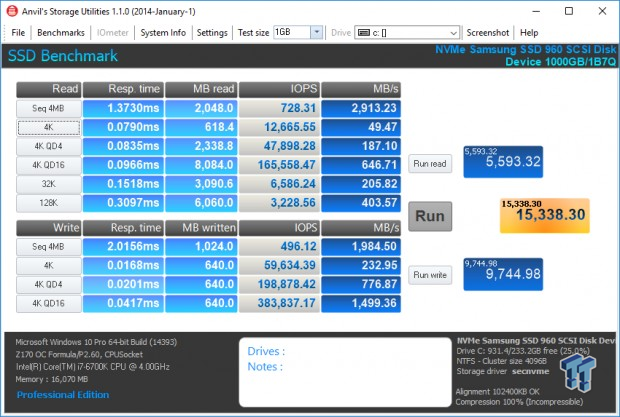
Scoring
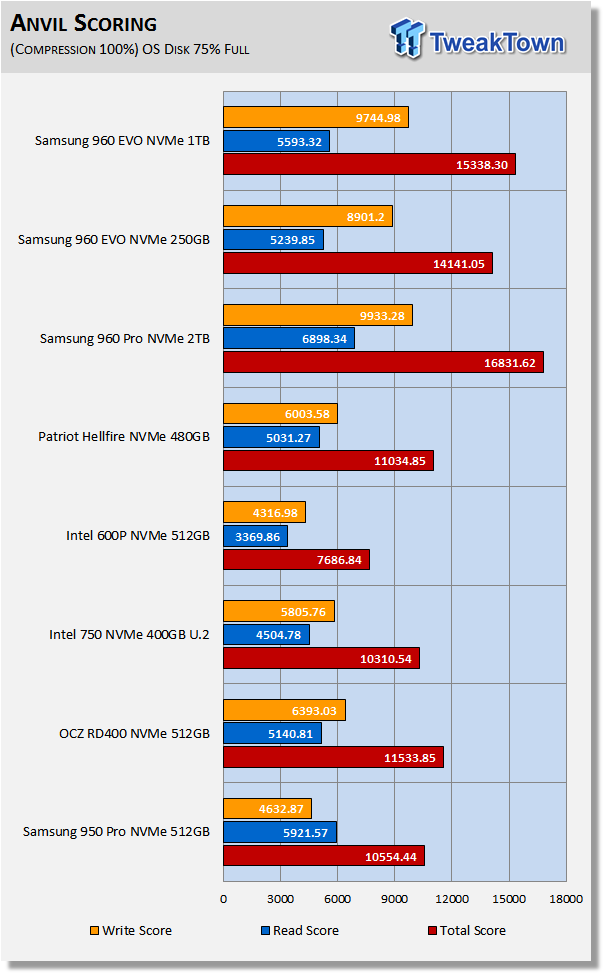
Anvil's scoring gives a good indication of a drive's overall performance. In terms of overall scoring, the 960 EVO's are only outperformed by Samsung's own 960 Pro. Both capacities easily outperform their predecessor, the 950 Pro, by a huge margin. The 1TB 960 EVO outperforms the 512GB 950 Pro by a whopping 50%. Samsung's 960 Series SSD's have no competition when it comes to Anvil's total scoring due to their massive IOPS capabilities.
(Anvil) Read IOPS through Queue Depth Scale
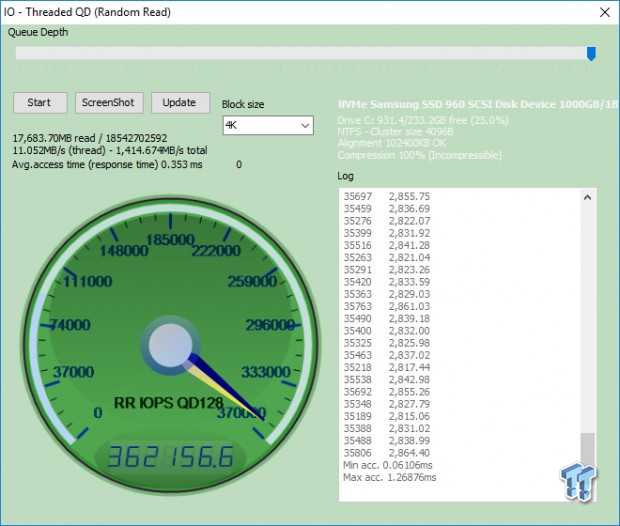
With our configuration, we attained 382K random read IOPS at QD128. This matches Samsung's factory specification of 380K random read IOPS at QD128. Amazing performance delivered from a 3-bit flash array.
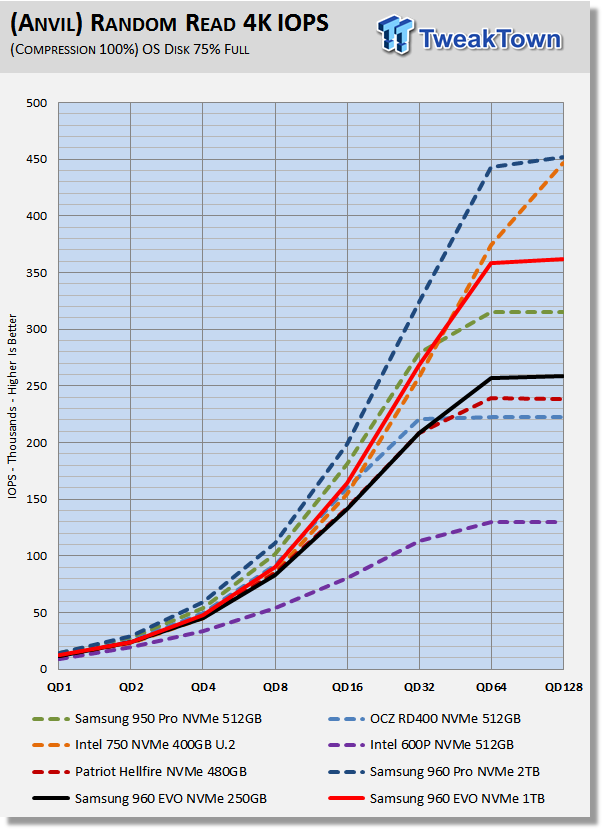
Here we get our first glimpse of 2-bit vs. 3-bit flash performance over the NVMe interface. The 960 Pro and EVO are both Polaris controlled. Essentially, the only difference between the EVO and Pro is the flash, and we can clearly see that over the NVMe interface 2-bit flash clearly outperforms 3-bit in a more pronounced manner than we typically see over SATA.
(Anvil) Write IOPS through Queue Scale
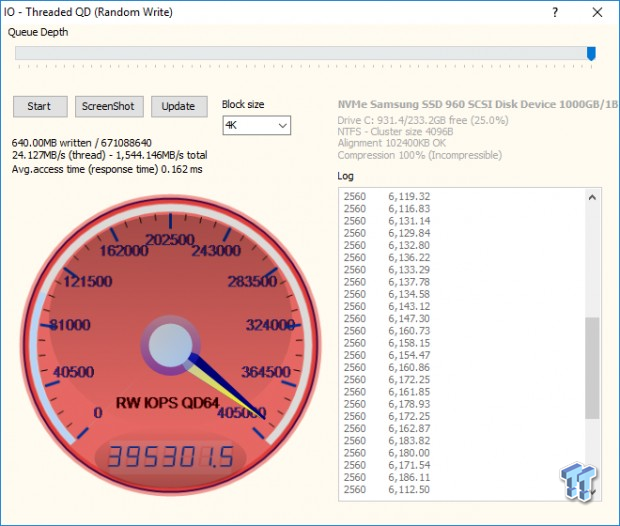
With our configuration, we exceeded the 960 EVO's factory max random write performance specification, doing so at QD64. The 1TB EVO is spec'd at 380K IOPS at QD128 - we are getting 395K at QD64.
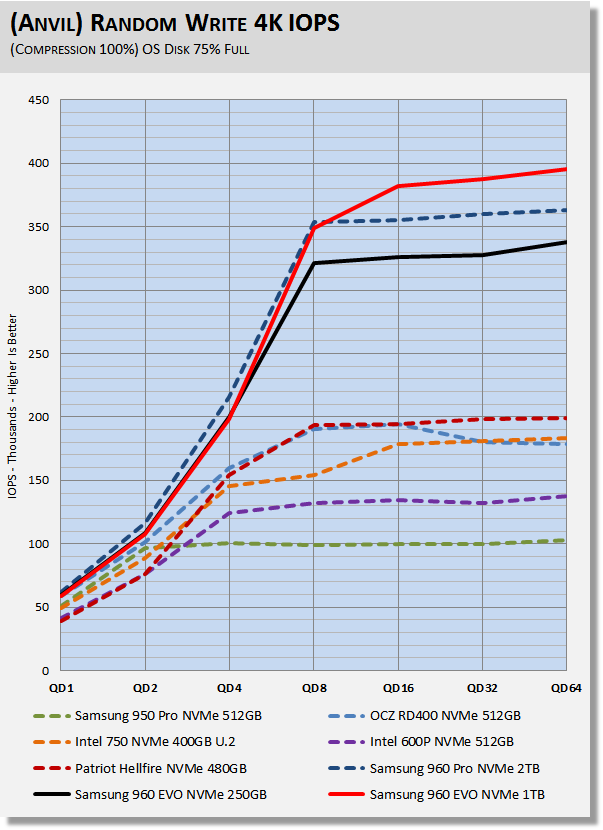
At higher queue depths, Samsung's 960 series SSDs deliver a minimum of 2x the performance of the rest of the drives in our test pool. The 1TB 960 EVO sets a new lab record for the highest random write performance in this test. The 1TB EVO even outperforms the 960 Pro in this case due to its Intelligent TurboWrite buffer.
Synthetic Benchmarks - CrystalDiskMark & AS SSD
CrystalDiskMark
Version and / or Patch Used: 3.0 Technical Preview
CrystalDiskMark is disk benchmark software that allows us to benchmark 4K and 4K queue depths with accuracy. Note: Crystal Disk Mark 3.0 Technical Preview was used for these tests since it offers the ability to measure native command queuing at QD4. When evaluating CDM results, we focus on 4K random performance at QD1 and QD4.
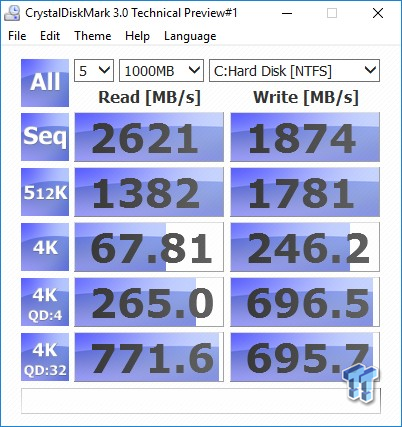
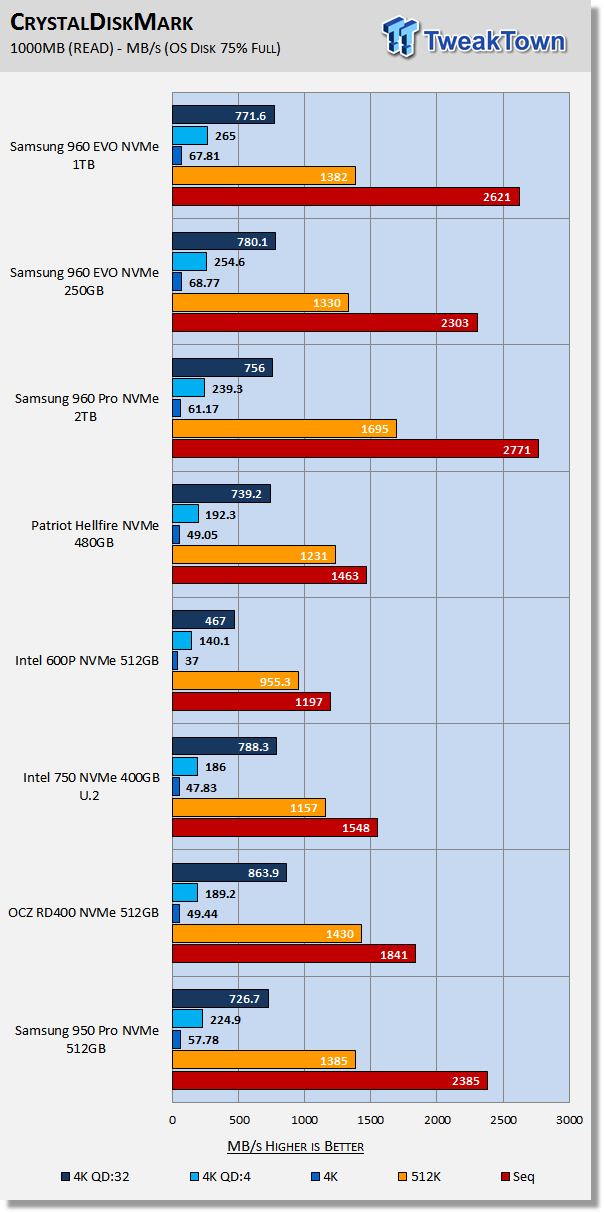
Both 960 EVO's set new lab records for 4K and 4K QD4 performance. The 250GB EVO delivers slightly better performance at QD1 and the 1TB slightly better performance at QD4. The performance of both EVO's at 4K QD1 is somewhat inflated by CDM; we are not seeing nearly as much performance from the rest of our testing. Intelligent TurboWrite must be kicking in at just the right time when running CDM.
Based on what we've seen from the 850 EVO vs. the 850 Pro, with the 850 EVO always delivering better 4K QD1 performance, this is what we expected to see from the 960 EVO. However, unlike we saw from the 850 EVO, this is only occurs with CDM.
With this version of CDM, sequential performance is measured at QD1 which is the reason sequential rates are lower than Samsung's quoted numbers which are measured at QD32. We can look to our MOP testing results to see that we have no issues meeting and exceeding exceeding Samsung's quoted CDM sequential speeds.
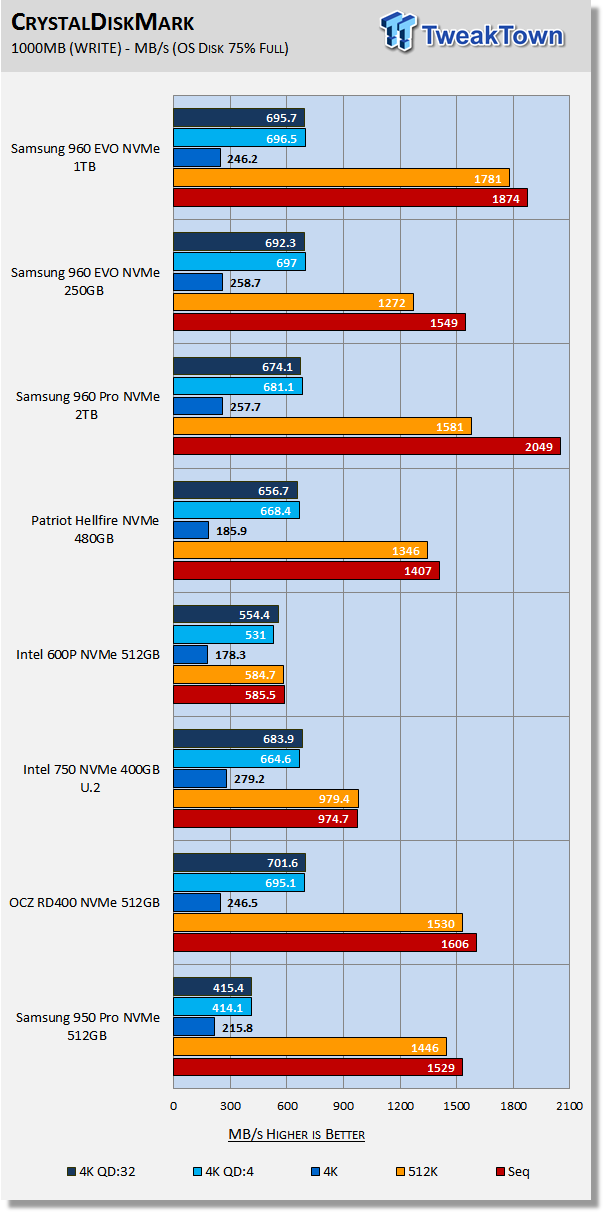
The 250GB 960 EVO delivers better 4K QD1 performance than the 1TB model. We attribute this to the fact that the 250GB model has a 2MB to 1GB DRAM to flash ratio and the 1TB model a 1MB to 1GB DRAM to flash ratio. Overall, the 250GB 960 EVO outperforms the 950 Pro, running about equal with OCZ's 512GB RD400. The 960 Pro outperforms the 1TB 960 Evo sequentially and at 4K QD1, but, the 960 EVO outperforms it in three of the five measured categories of this test.
AS SSD
Version and / or Patch Used: 1.7.4739.38088
AS SSD determines the performance of SSDs. The tool contains four synthetic as well as three practice tests. The synthetic tests are to determine the sequential and random read and write performance of the SSD. We evaluate AS SSD performance in terms of overall score.
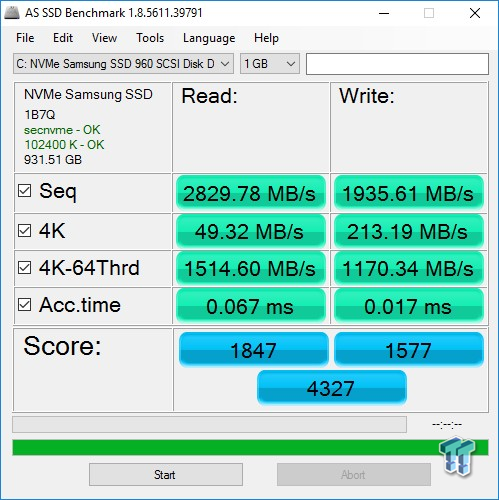
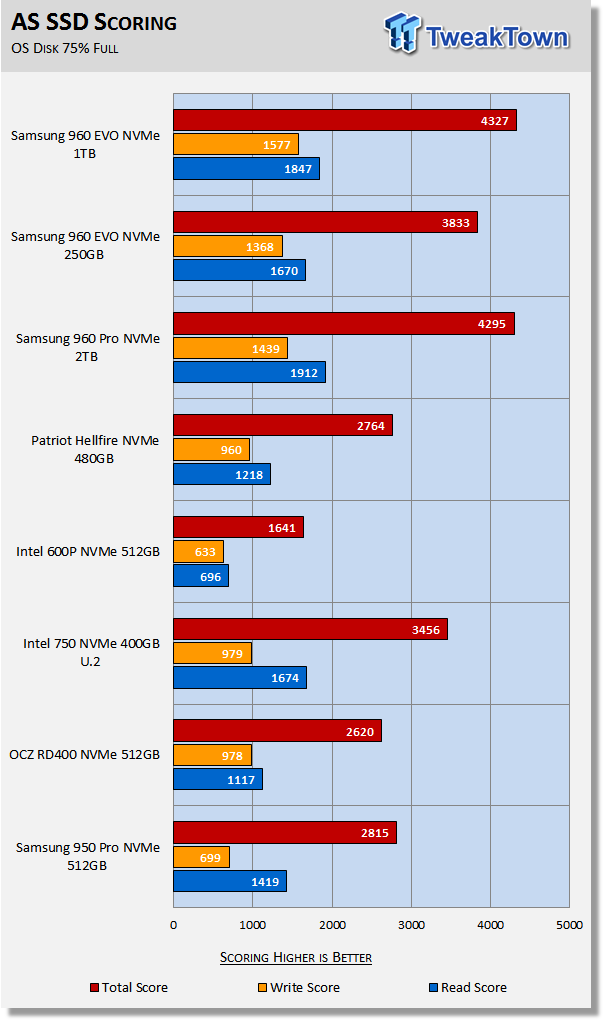
AS SSD is a demanding test, and the 1TB 960 EVO produces a new lab record courtesy of Samsung's Intelligent TurboWrite technology. Samsung's 960 series absolutely dominate this testing due to the incredible IOPS generated by Samsung's five core 8-channel Polaris controller.
Benchmarks (OS) - PCMark Vantage, PCMark 7 & PCMark 8
Moderate Workload Model
We categorize these tests as indicative of a moderate workload environment.
PCMark Vantage - Hard Disk Tests
Version and / or Patch Used: 1.2.0.0
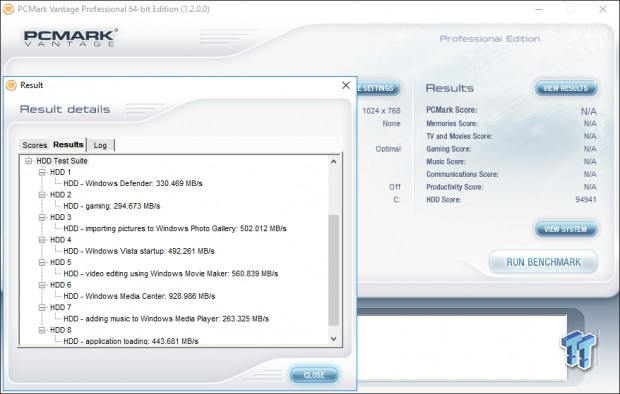
The reason we like PCMark Vantage is because the recorded traces are played back without system stops. What we see is the raw performance of the drive. This allows us to see a marked difference between scoring that other trace-based benchmarks do not exhibit. An example of a marked difference in scoring on the same drive would be empty vs. filled vs. steady state.
We run Vantage three ways. The first run is with the OS drive 75% full to simulate a lightly used OS volume filled with data to an amount we feel is common for most users. The second run is with the OS volume written into a "Steady State" utilizing SNIA's consumer guidelines. Steady state testing simulates a drive's performance similar to that of a drive that been subjected to consumer workloads for extensive amounts of time. The third run is a Vantage HDD test with the test drive attached as an empty, lightly used secondary device.
OS Volume 75% Full - Lightly Used
OS Volume 75% Full - Steady State
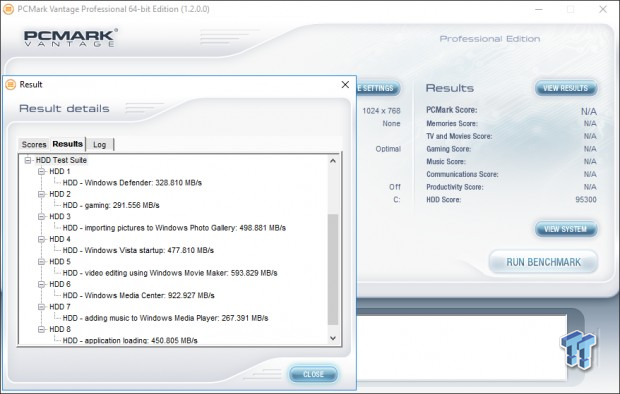
Secondary Volume Empty - FOB
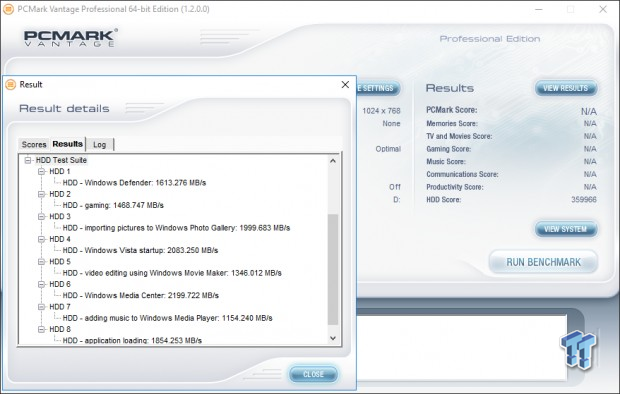
There's a big difference between an empty drive, one that's 75% full/used, and one that's in a steady state.
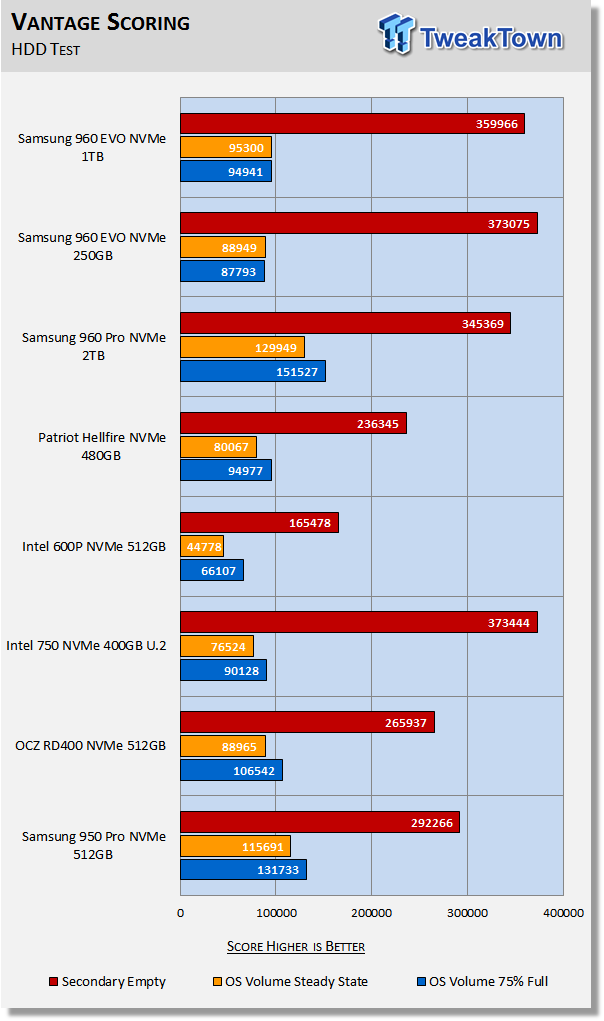
The important scores to pay attention to are "OS Volume Steady State" and "OS Volume 75% full." These two categories are most important because they are indicative of typical of consumer user states. When a drive is in a steady state, it means garbage collection is running at the same time it's reading/writing. This is exactly why we focus on steady state performance.
In a steady-state, or a lightly used state, the 960 EVO takes a back seat to the 950 Pro. This indicates that even with a more powerful controller, 3-bit flash will not deliver as good of workload performance as the 2-bit based 950 Pro. Additionally, it is a perfect illustration of why we believe it is important to test with data on the drive. Without data on the drive, Intel's 750 would have been the winner.
PCMark 7 - System Storage
Version and / or Patch Used: 1.4.0
We will look to Raw System Storage scoring for evaluation because it's done without system stops and, therefore, allows us to see significant scoring differences between drives.
OS Volume 75% Full - Lightly Used
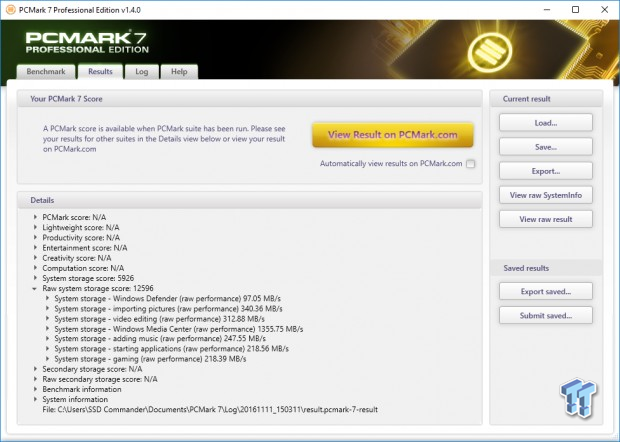
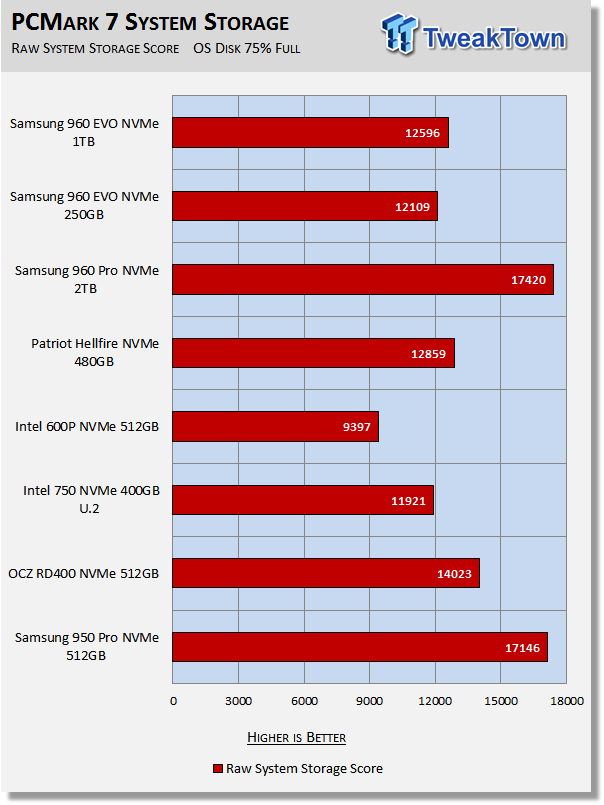
This backs up what we witnessed with Vantage. When it comes to moderate workloads over the NVMe interface, 2-bit flash has a performance advantage. This is not exposed when running SATA-based SSDs due to interface bottlenecking. Besides the 960 EVO, the only other drive in our test pool with a 3-bit flash array is Intel's 600P. It is easy to see that Samsung currently produces superior 3-bit flash and undoubtedly a superior NVMe controller.
PCMark 8 - Storage Bandwidth
Version and / or Patch Used: 2.4.304
We use PCMark 8 Storage benchmark to test the performance of SSDs, HDDs, and hybrid drives with traces recorded from Adobe Creative Suite, Microsoft Office, and a selection of popular games. You can test the system drive or any other recognized storage device, including local external drives. Unlike synthetic storage tests, the PCMark 8 Storage benchmark highlights real-world performance differences between storage devices.
OS Volume 75% Full - Lightly Used
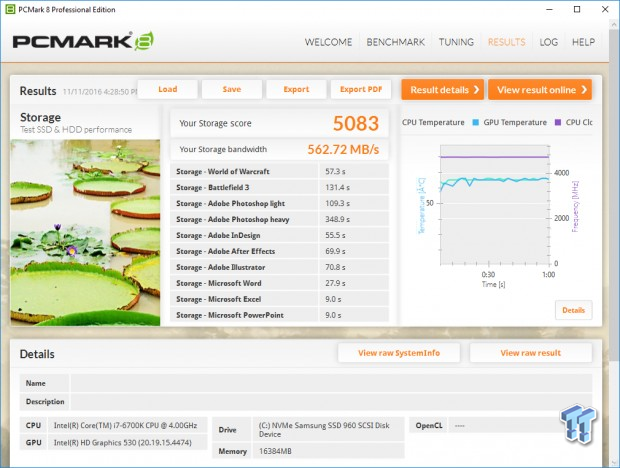
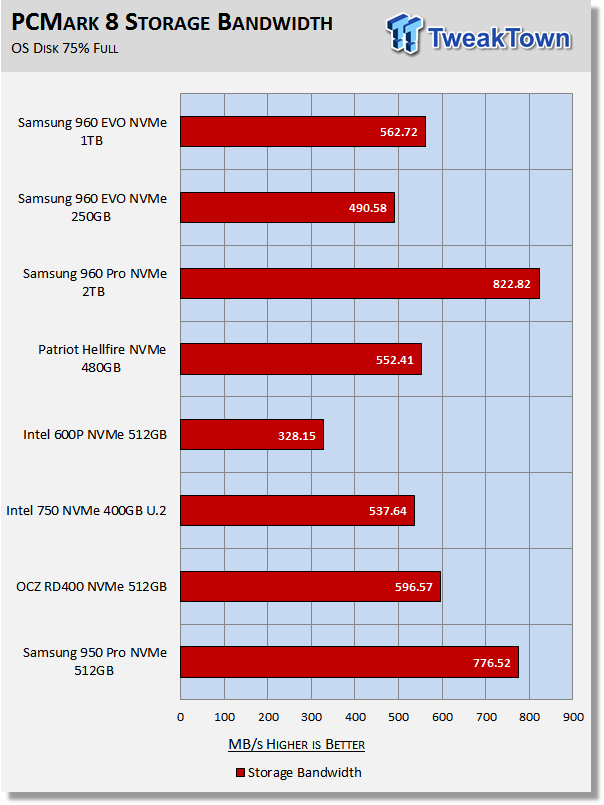
PCMark 8 is the most intensive moderate workload simulation we run. With respect to moderate consumer type workloads, this test is what we consider the best indicator of a drive's performance.
We are a bit surprised to see the 960 EVO getting crushed by the 950 Pro. Even Intelligent TurboWrite is not enough to overcome the 950 Pro's 2-bit flash array. Looking at the 960 Pro gives us a clear perspective of how much better 2-bit flash performs over the NVMe interface in comparison to 3-bit flash; because, for the most part, the EVO and Pro are the same drive, just different flash.
The 960 EVO is very powerful, and when the price is rounded into the equation, it does stand out as the best value going. However, in terms of moderate workload performance, it is not second to the 960 Pro.
Benchmarks (Secondary) - IOPS, Response & Transfer Rate
Iometer - Maximum IOPS
Version and / or Patch Used: Iometer 2014
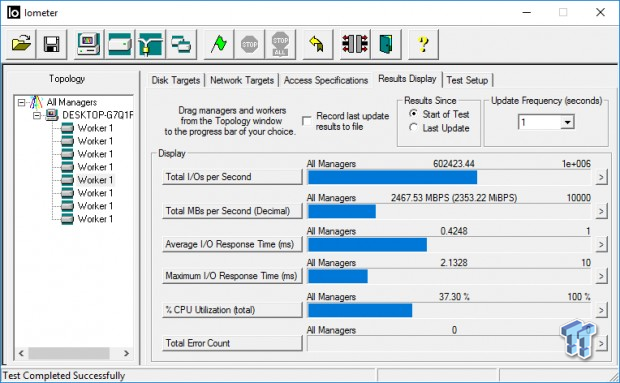
We use Iometer to measure high queue depth performance. (No Partition)
Max IOPS Read
Max IOPS Write
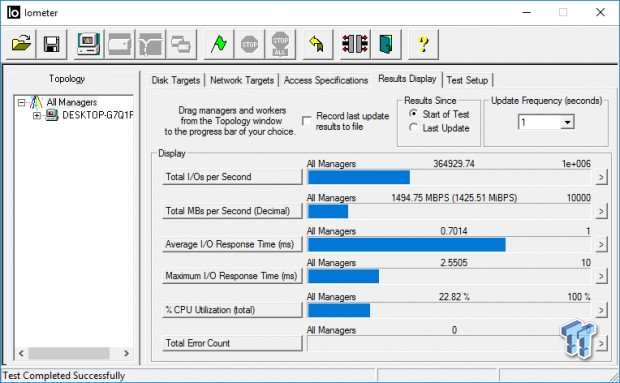
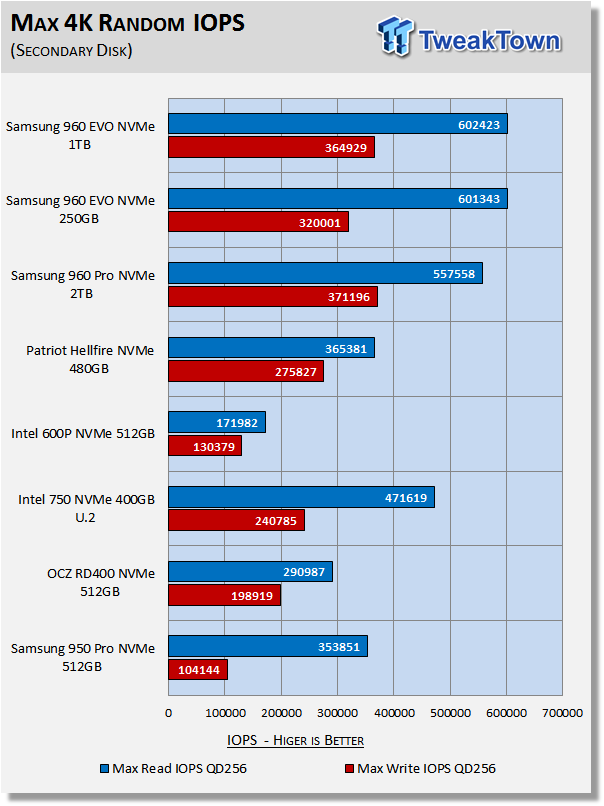
Samsung arrives at their maximum random IOPS figures by testing with four threads at QD32 or QD128. We test with eight threads at QD32 or QD256. We do this because we want to see what the drive can generate at the maximum viable queue depth. The 960 EVO's are both capable of pushing out over 600K read IOPS at QD256. This is even better than our previous consumer champion, the 960 Pro 2TB.
Iometer - Disk Response
Version and / or Patch Used: Iometer 2014
We use Iometer to measure disk response times. Disk response times are measured at an industry accepted standard of 4K QD1 for both write and read. Each test runs twice for 30 seconds consecutively, with a 5-second ramp-up before each test. We partition the drive/array as a secondary device for this testing.
Avg. Write Response
Avg. Read Response
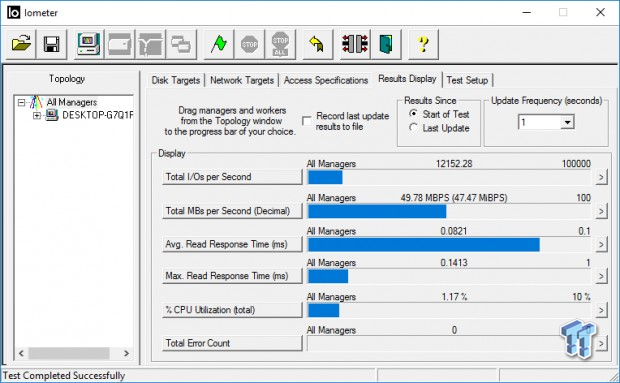
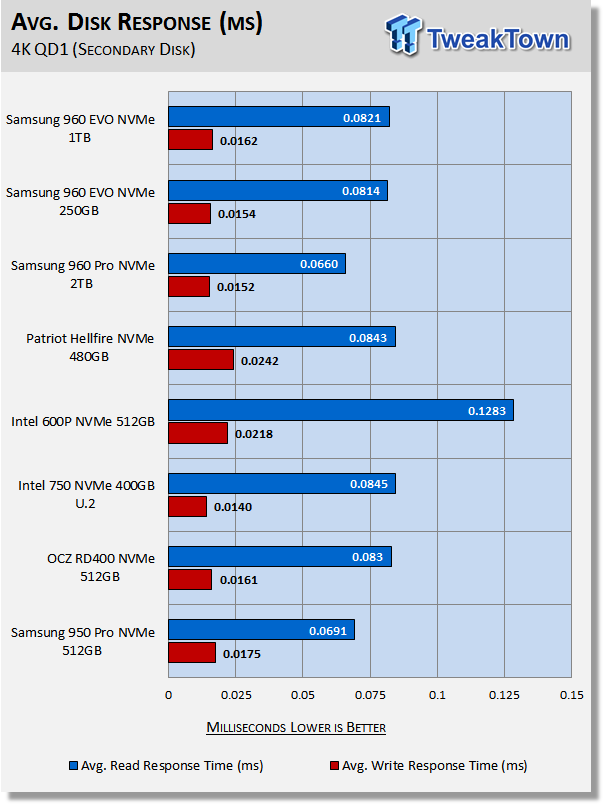
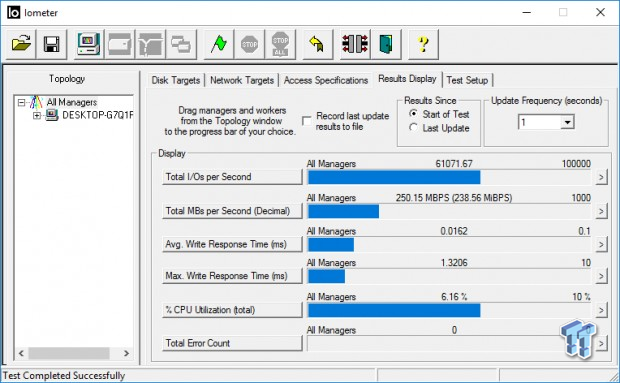
The 960 EVO's don't win out for either read or write response. They do deliver better (lower) write response than the 950 Pro, but the 950 Pro delivers superior read response. When we compare the write response of the 250GB 960 EVO to the 1TB model, we again see that the DRAM ratio on the 250GB model gives it the advantage. Intel's 750 delivers the best write response, the 960 Pro the best read response.
DiskBench - Transfer Rate
Version and / or Patch Used: 2.6.2.0
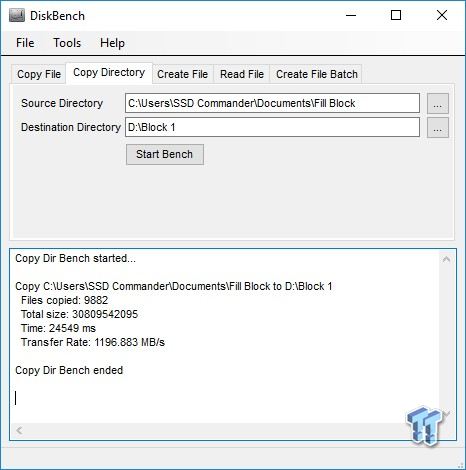
We use DiskBench to time a 28.6GB block (9,882 files in 1,247 folders) composed primarily of incompressible sequential and random data as it's transferred from our Toshiba RD400 1TB NVME SSD to our test drive. We then read from a 6GB zip file that's part of our 28.6GB data block to determine the test drive's read transfer rate. Our system is restarted prior to the read test to clear any cached data, ensuring an accurate test result.
Write Transfer Rate
Read Transfer Rate
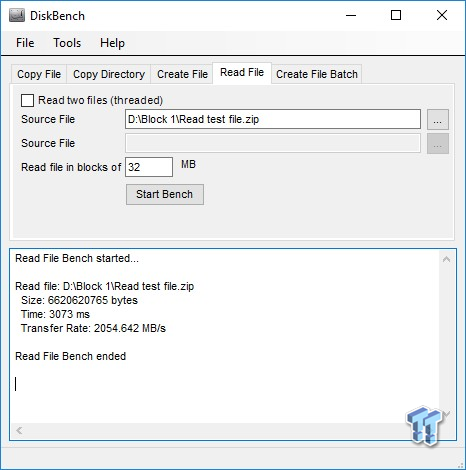
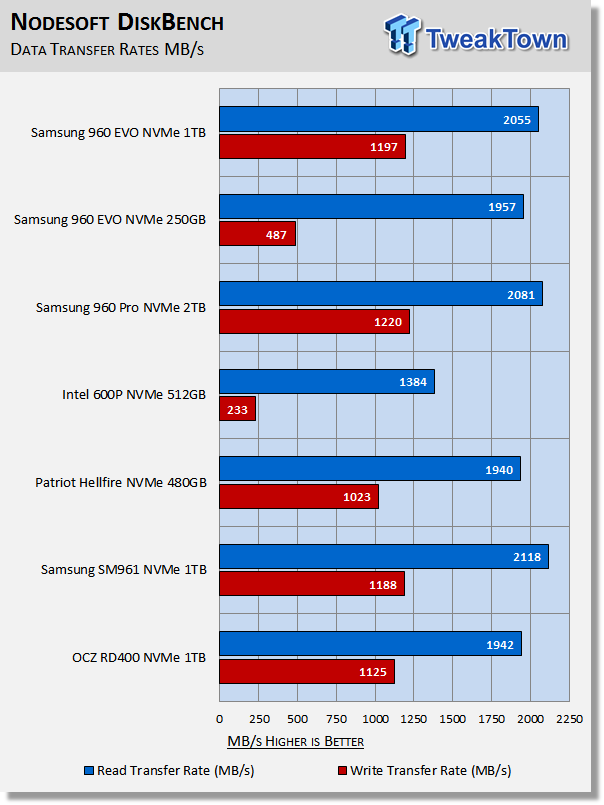
We recently upgraded our test system to Windows 10 build 14393. With that upgrade, write transfer rates almost doubled. The reason for this, as far as we know, is that CPU power switching modes have been relaxed on the latest version of Windows 10. We included the NVMe drives we've tested to date on this build of Windows 10. If you needed a good reason to upgrade to Windows 10 build 14393, this is a good reason.
The data block we transfer exceeds the 250GB 960 EVO's TurboWrite layer, resulting in a significantly lower write transfer rate than we get from the 1TB model.
Benchmarks (Secondary Volume) - PCMark 8 Extended
Futuremark PCMark 8 Extended
Heavy Workload Model
PCMark 8's consistency test simulates an extended duration heavy workload environment. PCMark 8 has built-in, command line executed storage testing. The PCMark 8 Consistency test measures the performance consistency and the degradation tendency of a storage system.
The Storage test workloads are repeated. Between each repetition, the storage system is bombarded with a usage that causes degraded drive performance. In the first part of the test, the cycle continues until a steady degraded level of performance has been reached. (Steady State)
In the second part, the recovery of the system is tested by allowing the system to idle and measuring the performance after 5-minute long intervals. (Internal drive maintenance: Garbage Collection (GC)) The test reports the performance level at the start, the degraded steady-state, and the recovered state, as well as the number of iterations required to reach the degraded state and the recovered state.
We feel Futuremark's Consistency Test is the best test ever devised to show the true performance of solid state storage in an extended duration heavy workload environment. This test takes on average 13 to 17 hours to complete and writes somewhere between 450GB and 14,000GB of test data depending on the drive. If you want to know what an SSDs steady state performance is going to look like during a heavy workload, this test will show you.
Here's a breakdown of Futuremark's Consistency Test:
Precondition phase:
1. Write to the drive sequentially through up to the reported capacity with random data.
2. Write the drive through a second time (to take care of overprovisioning).
Degradation phase:
1. Run writes of random size between 8*512 and 2048*512 bytes on random offsets for 10 minutes.
2. Run performance test (one pass only).
3. Repeat 1 and 2 for 8 times, and on each pass increase the duration of random writes by 5 minutes.
Steady state phase:
1. Run writes of random size between 8*512 and 2048*512 bytes on random offsets for 50 minutes.
2. Run performance test (one pass only).
3. Repeat 1 and 2 for 5 times.
Recovery phase:
1. Idle for 5 minutes.
2. Run performance test (one pass only).
3. Repeat 1 and 2 for 5 times.
Storage Bandwidth
PCMark 8's Consistency test provides a ton of data output that we use to judge a drive's performance.
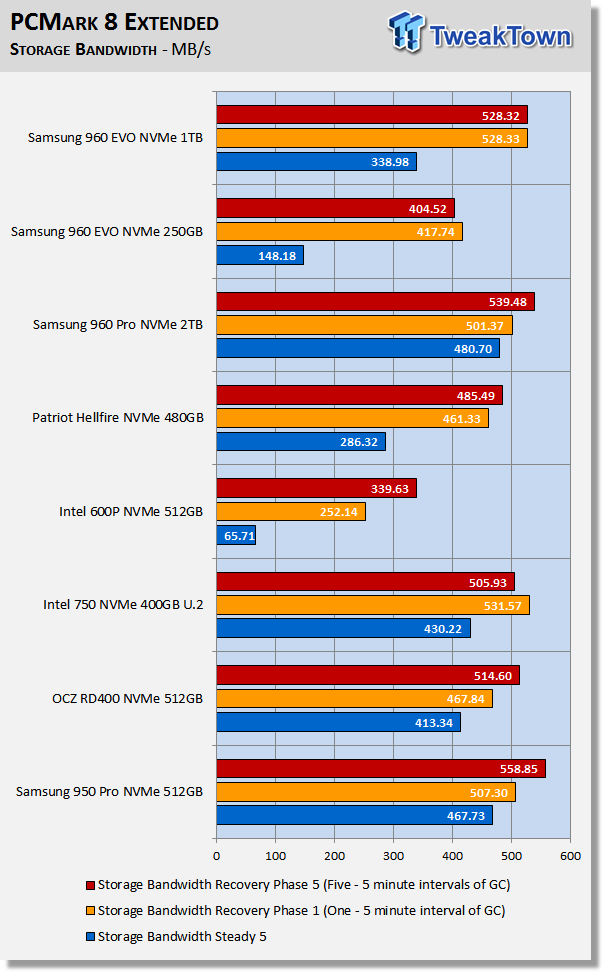
We consider steady state bandwidth (the blue bar) our test that carries the most weight in ranking a drive/arrays heavy workload performance. Performance after Garbage Collection (GC) (the orange and red bars) is what we consider the second most important consideration when ranking a drive's performance. Trace-based steady state testing is where true high performing SSDs are separated from the rest of the pack.
This is the first time we've had a chance to compare 3-bit flash to 2-bit flash over the NVMe interface. Let's focus on Steady 5. Look at the 600P, it is absolutely crushed by this brutal test. The 250GB 960 EVO doesn't fare too well either. The 1TB 960 EVO is able to outperform Patriot's Hellfire at Steady 5, but other than that, the 960EVO is outperformed by the rest of the 2-bit based SSDs in our test pool.
The 960 EVO is targeted at the mainstream user and those users, will, for the most part, never reach a steady state, so for the mainstream user, recovery performance is more indicative of what they can expect when running a heavy workload. In the recovery phases, the 960 EVO 1TB performs equivalently with the 960 Pro and 950 Pro.
Storage Bandwidth Per Phase
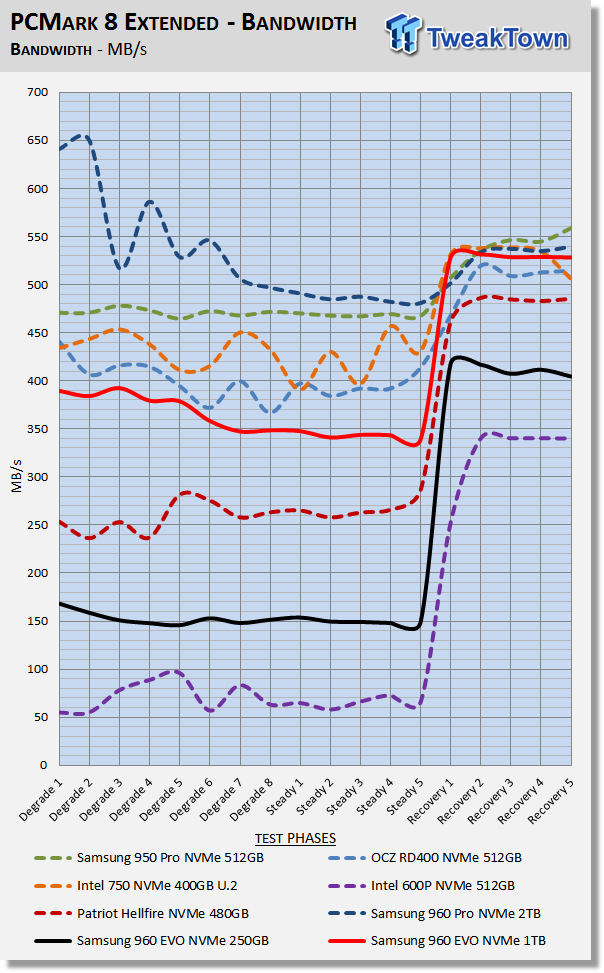
We chart our test subject's storage bandwidth as reported at each of the test's 18 trace iterations. This gives us a good visual perspective of how our test subjects perform as testing progresses. This chart sheds more light on how the drives perform as they progress through the testing phases.
Total Access Time (Latency)
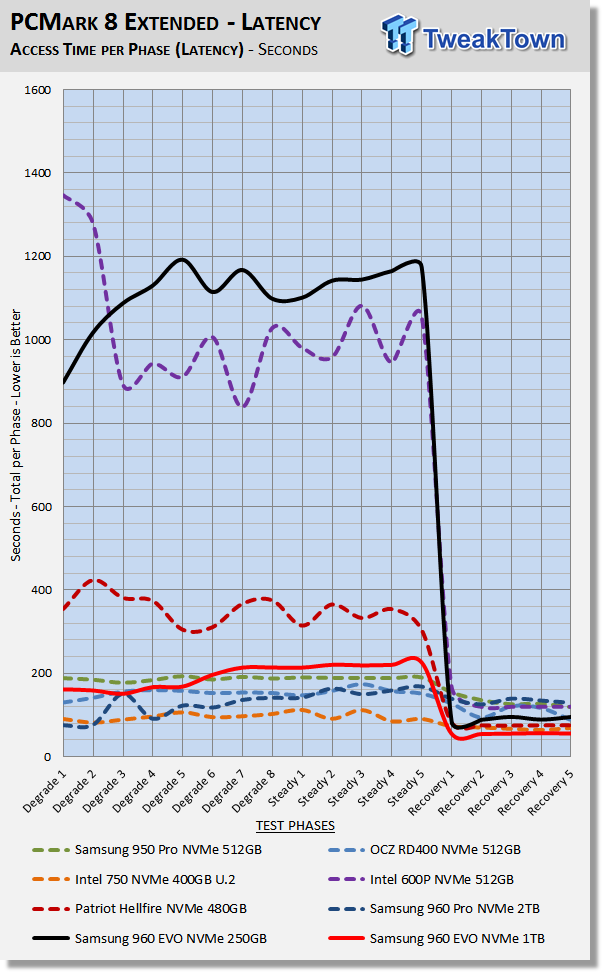
We chart the total time the disk is accessed as reported at each of the test's 18 trace iterations. This helps shed some light on how the drive performs at each of the 18 phases of this test.
Disk Busy Time
Disk Busy Time is how long the disk is busy working. We chart the total time the disk is working as reported at each of the tests 18 trace iterations.

Data Written
We measure the total amount of random data that our test drive/array is capable of writing during the degradation phases of the consistency test. Pre-conditioning data is not included in the total. The total combined time that degradation data is written to the drive/array is 470 minutes. This can be very telling. The better a drive/array can process a continuous stream of random data; the more data will be written.
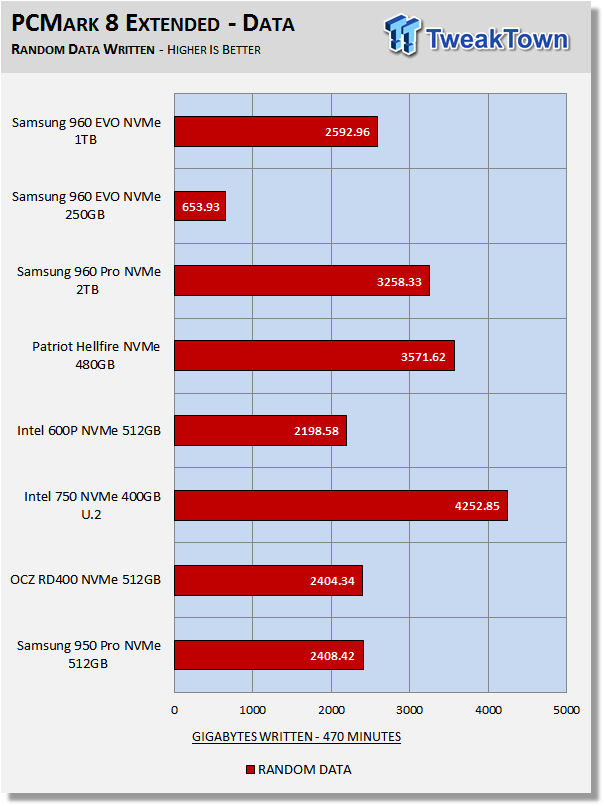
Overprovisioning and write latency are the biggest factors that determine the outcome of this portion of the test. The 1TB 960 EVO does quite well with this portion of the test. The 250GB model does not. The Intel 750 wins this test going away because it has by far the most dedicated spare area of the drives in our test pool.
Benchmarks (Secondary Volume) - 70/30 Mixed Workload
70/30 Mixed Workload Test (Sledgehammer)
Version and / or Patch Used: Iometer 2014
Heavy Workload Model
This test hammers a drive so hard we've dubbed it "Sledgehammer". Our 70/30 Mixed Workload test is designed to simulate a heavy-duty enthusiast/workstation steady-state environment. We feel that a mix of 70% read/30% write, full random 4K transfers best represents this type of user environment. Our test allows us to see the drive enter into and reach a steady state as the test progresses.
Phase one of the test preconditions the drive for 1 hour with 128K sequential writes. Phase two of the test runs a 70% read/30% write, full random 4K transfer workload on the drive for 1 hour. We log and chart (phase two) IOPS data at 5-second intervals for 1 hour (720 data points). 60 data points = 5 minutes.
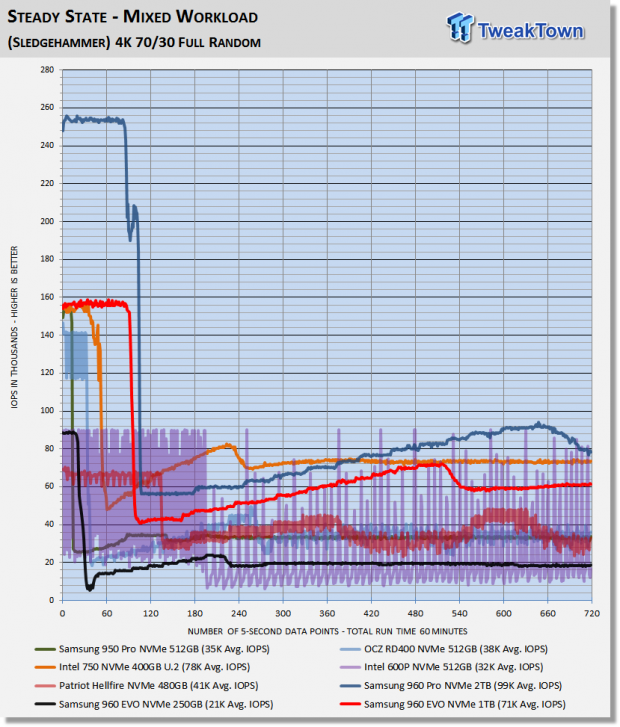
What we like about this test is that it reflects reality. Everything lines up, as it should. Consumer drives don't outperform Enterprise-Class SSDs that were designed for enterprise workloads. Consumer drives based on old technology are not outperforming modern Performance-Class SSDs, etc.
This is a brutal test, and smaller capacity drives are impacted much more than larger capacity SSDs. This is because smaller capacity SSDs are written over more times than large capacity SSDs in the same one hour time period.
This is part of the reason the 250GB 960 EVO gets hammered into the last place. The other reason why the 250GB 960 EVO is bringing up the rear is because its native write performance (write performance outside of the TurboWrite layer) is so much lower than the 1TB model. In this case, the 1TB 960 EVO easily outperforms the 950 Pro.
Maxed-Out Performance (MOP)
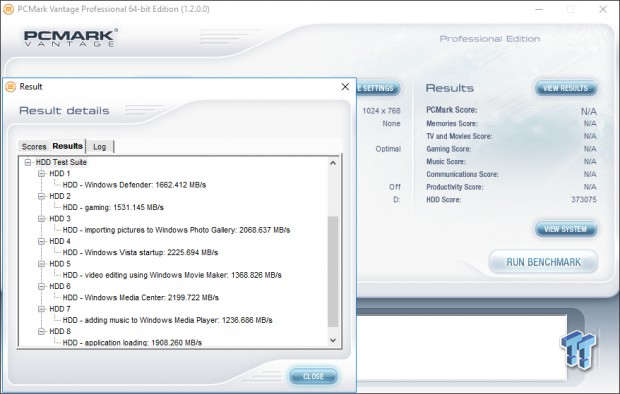
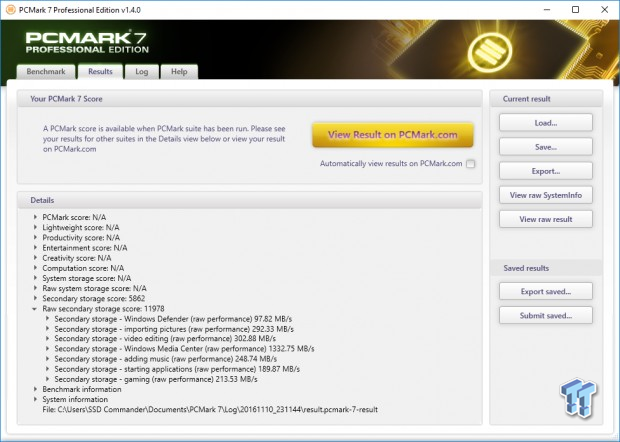
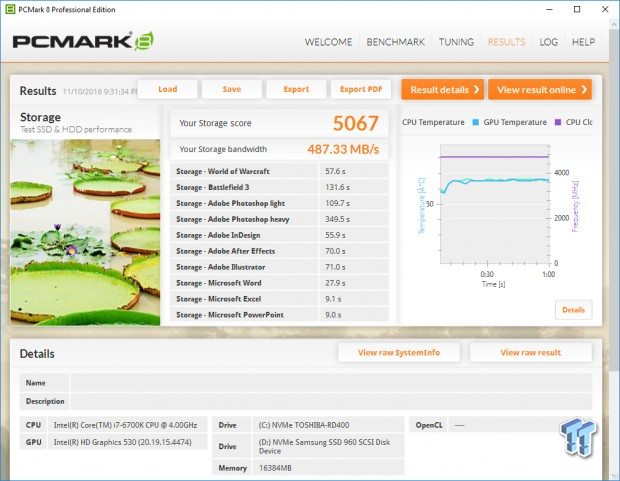
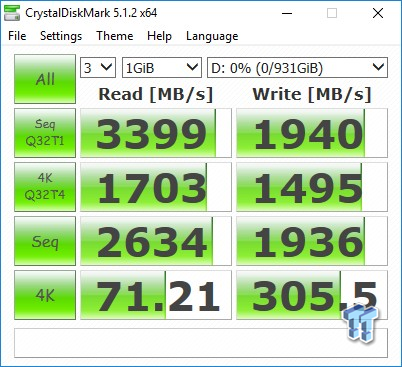
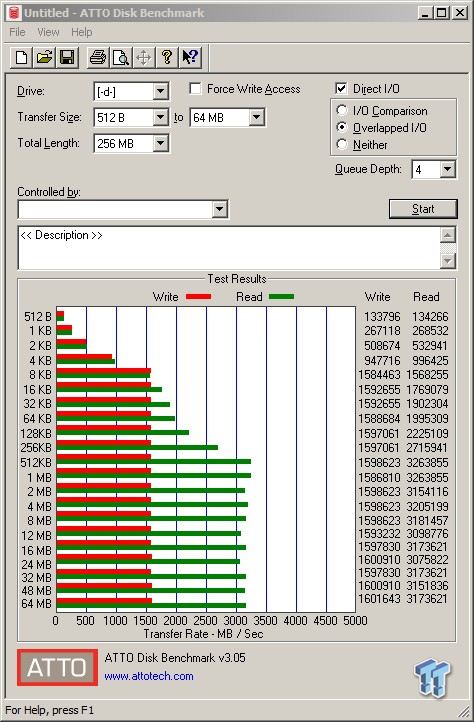
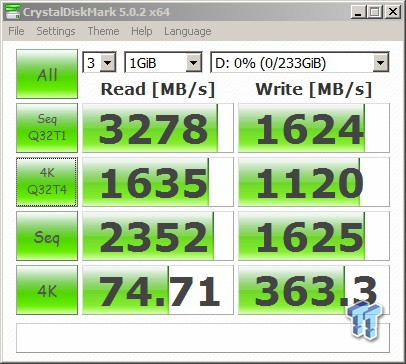
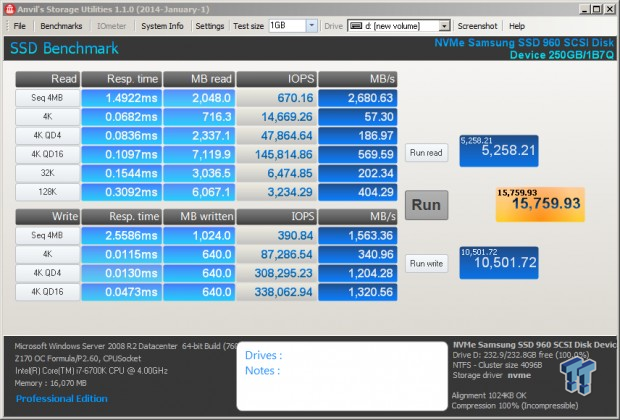
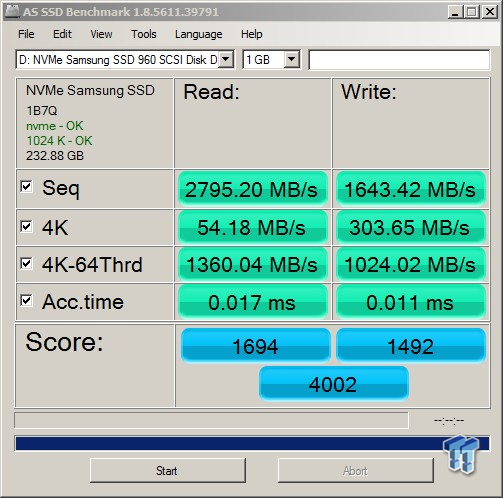
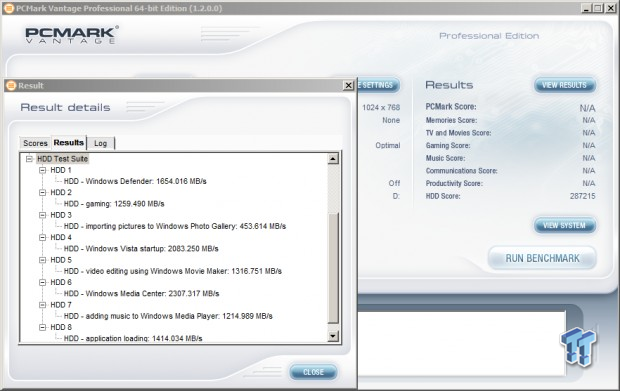
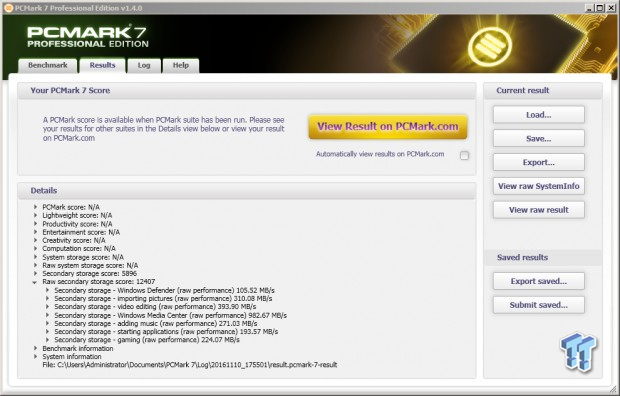
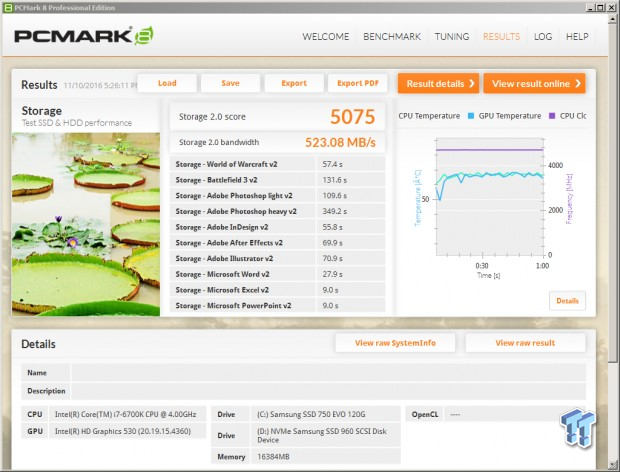
This testing is just to see what the drive is capable of in an FOB (Fresh Out of Box) state under optimal conditions. We are utilizing empty volumes of Windows 10 and Windows Server 2008 R2 64-bit for this testing.
Windows 10 MOP
Samsung 960 EVO 250GB
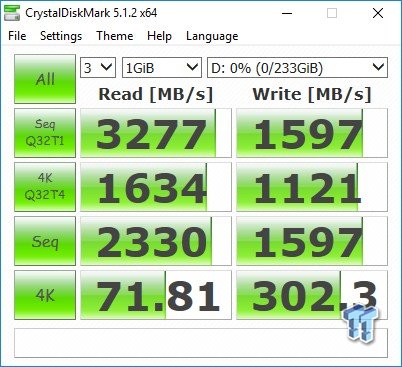
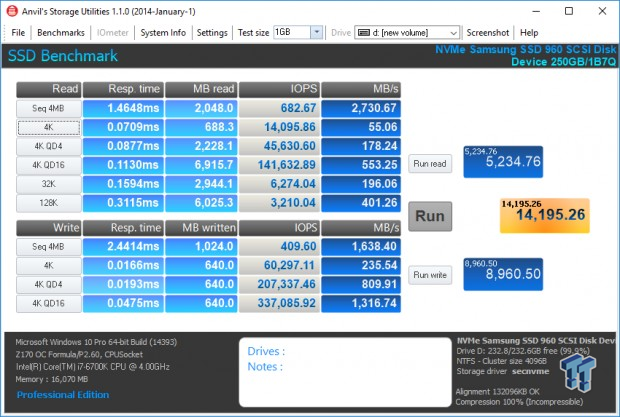
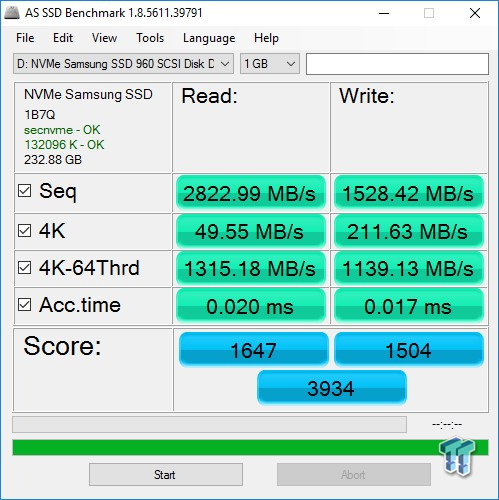
Windows 10 MOP
Samsung 960 EVO 1TB
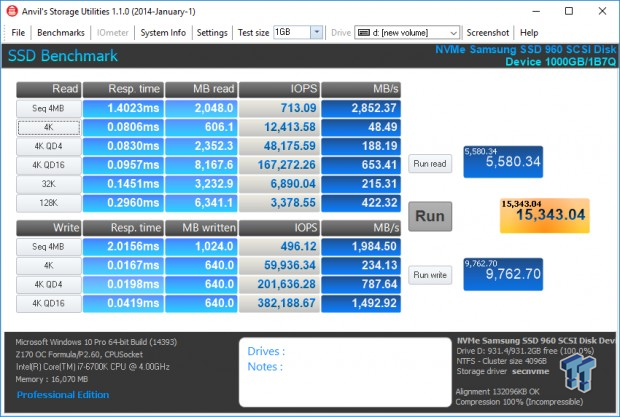
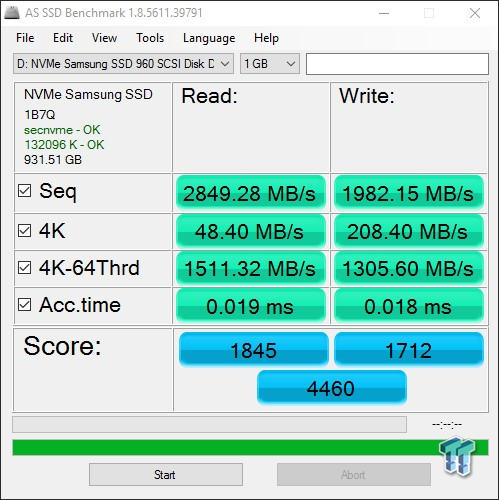
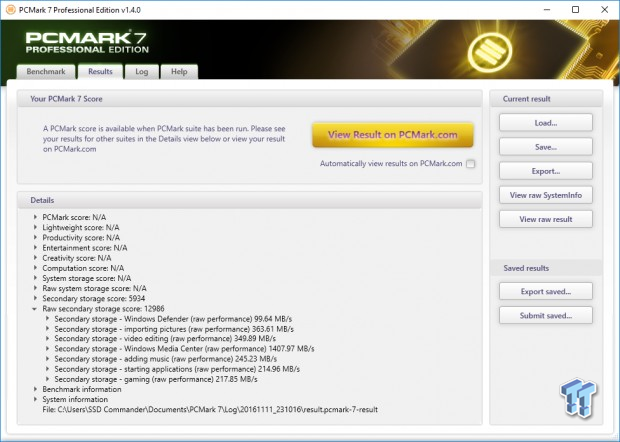
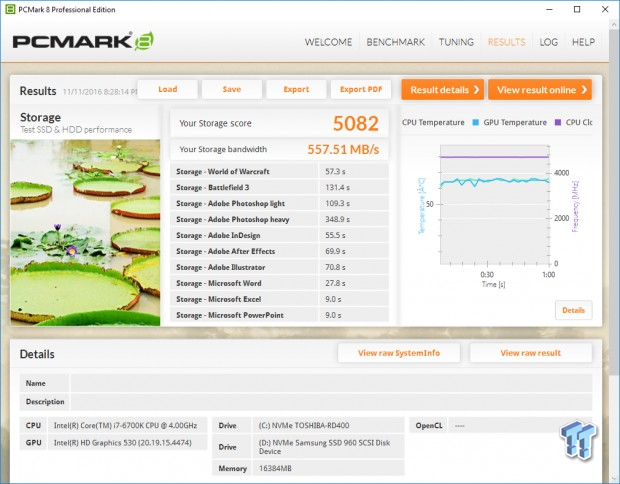
Windows Server 2008 R2 MOP
Samsung 960 EVO 250GB
Windows Server 2008 R2 MOP
Samsung 960 EVO 1TB
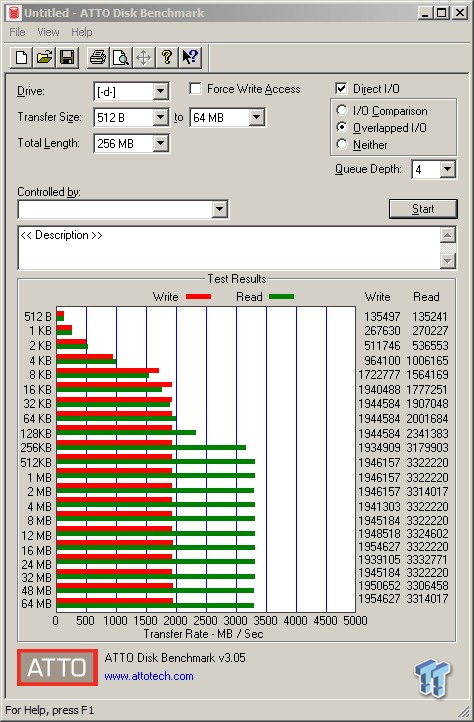
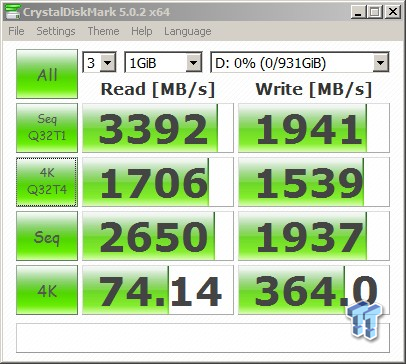
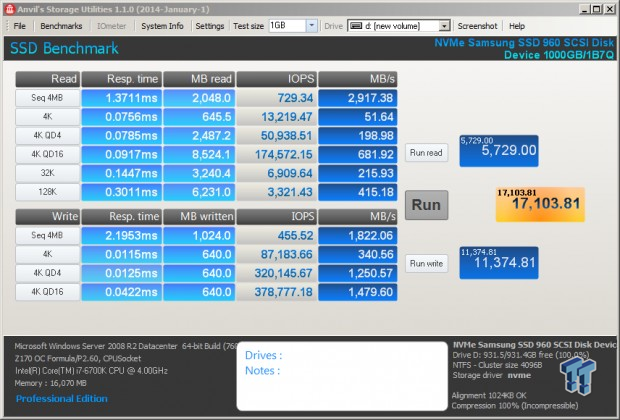
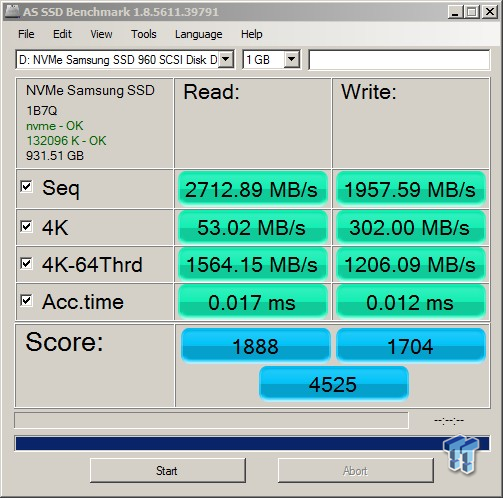
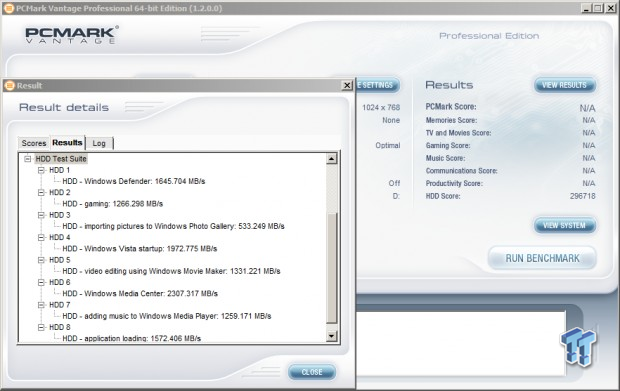
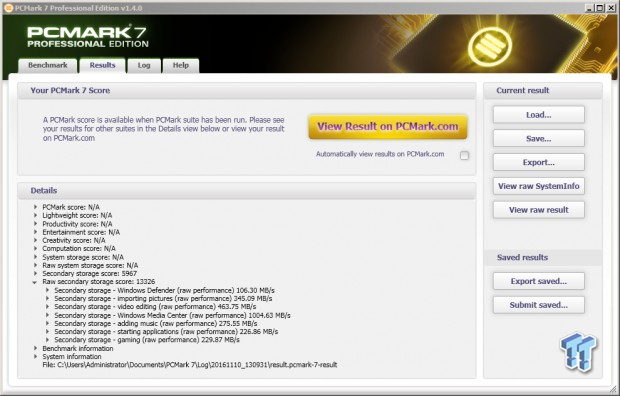
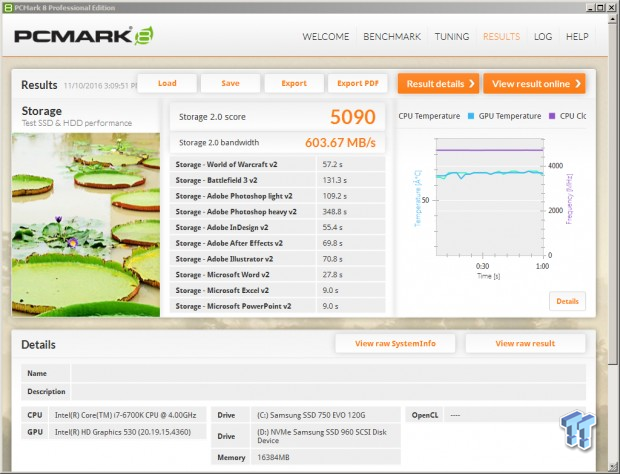
We had to use Samsung's previous NVMe driver for our MOP testing on Server. The new driver would not install on the older operating system. Our Vantage results on Server 2008 are a bit of a puzzle because they are actually much lower than we got on Windows 10 with the new Samsung driver.
This indicates that the new NVMe driver version may provide better performance than the previous version in certain corner-case scenarios.
Final Thoughts
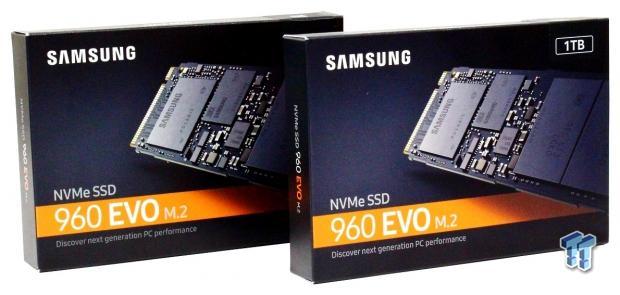
Price meets performance - it's what the 960 EVO is all about. Samsung has been able to accomplish what others have failed to do up until this point by delivering a 3-bit consumer NVMe SSD that doesn't skimp on performance. For a few dollars more than you will spend on an Intel 600P, you can get yourself a 960 EVO with double the performance. Samsung claims the 960 EVO is the second fastest client/PC SSD on the market. In terms of synthetic performance, this is, in fact, true. However, when we toss moderate workloads into the mix, the 960 EVO is outperformed by more expensive 2bit flash based NVMe SSDs. The good news is that for most mainstream users, synthetic performance is one of the best indicators of how a drive will perform for their needs.
If we take a step back from our enthusiast views and look at the whole picture, then we are of the opinion that Samsung's 960 EVO is likely the most appealing SSD ever made. Nothing to this point has delivered so much performance for so little cost. When you purchase a 960 EVO, what you get is a complete package. You get free cloning software, a proprietary NVMe driver, and drive maintenance software (Magician) that is second to none.
As we explained earlier, we do not have the newest version of Samsung's Magician software on hand at this time. By the time you can purchase your own 960 EVO, Samsung's revamped Magician software should be available for download. The new Magician will have an intuitive user interface that will visually display what drive you are running, allow you to secure-erase individual files, instantly see the condition of the drive in an easy to decipher format, check system compatibility, along with many other useful features.
We are of the opinion that user experience while running a drive as your OS disk is one of the most important factors there is when considering an upgrade. This is why we perform the majority of our testing with the test subject as our OS disk. This gives us insight that goes beyond what numbers alone reveal. Some drives deliver great numbers but fall short on user experience. Samsung's SSDs have never fallen into this category, and the 960 EVO is no exception. The 960 EVO delivers a user experience that is as good as it gets, which is why Samsung's 960 EVO is TweakTown recommended.
Pros:
- Price
- Synthetic Performance
- Build Quality
- Most Appealing Form Factor
Cons:
- Workload Performance

