


Our Verdict
Introduction, Drive Specifications, Pricing and Availability
As TLC-based SSDs come to the forefront of the consumer based value SSD segment, we have been inundated with emails from readers wanting to know what super low-cost TLC-based SATA SSD is the best bang for the buck. Our readers want to know primarily about planar-based TLC SSDs at the 480GB capacity point. Consumers are really interested in getting a half terabyte of fast storage for about a hundred bucks. To us, this seems like a fairly easy answer. Based on our testing, most notably our transfer testing, we feel that Phison S10-powered planar TLC SSDs in a 480GB capacity offer the best performance for around $100. However, a few of our readers wanted to know what we thought of Sandisk's SSD Plus and Z410 because they sell for roughly the same cost as S10-powered SSDs at similar capacity points.
It would be easy to just dismiss the SSD Plus and Z410 as inferior due to the fact that they are both DRAM-less designs and in all likelihood would not deliver Phison S10 level performance even though they sell for roughly the same price. That, and the fact that all of the SMI 2256 controlled drives we've tested to date have been underwhelming to say the least. That said, in reality we had no idea how the SSD Plus or Z410 actually perform, because Sandisk chose not to sample either to the review community. Is this because performance is that bad? Or, is it because they don't want to create competition within their own product stack?
To answer our readers' questions about the SSD Plus and Z410 we decided to purchase some of our own and find out first hand if either are viable options to the plethora of Phison S10 powered planar TLC SSDs on the market.
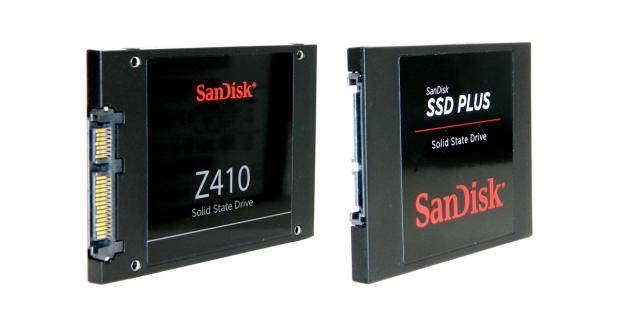
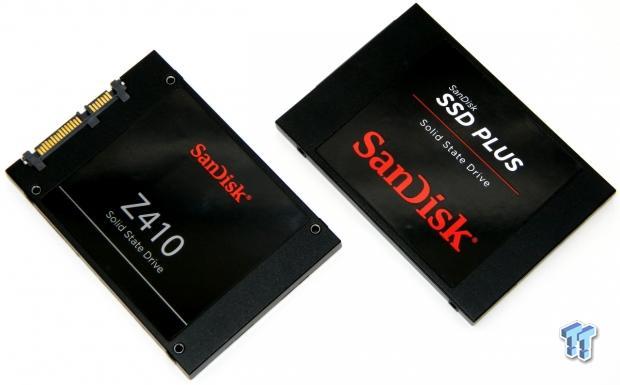
Sandisk pairs their own 15nm planar TLC (Triple-Level-Cell or 3-bit per cell) flash with SMI's 4-channel SM2256S TLC specific controller on both the SSD Plus and Z410. This version of SMI's controller allows for a DRAM-less design which lowers overall SSD production costs. We did not notice any physical difference in PCB components between the SSD Plus and Z410 480GB SSDs. Same flash, same controller, same PCB. We believe the only difference between the two drives is firmware. Both drives employ SLC caching to boost burst write performance. The SSD Plus comes with downloadable cloning software, Sandisk's SSD Dashboard and a stick-on plastic spacer. Sandisk states the SSD Plus is ideal for typical PC workloads and is sold as a "For Home" upgrade. The Z410 is targeted as a cost-efficient business solution that has been validated for several OEM platforms. The Z410 is sold as a drive only solution. Both SSDs are available as cased designs only; there is no M.2 variant. Both the SSD Plus and Z410 feature low cost all plastic enclosures, which in our opinion makes them seem of inferior quality.
All plastic enclosures certainly aren't a deal breaker; to us its more about performance so let's take a close look at Sandisk's super low cost planar TLC offerings.
Specifications
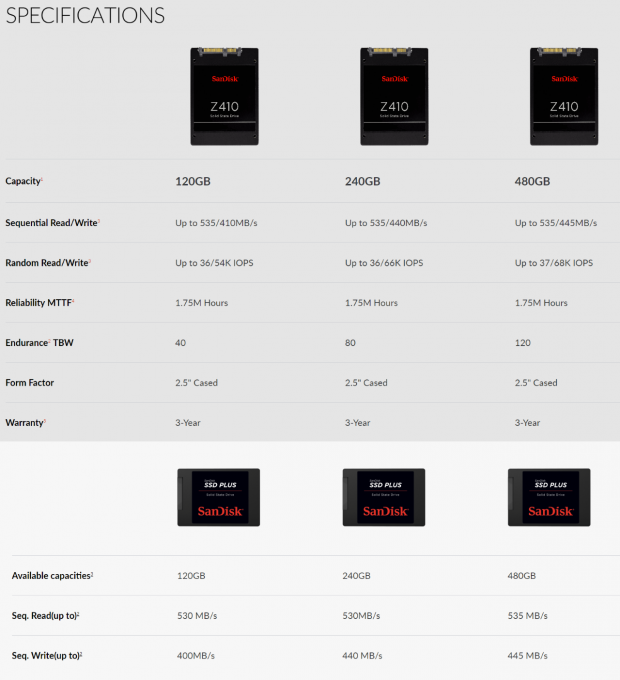
Both the SSD Plus and Z410 are available in three capacities: 120GB, 250GB, and 480GB. Sandisk only lists sequential read/write performance for the SSD Plus: 120GB up to 530/400 MB/s, 240GB up to 530/440 MB/s, 480GB up to 535/445 MB/s. Sandisk backs the SSD Plus with a limited 3-year warranty.
Sandisk provides more detailed specifications for the Z410. 120GB: Sequential read/write up to 535/410 MB/s. Max 4K random read/write up to 36/54K IOPS at QD32. TBW 40TB, MTTF 1.75 million hours. 240GB: Sequential read/write up to 535/440 MB/s. Max 4K random read/write up to 36/66K IOPS at QD32. TBW 80TB, MTTF 1.75 million hours. 480GB: Sequential read/write up to 535/445 MB/s. Max 4K random read/write up to 37/68K IOPS at QD32. TBW 120TB, MTTF 1.75 million hours. Sandisk backs the Z410 with a limited 3-year warranty.
Our Latest SSD Review Coverage
- Samsung 990 2TB SSD Review - Ninth Gen QLC at PCIe Gen4 Speeds
- Phison E37T SSD Controller Exclusive Preview - The Fastest DRAMless SSD Platform Yet
- Seagate FireCuda X1070 4TB SSD Review - A New Mainstream Contender
- Micron 3610 2TB SSD Review - DRAMless QLC at 11,000 MB/s
- SK hynix Platinum P51 2TB SSD Review - A Powerful Gen5 Alternative
Drive Details
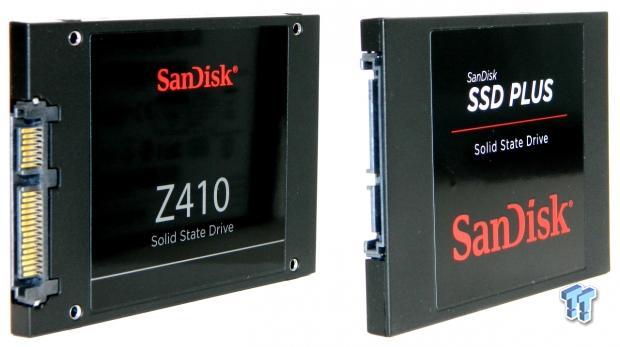
Sandisk SSD Plus & Z410 SATA III SSD
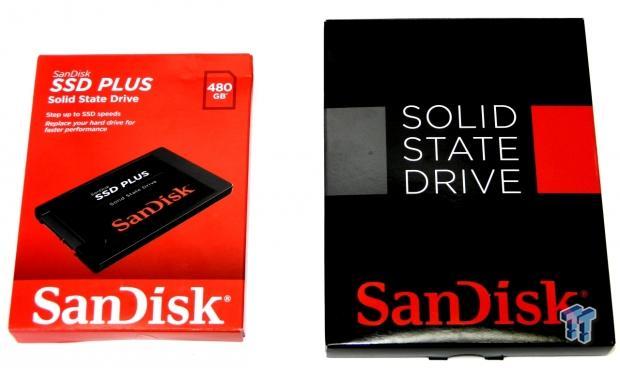
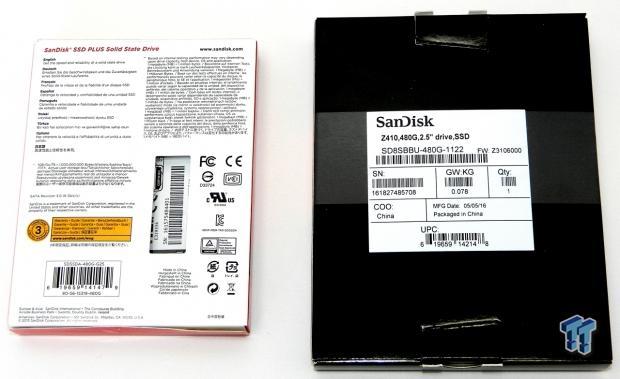
The SSD Plus ships in a smaller red and white themed packaging. There is an image of the enclosed drive on the front. The capacity of the enclosed SSD is listed on the upper right corner. The Z410 ships in a black themed plain looking box. The back of the SSD Plus packaging is white and offers little information about the enclosed SSD other than its 3-year limited warranty and SATA III interface. The back of the Z410's packaging lists the drives form factor, capacity, date of manufacture and shipping firmware.
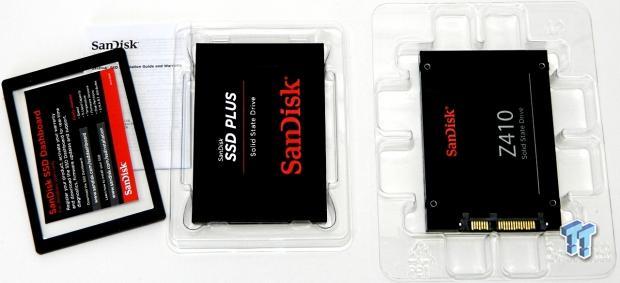
Both SSDs are cradled in clear plastic trays for protection. The SSD Plus includes a printed user/warranty guide, stick-on plastic spacer and a card that informs you where to go to download Sandisk's SSD Dashboard utility software.
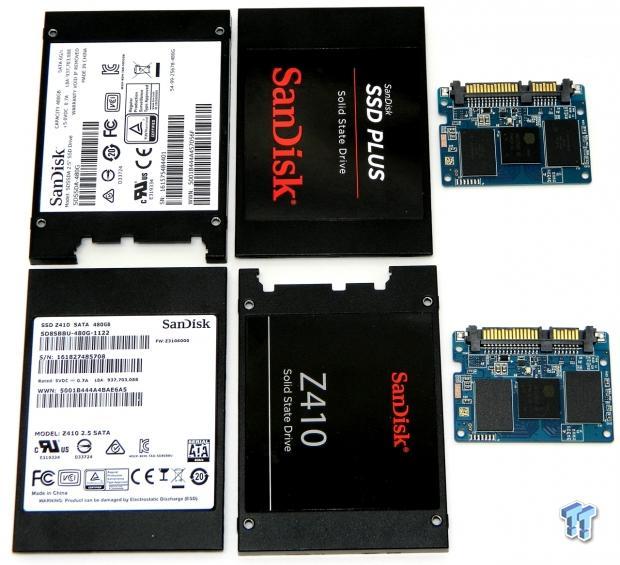
The enclosures are both constructed of plastic. They are both screw less snap together designs.

Labeling is the reverse of one another.
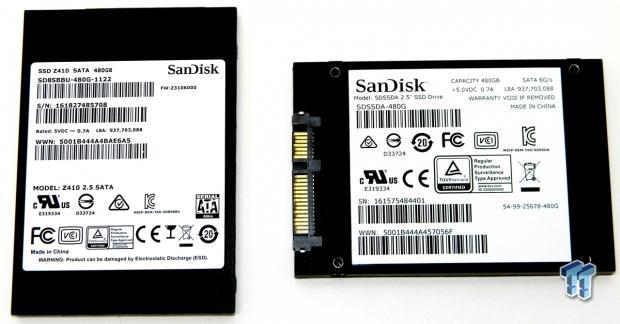
The front/back of the enclosure features a manufacturer's label that lists the drive's model number, capacity, serial number and various bits of other relevant information.
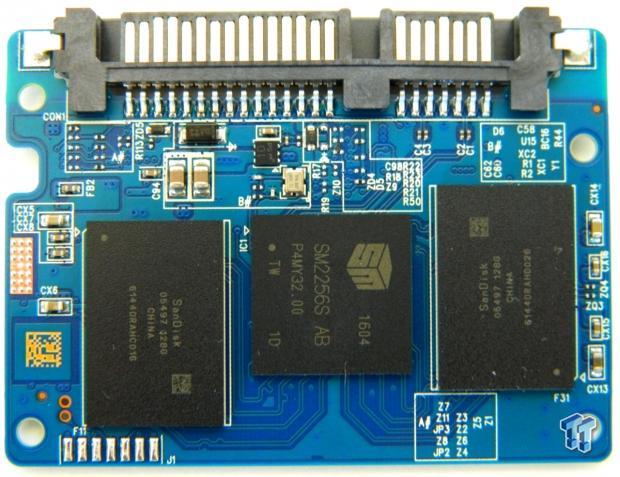
Both drives have identical PCB's and components, so we are only going to detail one of them. The PCB is a tiny DRAM-less design. This side of the PCB houses the drive's controller and two flash packages.
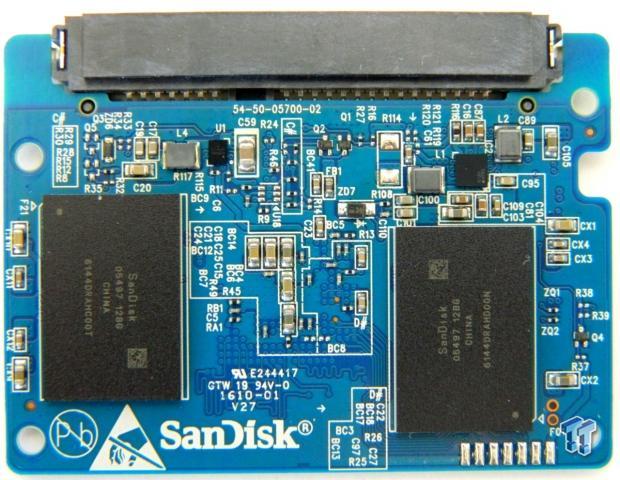
This side of the PCB houses two additional flash packages.
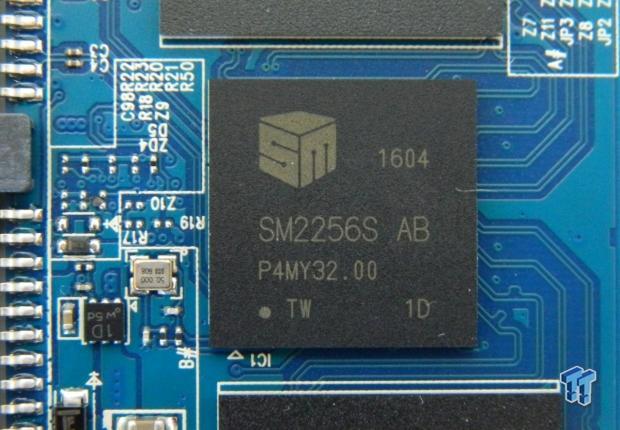
A detailed view of the SMI SM2256S 4-channel controller that powers both SSDs.

A detailed view of one of the drive's Sandisk branded 15nm TLC flash packages.
Test System Setup and Properties
Jon's Consumer SSD Review Test System Specifications
- Motherboard: ASRock Extreme9 Z97 - Buy from Amazon
- CPU: Intel Core i7 4790K @ 4.8GHz - Buy from Amazon / Read our review
- Cooler: Swiftech H2O-320 Edge - Buy from Amazon / Read our review
- Memory: Corsair Dominator DDR3 32GB 2400MHz - Buy from Amazon
- Video Card: Onboard Video
- Case: IN WIN X-Frame - Buy from Amazon / Read our review
- Power Supply: Seasonic Platinum 1000 Watt Modular - Buy from Amazon / Read our review
- OS: Microsoft Windows 10 Professional 64-bit - Buy from Amazon
- Drivers: Intel RAID option ROM version 13.0.0.2075 and Intel RST driver version 13.6.0.1002
We would like to thank ASRock, Crucial, Intel, Corsair, RamCity, IN WIN, and Seasonic for making our test system possible.
Drive Properties
240GB SSD Plus OS Disk 75% full
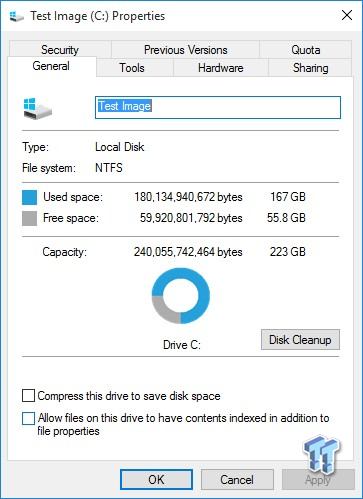
480GB SSD Plus OS Disk 75% full

240GB Z410 OS Disk 75% full

480GB Z410 OS Disk 75% full

The majority of our testing is performed with our test drive as our boot volume. Our boot volume is 75% full for all OS Disk "C" drive testing to replicate a typical consumer OS volume implementation. We feel that most of you will be utilizing your SSDs for your boot volume and that presenting you with results from an OS volume is more relevant than presenting you with empty secondary volume results.
System settings: Cstates and Speed Stepping are both disabled in our systems BIOS. Windows High-Performance power plan is enabled. Windows write caching is enabled, and Windows buffer flushing is disabled. We are utilizing Windows 10 Pro 64-bit OS for all of our testing.
Synthetic Benchmarks – ATTO & Anvil Storage Utilities
ATTO
Version and / or Patch Used: 2.47
ATTO is a timeless benchmark used to provide manufacturers with data used for marketing storage products.
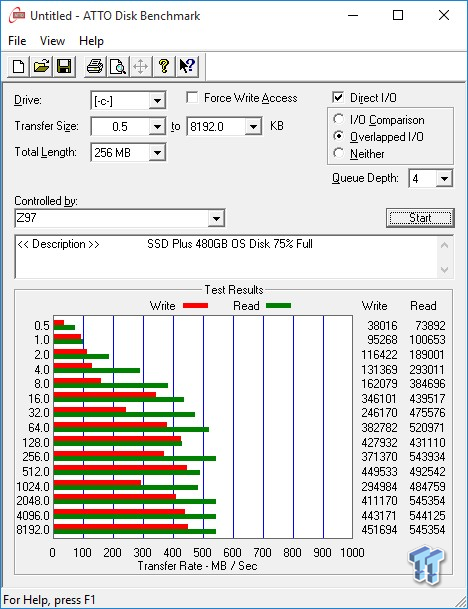
Compressible sequential read/write transfers max out at 545/459 MB/s. Keep in mind this is our OS volume, and it is filled to 75% of its total capacity. Maximum sequential read performance is achieved at a 2MB transfer size, maximum sequential write performance at 8MB transfers.
Sequential Write

The choppy write performance with data on our OS disk is typical of many of today's TLC-based SSDs. The SSD Plus displays a lot of variability, the Z410 displays a more conventional performance curve. The BP5e and TRION 150 exhibit far better sequential write performance than the rest of the drives in our test pool. The SP550 and BX200 are both SM2256 powered and both have DRAM caching.
Sequential Read

The BP5e and TRION 100 display the best sequential read performance of the drives in our test pool.
Anvil Storage Utilities
Version and / or Patch Used: 1.1.0
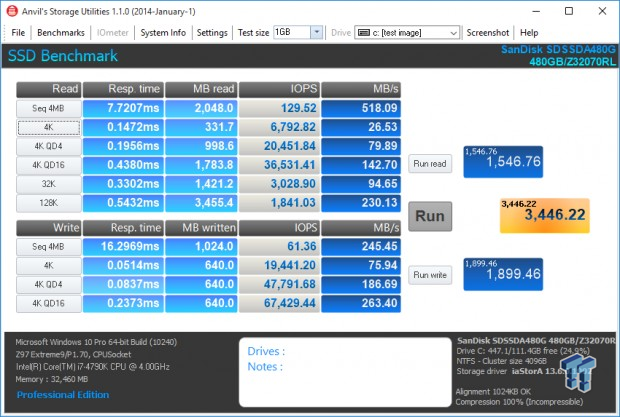
Anvil's Storage Utilities is a storage benchmark designed to measure the storage performance of SSDs. The Standard Storage Benchmark performs a series of tests; you can run a full test or just the read or write test, or you can run a single test, i.e. 4k QD16.
Scoring
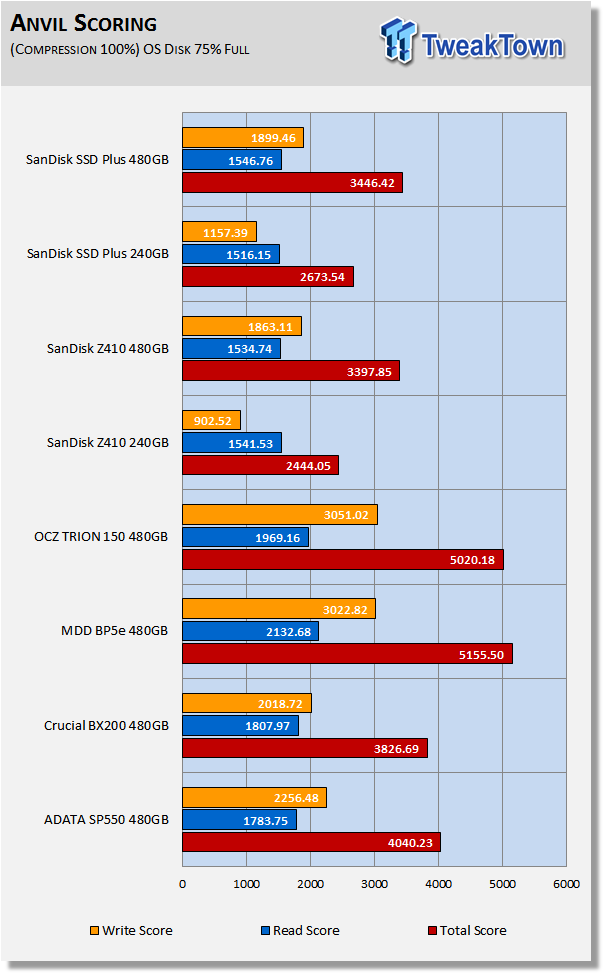
Anvil's scoring gives a good indication of a drive's overall performance. We have six SM2256 powered SSDs in our test pool and all six are completely eviscerated by the BP5e and TRION 150. It's not hard to see why no SM2256 powered SSD has ever received a TweakTown recommendation. The Z410 240GB earns the dubious honor of the lowest Anvil's score for a SATA III SSD to date. It's even lower than OWC's 2TB Mercury Electra.
(Anvil) Read IOPS through Queue Depth Scale
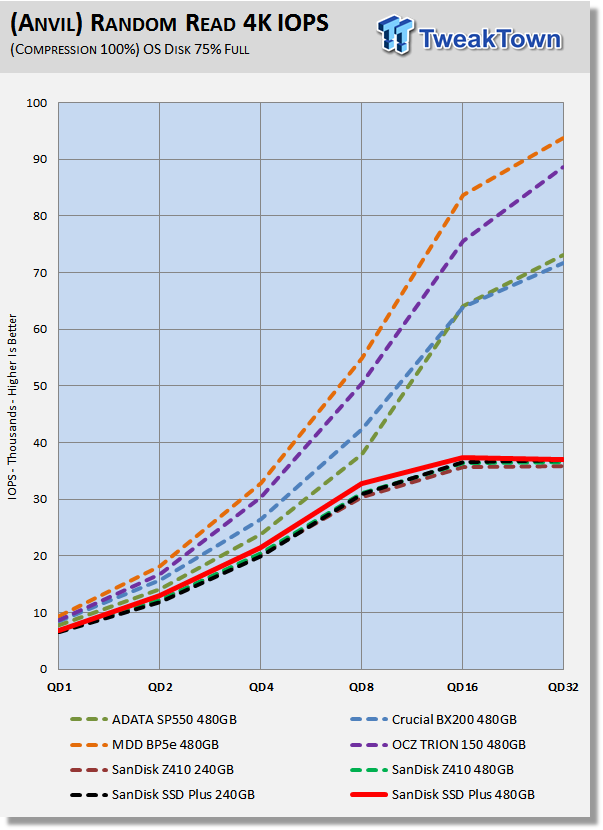
There is a well-defined pecking order to this test. S10 powered SSDs on top, then SM2256 SSDs with DRAM and then DRAM-less SM2256 SSDs.
(Anvil) Write IOPS through Queue Scale
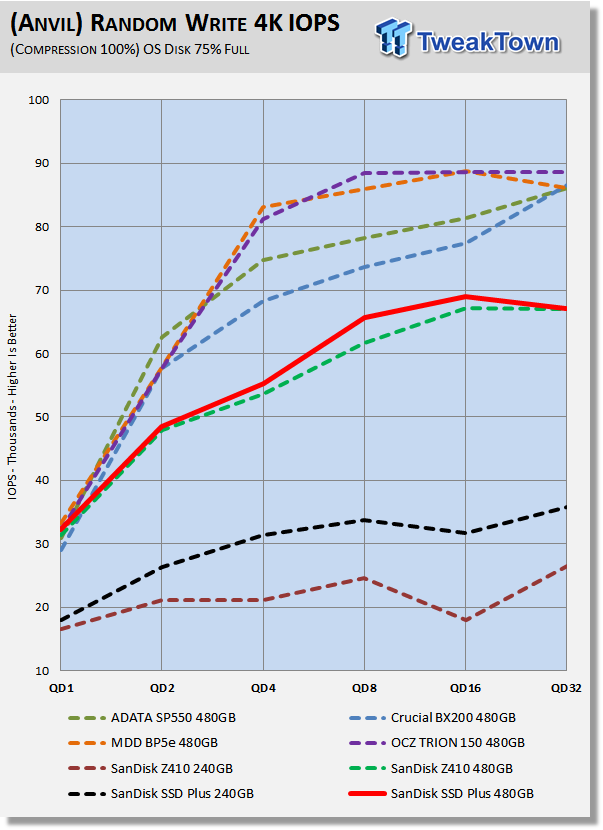
The well-defined pecking order stays the same but, with more definition to it due to the 240GB SSD Plus and Z410's abysmal write performance.
Synthetic Benchmarks – CrystalDiskMark & AS SSD
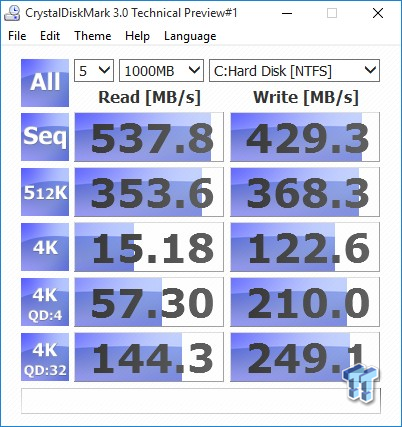
CrystalDiskMark
Version and / or Patch Used: 3.0 Technical Preview
CrystalDiskMark is disk benchmark software that allows us to benchmark 4k and 4k queue depths with accuracy. Note: Crystal Disk Mark 3.0 Technical Preview was used for these tests since it offers the ability to measure native command queuing at QD4.
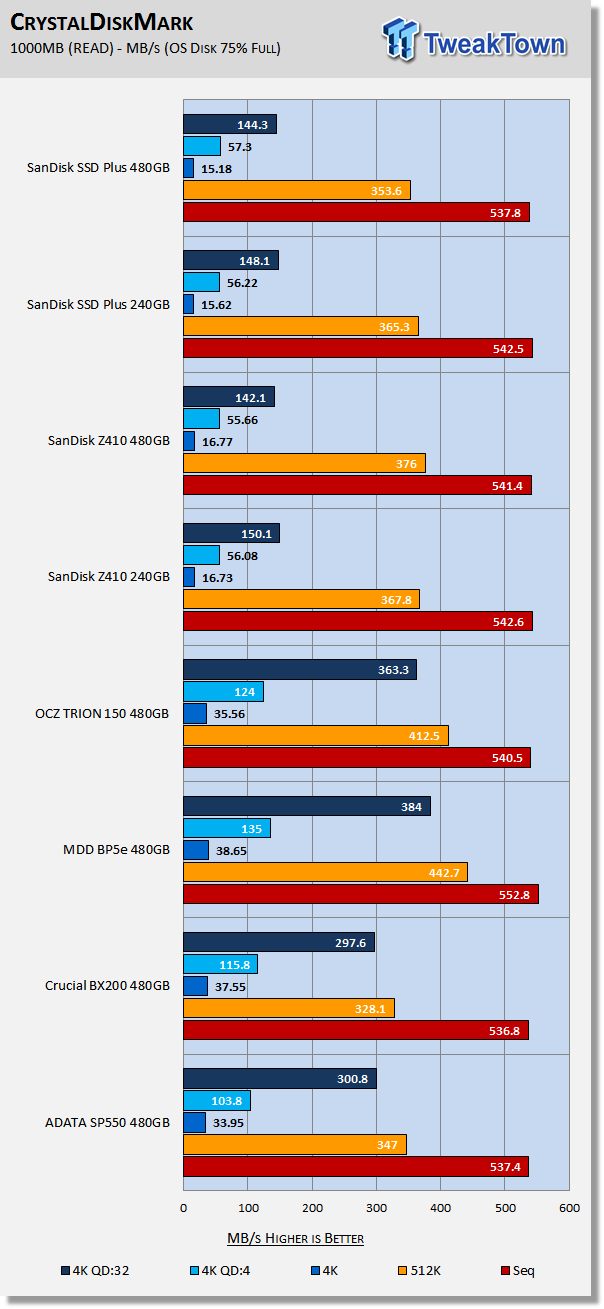
The BP5e and TRION 150 easily dispatch the competition once again. The BX200 and SP550 put up a fight while the SSD Plus and Z410 display some of the worst random read performance we've ever seen.
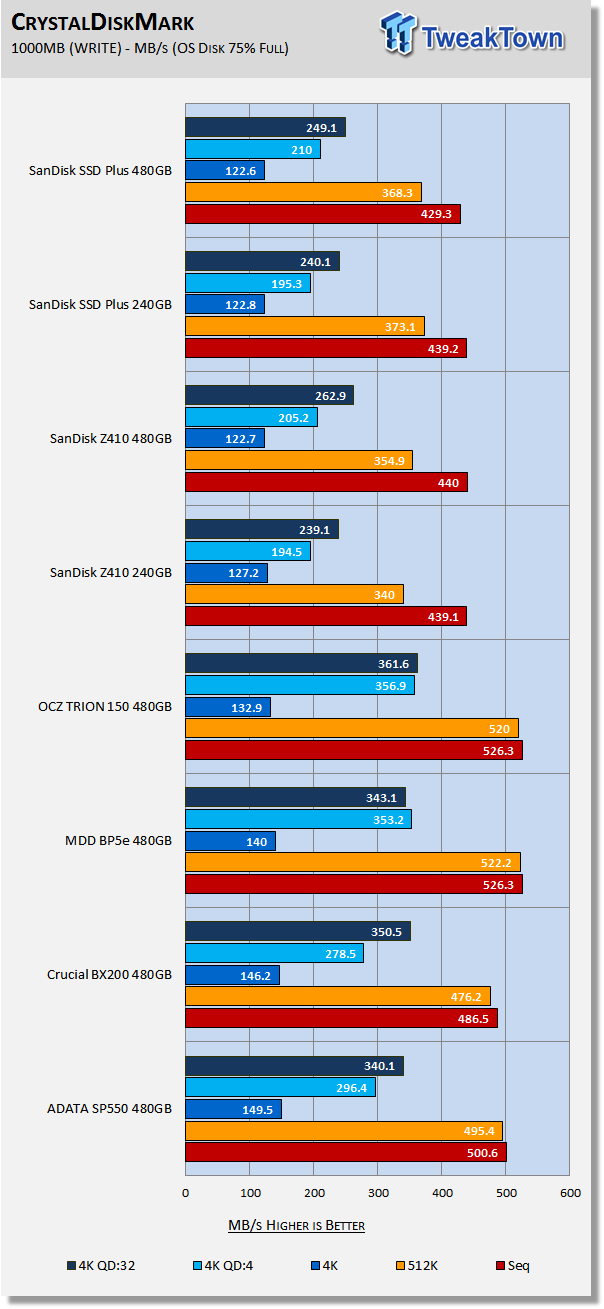
The BP5e and TRION 150 deliver the best overall performance in this test. The SSD Plus and Z410's do much better with the write portion of this test than the read portion, although it's still not very good.
AS SSD
Version and / or Patch Used: 1.7.4739.38088
AS SSD determines the performance of SSDs. The tool contains four synthetic as well as three practice tests. The synthetic tests are to determine the sequential and random read and write performance of the SSD.
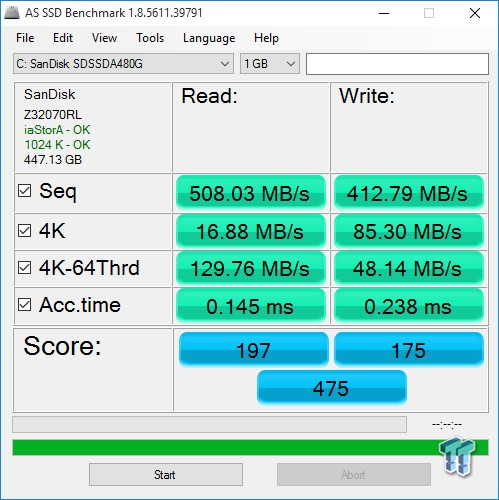

AS SSD is a demanding test and it manages to dismantle the SSD Plus and Z410. The BX200 and SP550 deliver decent results. The BP5e and TRION 150 again assert their dominance, cutting through this test with ease.
Benchmarks -Trace Based- PCMark Vantage, PCMark 7 & PCMark 8
Moderate Workload Model
We categorize these tests as indicative of a moderate workload environment.
PCMark Vantage - Hard Disk Tests
Version and / or Patch Used: 1.2.0.0
The reason we like PCMark Vantage is because the recorded traces are played back without system stops. What we see is the raw performance of the drive. This allows us to see a marked difference between scoring that other trace-based benchmarks do not exhibit. An example of a marked difference in scoring on the same drive would be empty vs. filled vs. steady state.
We run Vantage three ways. The first run is with the OS drive 75% full to simulate a lightly used OS volume filled with data to an amount we feel is common for most users. The second run is with the OS volume written into a "Steady State" utilizing SNIA's guidelines. Steady state testing simulates a drive's performance similar to that of a drive that been subjected to consumer workloads for extensive amounts of time. The third run is a Vantage HDD test with the test drive attached as an empty, lightly used secondary device.
OS Volume 75% Full - Lightly Used

OS Volume 75% Full - Steady State
Secondary Volume Empty - FOB

There's a big difference between an empty drive, one that's 75% full/used, and one that's in a steady state.
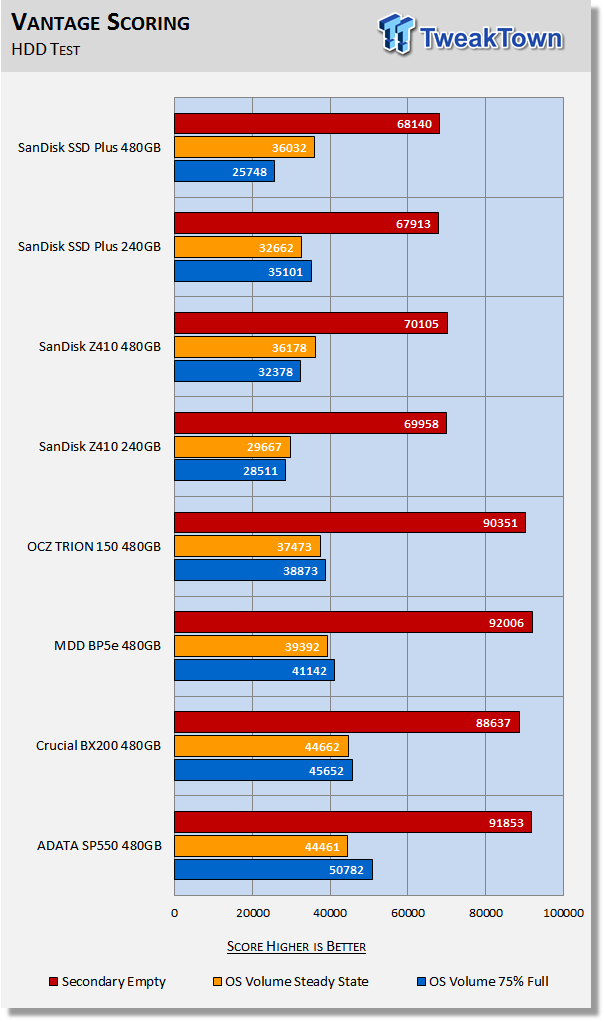
The important scores to pay attention to are "OS Volume Steady State" and "OS Volume 75% full." These two categories are most important because they are indicative of typical of consumer user states. When a drive is in a steady state, it means garbage collection is running at the same time it's reading/writing. This is exactly why we focus on steady state performance.
The SSD Plus and Z410 make a bit of a comeback with this test. However, it's not enough to make up for the dismal performance to this point. Crucial's BX200 manages to get a win for the first time, followed by the SP550 and then the BP5e. It is interesting to note that the SSD Plus and Z410's, with the exception of the 240GB SSD Plus, are delivering better performance in a steady state than they are at 75% full. We don't often see this, it's likely an indication of the lack of consistency inherent to DRAM-less designs.
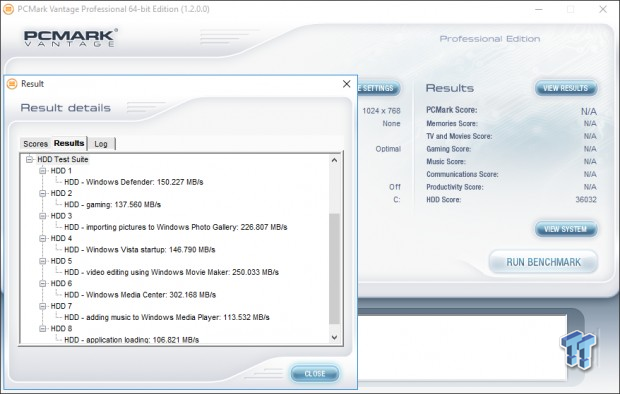
PCMark 7 - System Storage
Version and / or Patch Used: 1.4.0
We will look to Raw System Storage scoring for evaluation because it's done without system stops and, therefore, allows us to see significant scoring differences between drives.
OS Volume 75% Full - Lightly Used

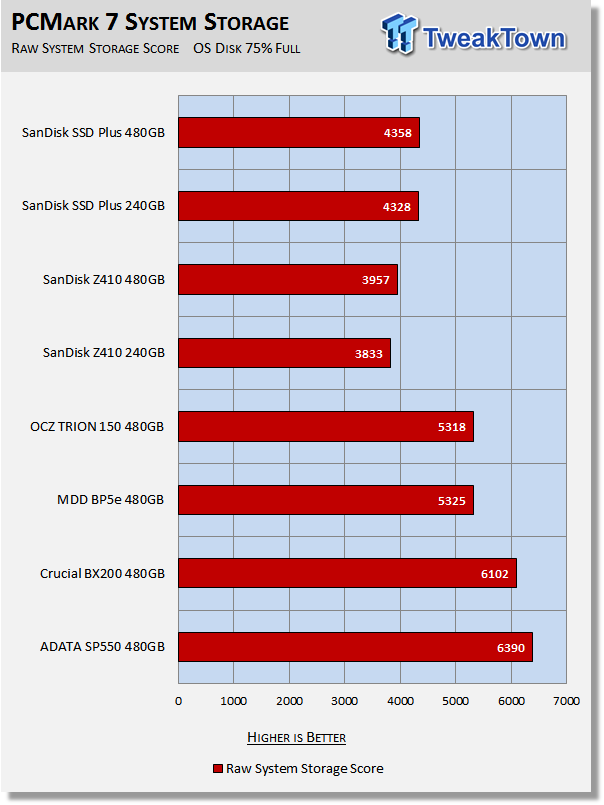
ADATA's SP550 takes a win for the first time. The SSD Plus and Z410 again deliver embarrassing performance, with the 240GB Z410 again setting a new record for futility. Looking at the benchmark screenshot taken of the SSD Plus 480GB we see something very rare indeed; the system storage score is higher than the raw system storage score.
PCMark 8 - Storage Bandwidth
Version and / or Patch Used: 2.4.304
We use PCMark 8 Storage benchmark to test the performance of SSDs, HDDs, and hybrid drives with traces recorded from Adobe Creative Suite, Microsoft Office, and a selection of popular games. You can test the system drive or any other recognized storage device, including local external drives. Unlike synthetic storage tests, the PCMark 8 Storage benchmark highlights real-world performance differences between storage devices.
OS Volume 75% Full - Lightly Used

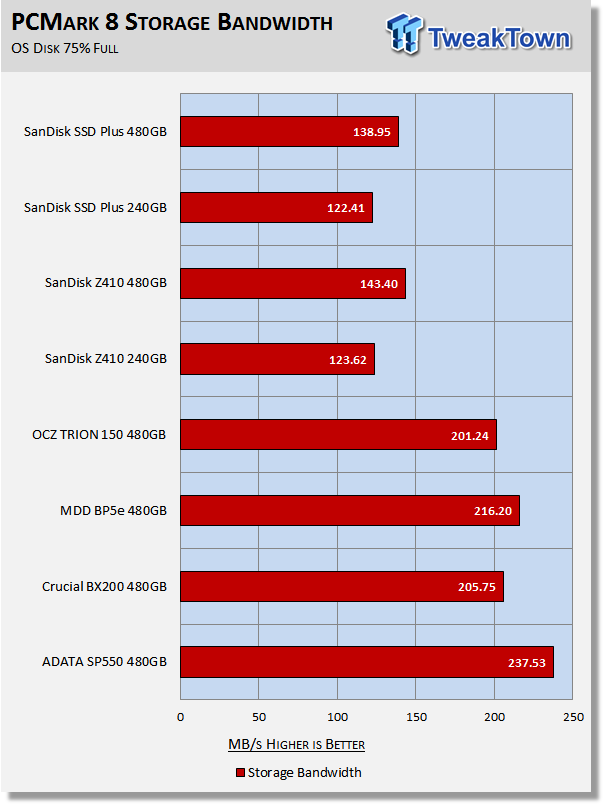
PCMark 8 is the most intensive moderate workload simulation we run. With respect to moderate workloads, this test is what we consider the best indicator of a drive's performance. This time the 240GB SSD Plus manages to take the win for losing, setting a new record low score for PCMark 8 testing. It's safe to at this point that Sandisk's super low cost TLC SSD's are the worst performing SSDs currently on the market. The SP550 wins this test, but it's too little too late, clearly not enough to make up for its dismal synthetic performance.
Benchmarks (Secondary) - Max IOPS, Response & Transfer Rates
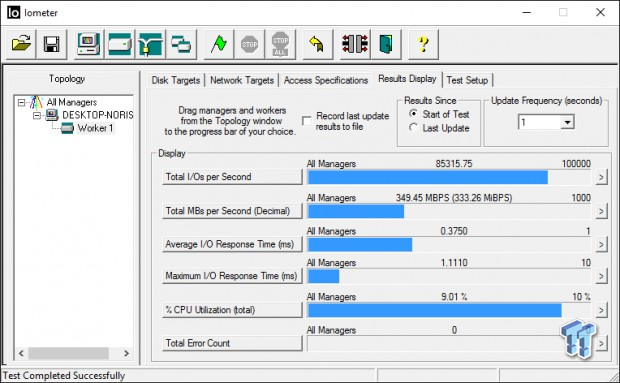
Iometer - Maximum IOPS
Version and / or Patch Used: Iometer 2014
We use Iometer to measure high queue depth performance. (No Partition)
Max IOPS Read
Max IOPS Write

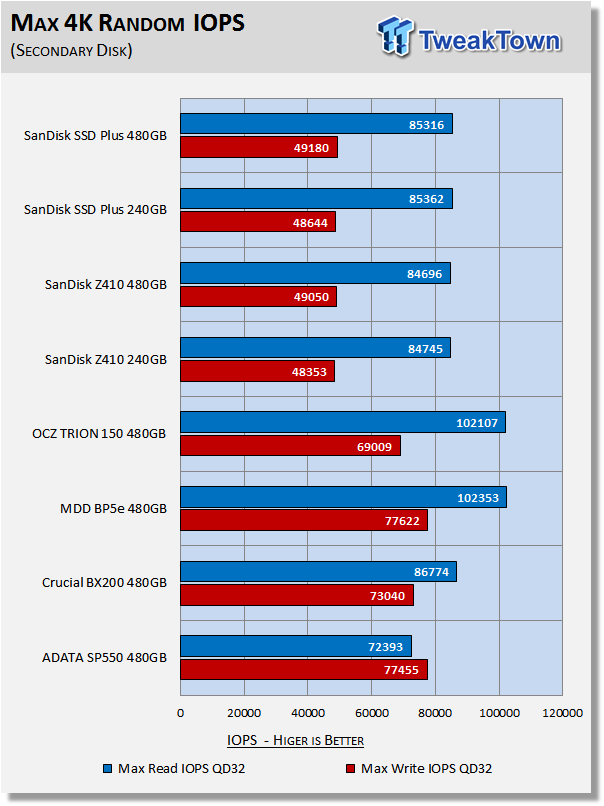
With our configuration, we are able to exceed Sandisk's maximum read IOPS specifications. In fact, we are able to more than double it. None of the Sandisk offerings are able to match their specified maximum write IOPS specifications, not by a long shot. MDD's BP5e delivers the best performance of the bunch scoring a win for both read and write performance.
Iometer - Disk Response
Version and / or Patch Used: Iometer 2014
We use Iometer to measure disk response times. Disk response times are measured at an industry accepted standard of 4K QD1 for both write and read. Each test runs twice for 30 seconds consecutively, with a 5-second ramp-up before each test. We partition the drive/array as a secondary device for this testing.
Avg. Write Response

Avg. Read Response

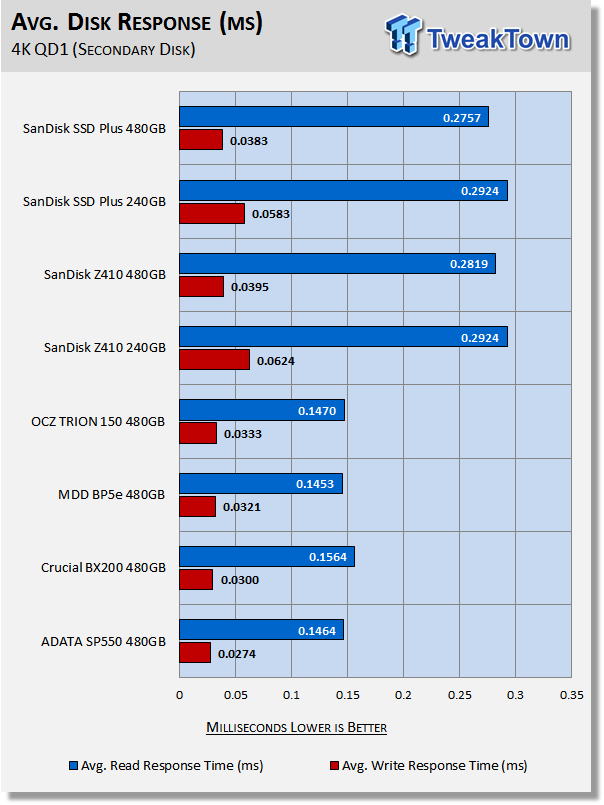
The SSD Plus and Z410 display the worst read response for a SATA III SSD we've ever witnessed. The BP5e takes the win for the best read response. The SP550 wins for the best write response.
DiskBench - Directory Copy
Version and / or Patch Used: 2.6.2.0
We use DiskBench to time a 28.6GB block (9,882 files in 1,247 folders) composed primarily of incompressible sequential and random data as it's transferred from our DC P3700 PCIe NVME SSD to our test drive. We then read from a 6GB zip file that's part of our 28.6GB data block to determine the test drive's read transfer rate. Our system is restarted prior to the read test to clear any cached data, ensuring an accurate test result.
Write Transfer Rate

Read Transfer Rate

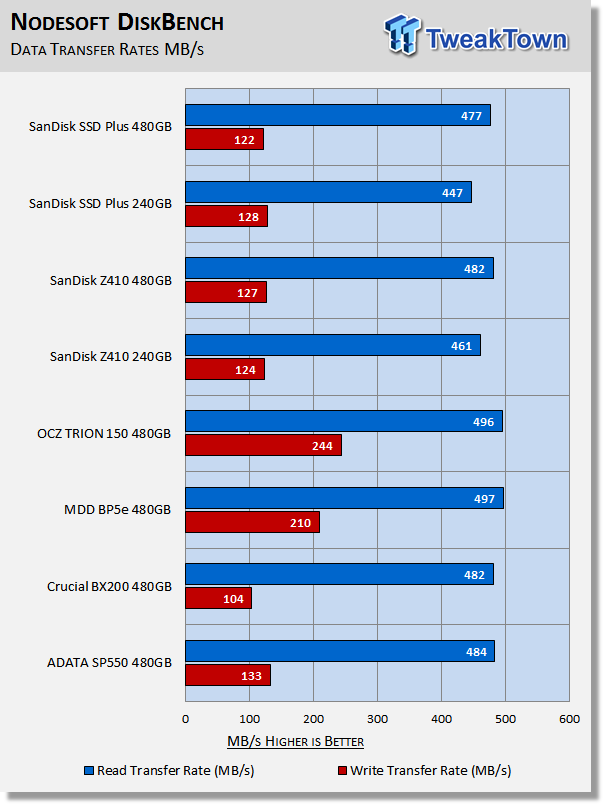
The main drawback to planar-based TLC SSDs is sustained write performance. This particular test happens to be the test we place the most importance on with regard to TLC SSDs. Terrible write transfer rates are inherent to SMI's SM2256 controller, which is THE reason no SM2256 powered SSD has ever received a TweakTown recommendation. When an SSD can't even write a large chunk of data as fast as even low performing spinning disk drives, it's not something we will ever be able to recommend to our readers. In contrast to the SM2256 powered SSDs the S10 powered SSDs deliver respectable sustained write transfer rates. Direct write to die for the win. This testing display's why we will continue to recommend Phison S10 powered TLC SSDs to our readers as the best bang for the buck in the super low cost segment.
Benchmarks (Secondary Volume) - PCMark 8 Extended
Futuremark PCMark 8 Extended
Heavy Workload Model
PCMark 8's consistency test simulates an extended duration heavy workload environment. PCMark 8 has built-in, command line executed storage testing. The PCMark 8 Consistency test measures the performance consistency and the degradation tendency of a storage system.
The Storage test workloads are repeated. Between each repetition, the storage system is bombarded with a usage that causes degraded drive performance. In the first part of the test, the cycle continues until a steady degraded level of performance has been reached. (Steady State)
In the second part, the recovery of the system is tested by allowing the system to idle and measuring the performance after 5-minute long intervals. (Internal drive maintenance: Garbage Collection (GC)) The test reports the performance level at the start, the degraded steady-state, and the recovered state, as well as the number of iterations required to reach the degraded state and the recovered state.
We feel Futuremark's Consistency Test is the best test ever devised to show the true performance of solid state storage in an extended duration heavy workload environment. This test takes on average 13 to 17 hours to complete and writes somewhere between 450GB and 14,000GB of test data depending on the drive. If you want to know what an SSDs steady state performance is going to look like during a heavy workload, this test will show you.
Here's a breakdown of Futuremark's Consistency Test:
Precondition phase:
1. Write to the drive sequentially through up to the reported capacity with random data.
2. Write the drive through a second time (to take care of overprovisioning).
Degradation phase:
1. Run writes of random size between 8*512 and 2048*512 bytes on random offsets for 10 minutes.
2. Run performance test (one pass only).
3. Repeat 1 and 2 for 8 times, and on each pass increase the duration of random writes by 5 minutes.
Steady state phase:
1. Run writes of random size between 8*512 and 2048*512 bytes on random offsets for 50 minutes.
2. Run performance test (one pass only).
3. Repeat 1 and 2 for 5 times.
Recovery phase:
1. Idle for 5 minutes.
2. Run performance test (one pass only).
3. Repeat 1 and 2 for 5 times.
Storage Bandwidth
PCMark 8's Consistency test provides a ton of data output that we use to judge a drive's performance.
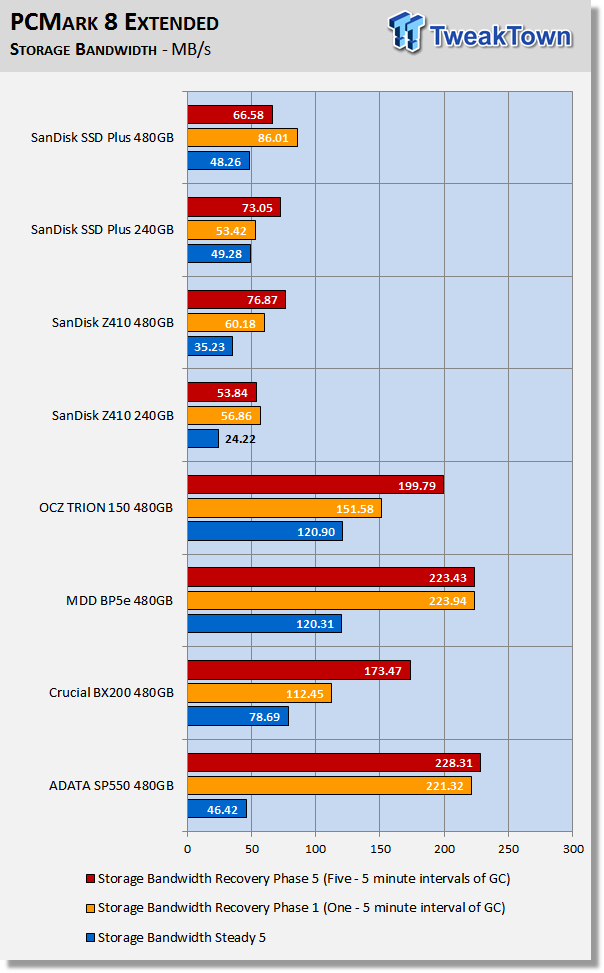
We consider steady state bandwidth (the blue bar) our test that carries the most weight in ranking a drive/arrays heavy workload performance. Performance after Garbage Collection (GC) (the orange and red bars) is what we consider the second most important consideration when ranking a drive's performance. Trace-based steady state testing is where true high performing SSDs are separated from the rest of the pack.
We needed to test the SSD Plus and Z410 to confirm our suspicion that they were inferior and this is just more proof that our suspicions were indeed correct. This also lends more credence to our never recommending any SMI SM2256 controlled SSD, while at the same time showing why we do highly recommend Phison S10 powered TLC SSDs.
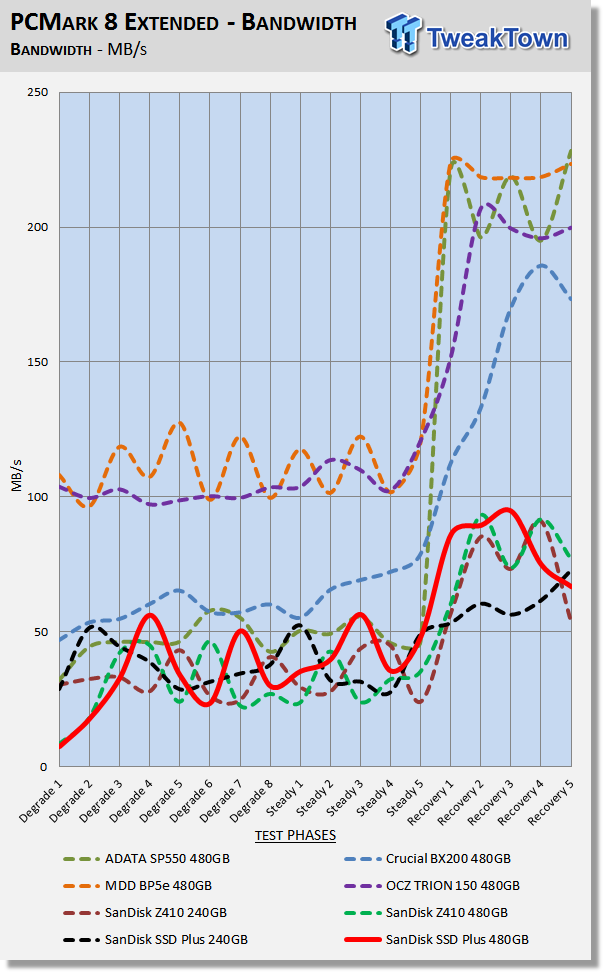
We chart our test subject's storage bandwidth as reported at each of the test's 18 trace iterations. This gives us a good visual perspective of how our test subjects perform as testing progresses. This chart sheds more light on how the drives perform as they progress through the testing phases.
Total Access Time (Latency)
We chart the total time the disk is accessed as reported at each of the test's 18 trace iterations. Low latency translates to the real-world as snappiness.

Disk Busy Time
Disk Busy Time is how long the disk is busy working. We chart the total time the disk is working as reported at each of the tests 18 trace iterations.

When latency is low, disk busy time is low as well.
Data Written
We measure the total amount of random data that our test drive/array is capable of writing during the degradation phases of the consistency test. Pre-conditioning data is not included in the total. The total combined time that degradation data is written to the drive/array is 470 minutes. This can be very telling. The better a drive/array can process a continuous stream of random data; the more data will be written.
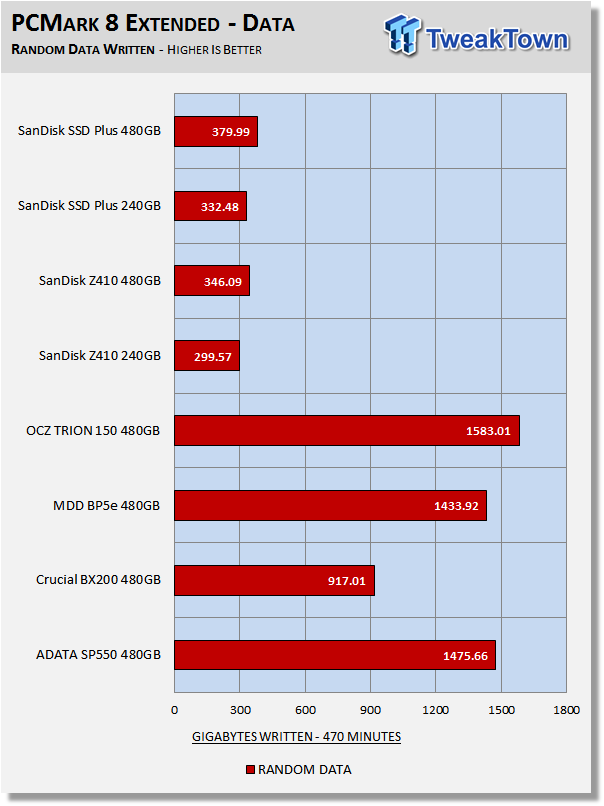
Overprovisioning and write latency are the biggest factors that determine the outcome of this portion of the test. This shows us several things. First and most obvious is that the SSD Plus and Z410 are in a class of their own, the lowest class. Second, we can see that SP550's 16nm Hynix TLC flash is superior to the BX200's 16nm Micron TLC flash. Lastly, we can see that the S10 is superior for the most part in comparison to the SM2256.
Benchmarks (Secondary Volume) – 70/30 Mixed Workload
70/30 Mixed Workload Test (Sledgehammer)
Version and / or Patch Used: Iometer 2014
Heavy Workload Model
This test hammers a drive so hard we've dubbed it "Sledgehammer". Our 70/30 Mixed Workload test is designed to simulate a heavy-duty enthusiast/workstation steady-state environment. We feel that a mix of 70% read/30% write, full random 4K transfers best represents this type of user environment. Our test allows us to see the drive enter into and reach a steady state as the test progresses.
Phase one of the test preconditions the drive for 1 hour with 128K sequential writes. Phase two of the test runs a 70% read/30% write, full random 4K transfer workload on the drive for 1 hour. We log and chart (phase two) IOPS data at 5-second intervals for 1 hour (720 data points). 60 data points = 5 minutes.
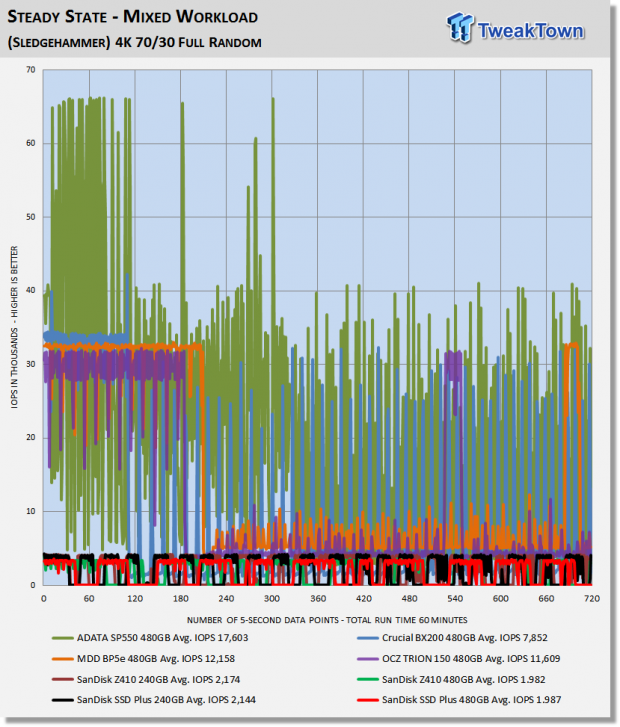
What we like about this test is that it reflects reality. Everything lines up, as it should. Consumer drives don't outperform Enterprise-Class SSDs that were designed for enterprise workloads. Consumer drives based on old technology are not outperforming modern Performance-Class SSDs, etc.
Just when we thought it couldn't get any worse for the SSD Plus and Z410 this happens. Even while filling the SSD Plus and Z410 with sequential writes the drives would drop to as low as 40MB/s, which is something we've never seen before. The SP550 delivers the highest average performance, but does so with massive performance variability.

The SSD Plus and Z410 would drop to as low as 30 IOPS with an average response time of nearly 1 second for long periods of time while running our preconditioned 70/30 random mixed workload.
Final Thoughts
We needed to answer the question for our readers. Are the SSD Plus and Z410 viable options in the super low-cost class of SSDs? They are, for the most part, certainly faster than spinning rust buckets, but that's not what we care about; a USB 3.0 stick is faster than a spinning rust bucket so that's not the criteria they need to meet. When compared to other SDDs in the same price range, specifically Phison S10 powered TLC SSDs, both the SSD Plus and Z410 fall pitifully short. We know that Sandisk never intended these two drives to compete for any performance crown, but when they cost the same as others per gigabyte, a certain minimum amount of performance is to be expected. What we got from the all-plastic enclosed SSD Plus and Z410, was metaphorically speaking all-plastic performance.
We believe that at the heart of the matter is the heart of the SSD itself. SMI's SM2256 4-channel controller consistently delivers lackluster performance that only gets worse in the absence of an onboard DRAM cache. We have never been able to recommend an SM2256 controlled SSD and the SSD Plus and Z410 only serve to reinforce our negative view of this particular controller. We have to look no further than our sustained write transfer testing to see exactly why we feel the way we do. When an SSD can't even deliver sustained write performance that's on par with a spinning HDD, we simply cannot overlook that fact.
Running SSD Plus and Z410 as our OS disk was nothing to write home about. The drive provided a decent boot experience and loaded programs in an acceptable manner, however, when multi-tasking, both did a face plant. They both provide a superior user experience to that of a spinning disk unless you are doing something like installing a game or transferring even a moderate amount of data, both of which are common tasks for the majority of users.
The SSD Plus and Z410 are not TweakTown recommended.
Pros:
- Faster than an HDD
Cons:
- High Cost to Performance Ratio
- Low Read Performance
- Low Sustained Write Performance
- All Plastic Enclosure
 Samsung 990 2TB SSD Review - Ninth Gen QLC at PCIe Gen4 Speeds
 HighPoint Rocket 1604L Gen5 x16 NVMe Software RAID AIC Review: half the price with full 59 GB/s speed
 UGREEN NASync DXP4800 GT Review: powerful 4-bay NAS with AMD Ryzen and dual 10GbE ports
 Phison E37T SSD Controller Exclusive Preview - The Fastest DRAMless SSD Platform Yet
 Seagate FireCuda X1070 4TB SSD Review - A New Mainstream Contender
 Xbox console exclusives can include multiplayer games too
 Assassin's Creed Black Flag Resynced sells over 3 million copies, New Game+ is coming
 Modder plays GTA Vice City and GTA III on a TV inside GTA San Andreas
 Enthusiast puts 11 fans and an AiO on an RTX 3080, gains only 4 FPS
 Spotify removed 75 million AI-generated tracks in 2025 as it cracks down on royalty abuse
 YouTuber claims Sony is using social media bots to push back against backlash over its physical disc announcement
 Apple's first OLED iPad mini could launch as early as October
 Ryzen 7 7700X3D outperforms Ryzen 7 5800X3D with just one stick of DDR5, making AM4 a terrible option for your next build
 Giveaway: Win an ASRock B850 Riptide WiFi and Phantom Gaming PG-850G PSU
 China's CXMT is on track to nearly match Micron's DRAM production capacity by the end of 2026
 SteelSeries Arctis Nova 7 Wireless Gen 2 Headset Review - New and Improved, But Is It Enough?
 AMD Ryzen 7 7700X3D Review - Days of Future Past
 ASUS ExpertBook Ultra (Panther Lake) 14" Business Laptop Review
 ASUS ROG Raikiri II Xbox Wireless Controller Review - Ready to Take Control
 MOZA FMP18 Panel Bundle Review: authentic F/A-18 Hornet cockpit controls for flight sims
 Micron 6600 ION 245.76TB Enterprise SSD Review - Best in Class Programming Speeds
 MOZA MA3F EFCM Flight Control Module Review: authentic Airbus A320 autopilot panel for simulators
 Turtle Beach Stealth Pro II Wireless Gaming Headset Review - Premium Sound, Fantastic Features
 MOZA MGX1000 Instrument Panel Review: a realistic Garmin G1000 replica for immersive flight sims
 I install and update most of my apps with this Windows command now, and I stopped downloading sketchy installers
 Hisense U6SF 65-inch MiniLED TV: High Performance Meets Leisurely Convenience
 I stopped digging through Windows menus after I set up this one folder
 Don't sell your Windows laptop until you do these things
 6 PC cleaning mistakes to avoid for safer hardware maintenance
 Phison and Intel Take Aim at Local AI's Memory Wall with aiDAPTIV
 How to Remap Keyboard Keys in Windows using Microsoft PowerToys
 7 tips to organize your Windows files for faster, easier access
 Intel Arc G3 Extreme first impressions with MSI's Claw 8 EX AI+ - Incredible power for an extreme price
 How to fix Wi-Fi Adapter Not Working on Windows laptops: troubleshooting tips