Introduction

OCZ seems to be in the news more than normal lately. The company's financials are still in question as a third party auditing company mulls over the books. A new financial story hits the web almost every day. Buy, sell, long, short, stay! All of the stories are as consistent as a hospitalized bi-polar patient.
What the financial people don't understand is the tech. Things aren't great at OCZ, but I wouldn't call them on the ropes yet. This could be the darkest hours for OCZ Technology, but the company is still standing and new products are coming out. The 20nm NAND flash shortage concerns me more than what the financial guys are saying. This isn't the first time OCZ had to deal with supply issues and their current situation isn't nearly as bad as some of the hills OCZ had to deal with in the DRAM days.
OCZ is now purchasing wafers of NAND and packaging their own chips. As long as OCZ is able to purchase by the wafer, they have an advantage over smaller SSD makers. A unique controller, one that is very fast helps quite a bit as well.

OCZ gave us a sneak peak at their 2013 product roadmap. Before the end of the year we'll see a new Vector product with 20nm flash, a new workstation PCIe card called Vector PCIe and the performance product we're looking at today, Vertex 450.
The OCZ Vertex 450 replaces Vertex 4 and is a step up from Vertex 3.20, a mainstream specific product. Vertex 450 uses a new stepping of the same Indilinx Barefoot 3 controller found in Vector. The M10 changes give the 450 SSD lower power consumption, lower operating temperatures and a nice price point for those looking for better than mainstream performance.
Specifications, Pricing and Availability

The new OCZ Technology Vertex 450 has three capacity sizes - 128GB, 256GB and 512GB. These are also the same capacity sizes found on OCZ's other in house controller product, Vector. At this time, we have the 256GB capacity size and plan on reviewing the 128GB and 512GB capacity sizes post-Computex.
The performance for the two largest capacity sizes comes in just a hair under Vector, but the 128GB model has a 110MB/s sequential write performance difference. This is due to the new 20nm NAND flash and it's expected since 20nm flash lacks the same high levels of flash interleaving because of the increased density.

The 256GB capacity size reads sequential data at 540MB/s and write sequential data at 525MB/s. 4K IOPS at QD32 comes in at 85K read and 90K write. All four-corner metrics come in just under those of Vector in this capacity size, but the trade-off in performance comes with three big benefits. The first is power consumption. In our testing, we found Vertex 450 consuming quite a bit less power than Vector. The second major benefit can be linked to the lower power consumption, low heat output. The third benefit is price. Let's cover that one now.
In our own in-house product spec sheet we included the official OCZ Technology MSRP list for Vertex 450. The 256GB capacity size wasn't low enough to make our best SSD's under $200 Editorial, but Vertex 450 ships with a real accessory bundle. In the package you get a desktop adapter bracket, drive cloning software (Data Migration), mounting screws, a sticker and a paper manual. We clump the warranty in with the accessory package so we can't say this product is on the same plane with Vector, since Vertex 450 only ships with a three year warranty instead of five.
OCZ Vertex 450 256GB SSD

Back to black. The Vertex 450 product package says more than it seems.

For the most part the Vertex 450 package is standard OCZ. You get a fair amount of product details and everything important comes with larger font.

The drive was protected from the other components inside the package. The desktop adapter bracket is on the other side of the foam so it's almost impossible to damage the drive during shipping.

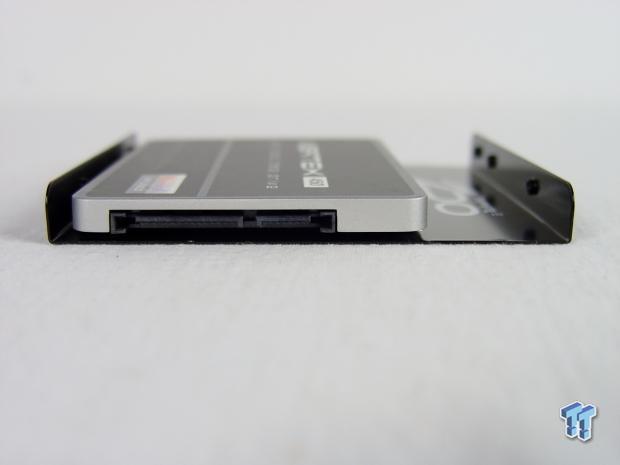
Not that you could hurt the new 7mm case OCZ is using these days. The drive is one of the heaviest on the market today and it's not because of the components on the inside. The case is dense, no expense was spared and the person inside the company calling for reducing the building material didn't win their fight. I've picked up brass knuckles that were lighter than this drive. Well, not really, but if you smacked someone with this drive, the prosecutor would give you the same charge, Vertex 450 is a dangerous weapon.

The 7mm z-height form factor uses the same mounting positions as standard notebook drives so you can mount Vertex 450 in any computer that use a 2.5" drive at this time.

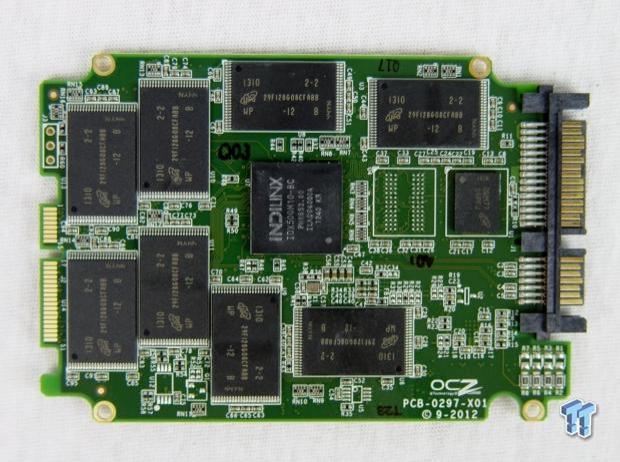
Jumping inside the latest Vertex, we found an Indilinx Barefoot 3 controller. This is the new M10 stepping with a slightly lower clock speed and new power optimizations.

There are sixteen Micron 20nm NAND flash chips, eight on each side.

It will be interesting going forward to see if the new Vector 150 uses the same M10 stepping or if it will continue with M00.

We found two Micron MT41K256M8DA-125M chips on the PCB, but the PCB actually has space for three DRAM buffer chips. The Micron buffer chips are DDR3L-RS chips, low voltage (1.35v) and run at 800MHz. The capacity, both chips combined is 512MB for the 256GB Vertex 450.
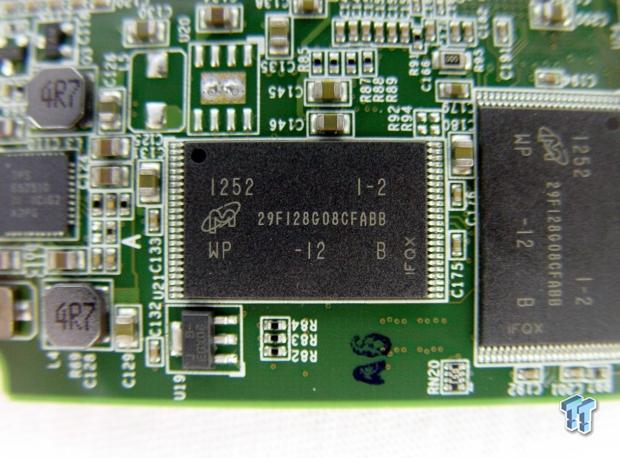
We've wrote a handful of reviews already of product with 20nm NAND. The Intel 335, Crucial M500 and ADATA SX900 (2013 revision) come to mind. Vertex 450 has higher performance specifications than all of those drives and of course, the Indilinx Barefoot 3 is a unique controller.
Benchmarks - Test System Setup and ATTO Baseline Performance
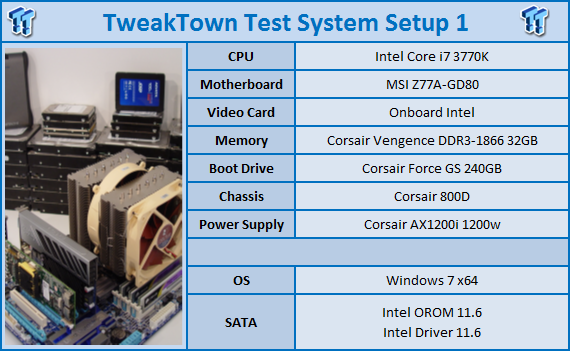
Desktop Test System
Lenovo W530 - Mobile Workstation
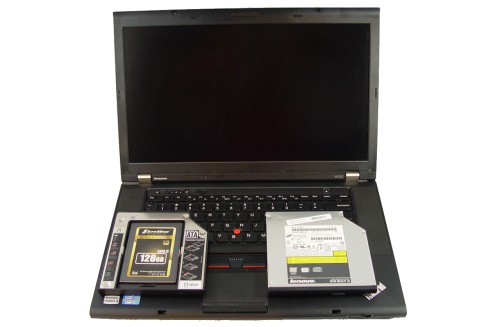
We use two systems for SSD testing. The desktop runs a majority of the tests and the Lenovo W530 runs the notebook power tests as well as the real-world file transfer benchmark.
ATTO Baseline Performance
Version and / or Patch Used: 2.34
ATTO is used by many disk manufacturers to determine the read and write speeds that will be presented to customers.

I know everyone likes to read me going on and on and on, but at some point we have to look at performance. Then again, this might be the second page you've looked at.
OCZ now measures their ATTO performance at a queue depth of 10, but even with our default depth of 4, we matched their marketing numbers. The read performance on our test nearly hit 547MB/s. The write performance peaked at nearly 525MB/s, but at the 128K block size.
Benchmarks - Sequential Performance
HD Tune Pro
Version and / or Patch Used: 4.00
Developer Homepage: http://www.efdsoftware.com
Product Homepage: http://www.hdtune.com
HD Tune is a Hard Disk utility which has the following functions:
Benchmark: measures the performance
Info: shows detailed information
Health: checks the health status by using SMART
Error Scan: scans the surface for errors
Temperature display
HD Tune Pro gives us accurate read, write and access time results and for the last couple of years has gained popularity amongst reviewers. It is now considered a must have application for storage device testing.
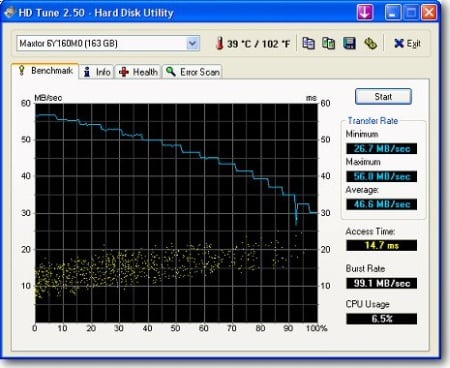

OCZ's firmware engineers like to make measuring sequential read and write performance difficult, but their intentions are good. In HD Tune Pro we achieved an average single queue depth read of 333MB/s. The result is and seems low compared to other drives because OCZ limits single queue depth performance. This started out at 200MB/s with Vertex 4 and as new products have come to market, the single depth read limit has increased. The reason why OCZ does this is the interesting part. Some companies tune their SSD's to show good benchmark numbers so you want to buy the drives. OCZ tunes their drives for real-world performance.
When you are multitasking, the last thing you want to see is a spinning wheel. By limiting the single queue read, you have performance left in reserve. Let's say you open Photoshop and it takes eight seconds to open, but while Photoshop is opening, you want to start playing an MP3 file or video. The firmware allows you to do both at the same time and both tasks complete as if the other wasn't happening. Your MP3 will begin to play just as it would if you didn't have Photoshop opening. It works the same way with other software and other tasks as well, like transferring a file and opening Outlook.
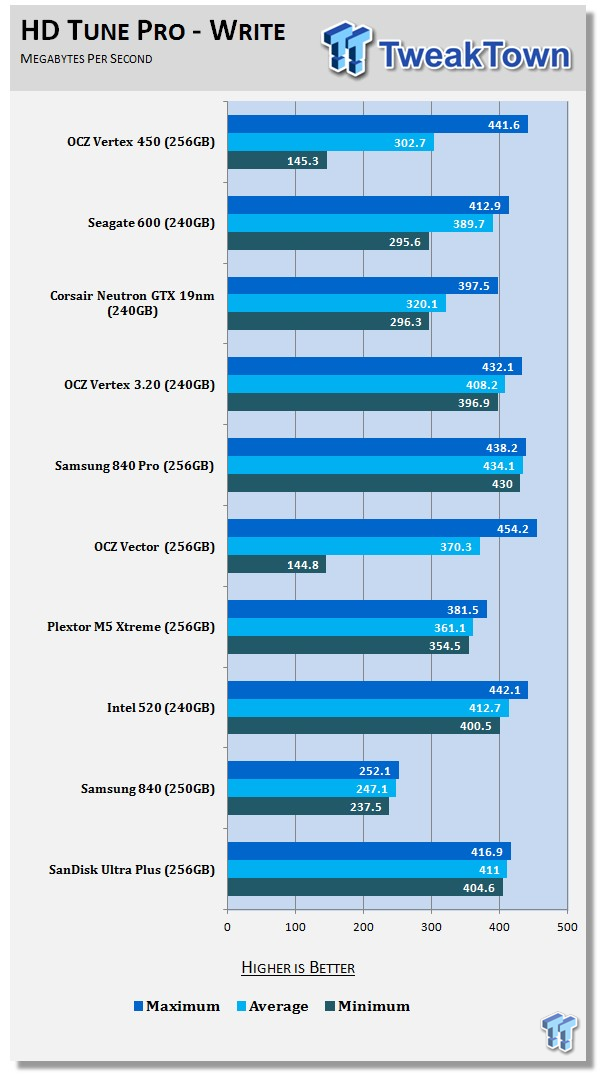
In this test, we're writing data across the entire drive in 64KB block sizes. This is right at the limit for OCZ's endurance engine to kick in. Let's look at a run with 128K to summarize straight sequential write performance.
HD Tach - Sequential Write Performance after Random Writes

In this test, we're also looking at write performance after the drive is peppered with 4K writes. As you can see, the write performance doesn't dip below 250MB/s often. This is a very important test for measuring write performance in a heavy use environment.
The Vertex 450 256GB does very well in this test. For a comparison you can view the Seagate 600 SSD 240GB results. The 600 SSD dipped below 25MB/s in a number of places in the test.
Benchmarks - AIDA64 Random Access Time
AIDA64 Random Access Time
Version and / or Patch Used: 1.60
Developer Homepage: http://www.aida64.com
Product Homepage: http://www.aida64.com
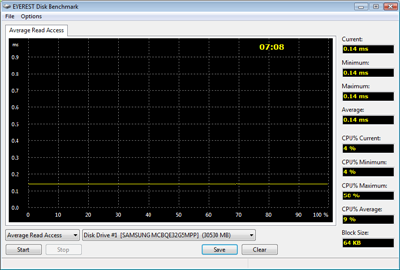
AIDA64 offers several different benchmarks for testing and optimizing your system or network. The Random Access test is one of very few if not only that will measure hard drives random access times in hundredths of milliseconds as oppose to tens of milliseconds.
Drives with only one or two tests displayed in the write test mean that they have failed the test and their Maximum and possibly their Average Scores were very high after the cache fills. This usually happens only with controllers manufactured by Jmicron.
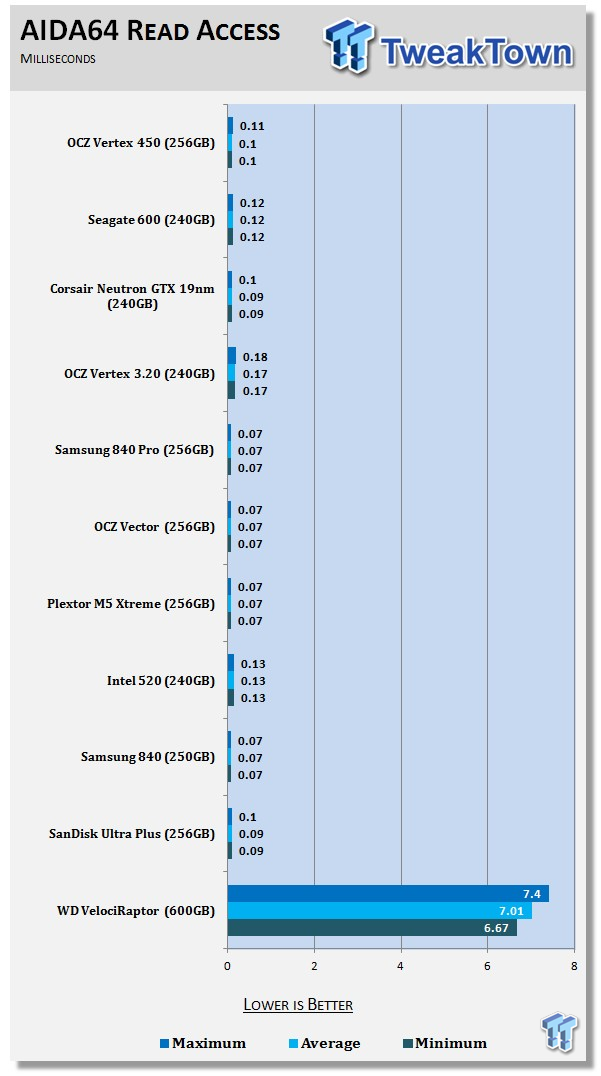
As we progress to smaller lithography for the NAND, latency becomes an issue. This isn't so much of an issue with read latency, but write latency will steadily increase. The read latency of the new Vertex 450 is a little higher than what we tested on Vector. There won't be too many places where these two drives differ by a great deal, but in this synthetic test we see a difference.
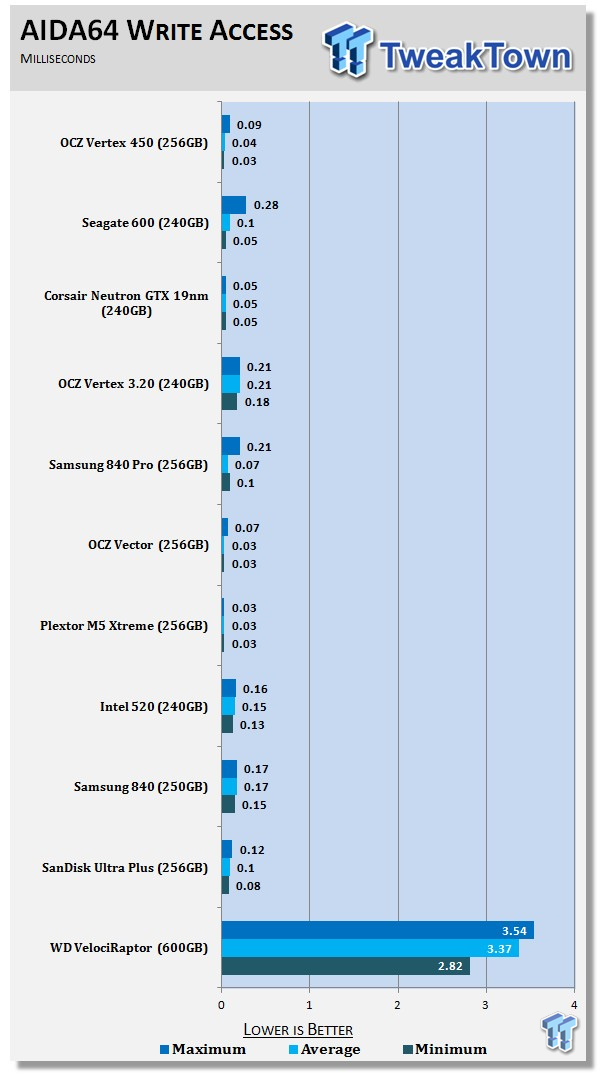
When measuring write latency across the drive, we observed a very small increase, which eventually peaked at the tail end of the test. This was OCZ's endurance safety switch kicking in again. I don't recall seeing the endurance mechanism kicking in on Vector with 25nm IMFT NAND, but it makes sense for OCZ to turn the knob a bit more with the new 20nm NAND.
Benchmarks - Anvil Storage Utilities
Anvil Storage Utilities
Version and / or Patch Used: RC6
So what is Anvil Storage Utilities? First of all, it's a storage benchmark for SSD's and HDD's where you can check and monitor your performance. The Standard Storage Benchmark performs a series of tests, you can run a full test or just the read or the write test or you can run a single test, i.e. 4K DQ16.
Anvil Storage Utilities is not officially available yet but we've been playing with the beta for several months now. The author, Anvil on several international forums has been updating the software steadily and is adding new features every couple of months.
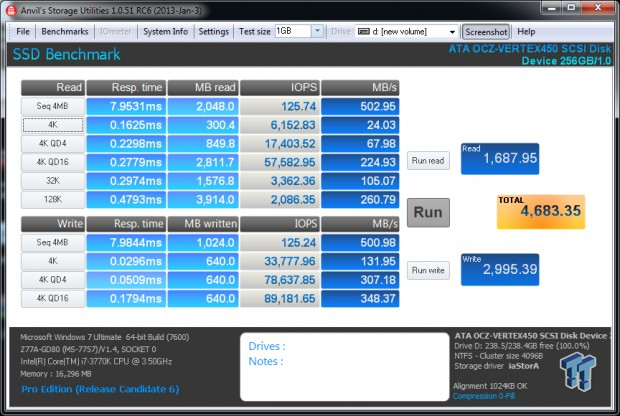
The software is used several different ways and to show different aspects for each drive. We've chosen to use this software to show the performance of a drive with two different data sets. The first is with compressible data and the second data set is incompressible data. Several users have requested this data in our SSD reviews.
0-Fill Compressible Data
Incompressible Data

The Indilinx Barefoot 3 M10 controller doesn't differentiate between compressible and incompressible data. Here we see nearly identical performance when working with both file types.
Read IOPS through Queue Depth Scale

Even though the performance so far has been very Vector like, there are a few small signs of decreased performance.
Here we see 4K read performance scales through doubling queue depths. Manufacturers like to talk about their high queue depth performance, but most of us rarely see more than QD8 and even QD8 is a rare feat for desktop users. Low queue depth performance is directly related to how fast tasks start, much like the latency test on the previous page. When I explain it in person is the WOW Factor. WOW, that opened fast!
Scaling Write IOPS through Queue Scale

My test system motherboard doesn't like to push more than just over 90K write IOPS and that's why the Samsung 840 Pro and OCZ Vector don't scale all the way to 100K IOPS. With that in mind and assuming your motherboard isn't capable of pushing 100K IOPS, the Vertex 450 and Vector are really close to each other in 4K write IOPS at high queue depths. Again, it's difficult to get into really high queue as a desktop user.
Benchmarks - CrystalDiskMark
CrystalDiskMark
Version and / or Patch Used: 3.0 Technical Preview
Developer Homepage: http://crystalmark.info
Product Homepage: http://crystalmark.info/software/CrystalDiskMark/index-e.html
Download here: http://crystaldew.info/category/software/crystaldiskmark
CrystalDiskMark is a disk benchmark software that allows us to benchmark 4K and 4K queue depths with accuracy.
Key Features:-
* Sequential reads/writes
* Random 4KB/512KB reads/writes
* Text copy
* Change dialog design
* internationalization (i18n)
Note: Crystal Disk Mark 3.0 Technical Preview was used for these tests since it offers the ability to measure native command queuing at 4 and 32.

Looking at 4K performance from the throughput side, Vertex 450 256GB manages just over 25MB/s. The drive scales well in this test and again lags just behind Vector.

The single queue depth 4K write is just behind the Vector, but there isn't anything else on the chart that can beat the Vertex 450 256GB at this task. The QD4 test is nearly as fast as the Seagate 600 SSD's QD32 result.
Benchmarks - PCMark Vantage Hard Disk Tests
PCMark Vantage - Hard Disk Tests
Version and / or Patch Used: 1.0.0
Developer Homepage: http://www.futuremark.com
Product Homepage: http://www.futuremark.com/benchmarks/pcmark-vantage/

PCMark� Vantage is the first objective hardware performance benchmark for PCs running 32 and 64 bit versions of Microsoft� Windows Vista�. PCMark Vantage is perfectly suited for benchmarking any type of Microsoft� Windows Vista PC from multimedia home entertainment systems and laptops to dedicated workstations and high-end gaming rigs. Regardless of whether the benchmarker is an artist or an IT Professional, PCMark Vantage shows the user where their system soars or falls flat, and how to get the most performance possible out of their hardware. PCMark Vantage is easy enough for even the most casual enthusiast to use yet supports in-depth, professional industry grade testing.
FutureMark has developed a good set of hard disk tests for their PCMark Vantage Suite. Windows users can count on Vantage to show them how a drive will perform in normal day to day usage scenarios. For most users these are the tests that matter since many of the old hat ways to measure performance have become ineffective to measure true Windows performance.

HDD1 - Windows Defender
HDD2 - Gaming
HDD3 - Windows Photo Gallery
HDD4 - Vista Startup
HDD5 - Windows Movie Maker
HDD6 - Windows Media Center
HDD7 - Windows Media Player
HDD8 - Application Loading
We ran into something interesting when compiling the benchmark charts and went back to test a little more. You can see on the test chart that Vertex 450 has a weak point, Windows Movie Maker. In Movie Maker, large video files are wrote to the drive, much like the way our sequential write test at the start of the benchmark portion of the review does.
Since we think the endurance safe guards kick in faster with this product, I can't help but wonder if Vertex 450 will has an issue when used for large video encoding projects.
Benchmarks - PCMark Vantage - Drives with Data Testing
For a complete breakdown on the Drives with Data Testing please read this article. You will be able to perform this test at home with the files provided in the article - full instructions are included.
- Brief Methodology
SSD's perform differently when used for a period of time and when data is already present on the drive. The purpose of the Drives with Data testing is to show how a drive performs in these 'dirty' states. SSD's also need time to recover, either with TRIM or onboard garbage collection methods.
Drives with Data Testing - 25%, 50%, 75% Full States and Dirty / Empty Test
Files needed for 60 (64GB), 120 (128GB), 240 (256GB)
60GB Fill - 15GB, 30GB, 45GB
120GB Fill - 30GB, 60GB, 90GB
240GB Fill - 60GB, 120GB, 160GB
Empty but Dirty - a test run just after the fill tests and shows if a drive needs time to recover or if performance is instantly restored.

Fill testing performance is much better than I anticipated going into the review. Vertex 450 256GB is actually faster than Vertex 3.20 240GB with both drives at half capacity. Given the SandForce architecture's advantage with compressible data, this surprised us. We rarely see apples to apples SandForce drives beaten in this test.
Benchmarks - BootRacer
BootRacer - System Boot Time
Version and / or Patch Used: 4.0
Developer Homepage: Greatis
Product Homepage: BootRacer
Download here: http://www.greatis.com/bootracer/download.htm
Note: In this test we use the Lenovo W530 Mobile Workstation loaded with an operating system and several program files. The data on the drive at the time of the test is 45GB. The second test, 50GB Free, was ran with the drives filled with block data until only 50GB of free capacity remained.
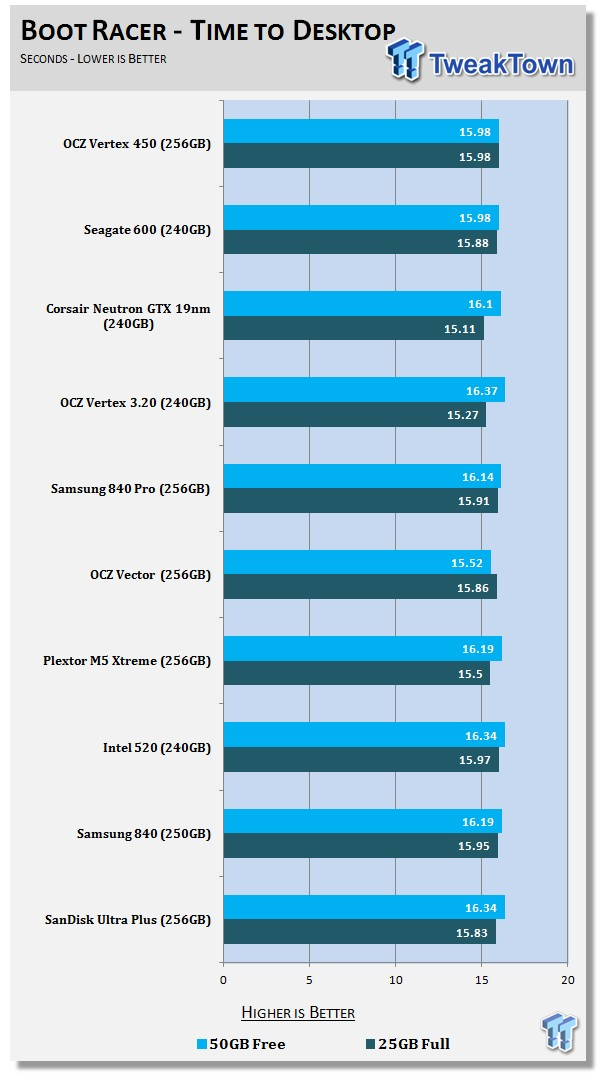
When I validated BootRacer for benchmark use, SSD's were slower than they are today. After validation, I didn't pull the benchmark into the reviews until quite a bit later. Now that we're hitting the limits of SATA III, the test has lost value.
As you can see in the chart, most of the top tier SSD's reboot our Lenovo W530 in nearly the same amount of time.
Benchmarks - DiskBench
DiskBench - Directory Copy
Version and / or Patch Used: 2.6.2.0
Developer Homepage: Nodesoft
Product Homepage: DiskBench
Download here: http://www.nodesoft.com/diskbench/download
Note: In this test we use the Lenovo W530 Mobile Workstation and a SuperSSpeed S301 SLC 128GB SSD to move a 15GB block of data to and from the target drive. This is part of our real-world test regiment. Roughly 45GB of data resides on the target drive before the '15GB Block' is transfer. The 15GB Block is the same data we built for the Data on Disk Testing and is a mix of compressible and incompressible data.

The OCZ Vector 450 240GB transfers data to and from another high speed SSD at a high rate of speed. Both tests show near 300MB/s transfers.
Benchmarks - Power Testing
Bapco MobileMark 2012 1.5
Version and / or Patch Used: 2012 1.5
Developer Homepage: http://www.bapco.com
Test Homepage: http://www.bapco.com
MobileMark 2012 1.5 is an application-based benchmark that reflects usage patterns of business users in the areas of office productivity, media creation and media consumption. Unlike benchmarks that only measure battery life, MobileMark 2012 measures battery life and performance simultaneously, showing how well a system design addresses the inherent tradeoffs between performance and power management.

The power charts are full again. Hover your mouse over the two charts on this page to get a closer look.
Vertex 450 (dark purple on the chart) uses less power than Vector and thus delivers longer battery life. In our custom test with a six-cell battery, we achieved 262 minutes of battery life. On the chart that result makes it look like a poor performer, but it's about average when every SSD we've tested is included in the pool.
PCMark Vantage HDD Test - Power Draw

At the very start of this test you can see the low .1254 amp idle power consumption. Vector is also included in this test and the power consumption for Vector is nearly identical to Vertex 450 with one exception.
When you zoom into the chart, the dark blue line (Vector) touches the dark purple line (Vertex 450) in most places on the test. What Vertex 450 has that Vector doesn't is the low idle power consumption.
Final Thoughts

Before we give our breakdown on Vertex 450 256GB SSD, let's first take a look at Vector to gain some insight. At the time of writing Newegg still had Vector 256GB in stock and selling at $249.99. Vector ships with the same accessory package as Vertex 450, plus two extra years on the warranty, as well as Far Cry 3. The MSRP for Vector is $299.99 and when the drive first went on sale, Newegg held that MSRP for longer than they normally do for SSD's. We know from the OCZ press deck that Vector, as we know it, is on the way out. OCZ is a different company now and they won't have their older drives shipping from warehouses two years after they reach end of life. I suspect current Vector inventory will be gonzo in three months, if not sooner. 25nm flash is hard to come by and sells at a premium. If you want the top tier, your days are numbered to get Vector before it receives a 19/20nm update, and the name Vector 150.
Vertex 450 256GB has an MSRP of $234.99 and we suspect Newegg will use the MSRP as a starting point. Assuming the price for Vector holds steady and the MSRP is used for Vertex 450, I have to tell you to go Vector since it has everything we want right now. Right now is the key though because the window is small and we know it's coming sometime in Q3.
The performance between these two drives is very close, Vector is without a doubt faster, but the difference isn't night and day. It's actually really close, more like 11AM and 1PM. Battery life performance though is a different story. Vertex 450 delivers roughly 20 extra minutes in our test with a six-cell battery. A nine cell would increase that to roughly 30 minutes. That doesn't seem like much, but we are using an expensive workstation notebook. In an ultrabook where battery life can exceed 10 hours, we can see Vertex 450 delivering an addition hour to an hour and a half of battery life over the Vector. All of this time comes from idle power consumption so it's not an exact science since we all use our notebooks differently, but most of the time the SSD idles, so any power savings in that area delivers big battery time rewards.
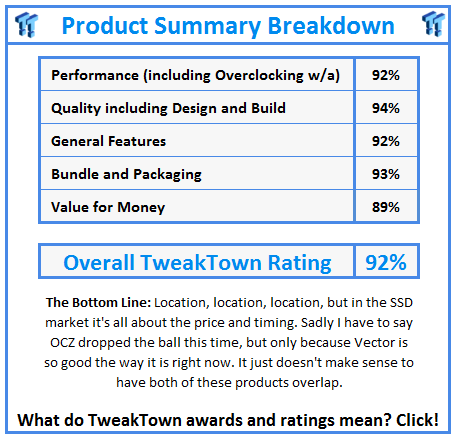
All things considered, we like this product, but its timing really sucks. There's just no other way to put it. This is why video card makers update their flagship products before they release the mainstream products (most of the time). If Vertex 450 shipped with an equal warranty and Far Cry 3, then the nominal $30 price difference would matter, but there is no angle that makes Vertex 450 look like a better buy than the current Vector right now.
In a few months time, when Vertex 450 is below MSRP and let's theoretically say Vector 150 with 20nm NAND is $80 more, we might feel different. At that point, the game bundle will be gone, at least for this scenario, we'll say it is. At that point you're paying $80 more for what could be very close performance and an extra couple of years on the warranty. At that point I like Vertex 450 and the saved money for something like a new keyboard. That day is not today, get the 25nm Vector while you can, right now it is the better buy.

