Introduction
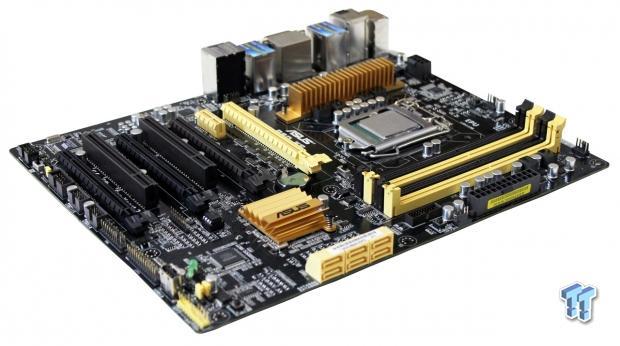
ASUS has a very strong lineup of motherboards ranging from entry-level, consumer class motherboards, to server and workstation class boards. The line between enthusiast and workstation motherboards is currently blurred. Many workstation features are now present on enthusiast class products, but workstation class products still endure validation from more strenuous testing.
Often, workstation products receive chipsets derived from server products, so overclocking options are limited. The chipsets give a solid foundation for increased stability. Heavy-duty applications can take days to complete a task with 100% CPU load, so increased stability takes precedence over higher clock speeds.
The demand for high quality workstation boards that will find uses in many different environments (such as in the office, design studios, small business) is very high. Stability is a primary deciding point, because these systems will be up and running for long stretches of time.
Keeping up to date with CPU's has many benefits, such as lower power use, and less noise in the office environment. The ASUS P9D WS can handle the latest Intel 4th gen CPU's, which perform very well with low power and noise requirements.
The ASUS P9D WS motherboard handles all of these requirements, so let us take a closer look at this workstation motherboard from ASUS.
Packaging & Specifications
Packaging
Packaging for the P9D WS is very clean. It is packaged in boxes that you just want to keep around, and not throw away after the build is complete.
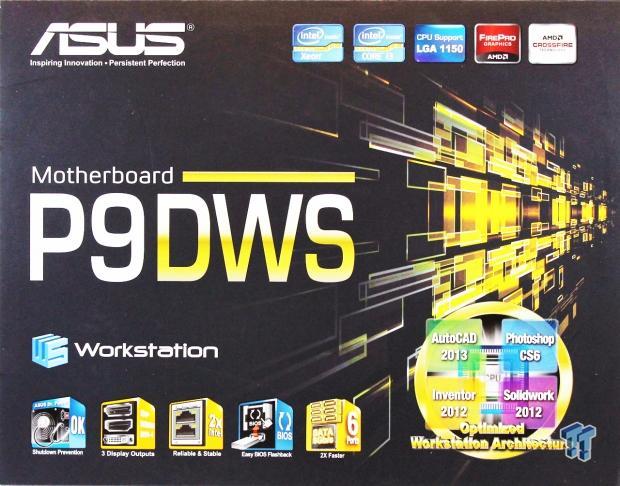
Here, we see a picture of the front of the box, showing all of the features that you can expect to find on this motherboard.
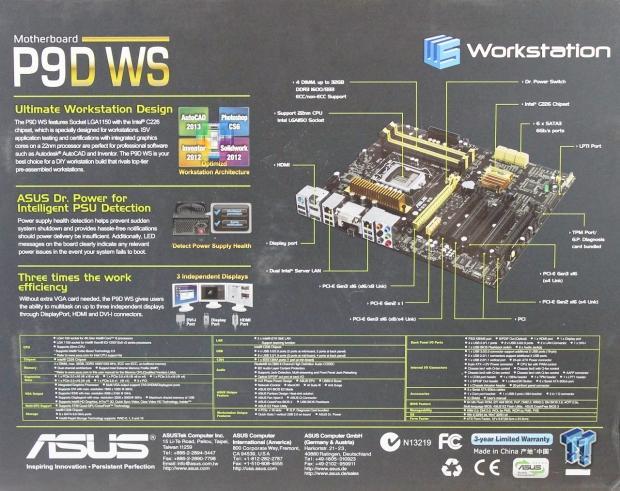
Here, we see the back of the box, with more detail on feature load out.
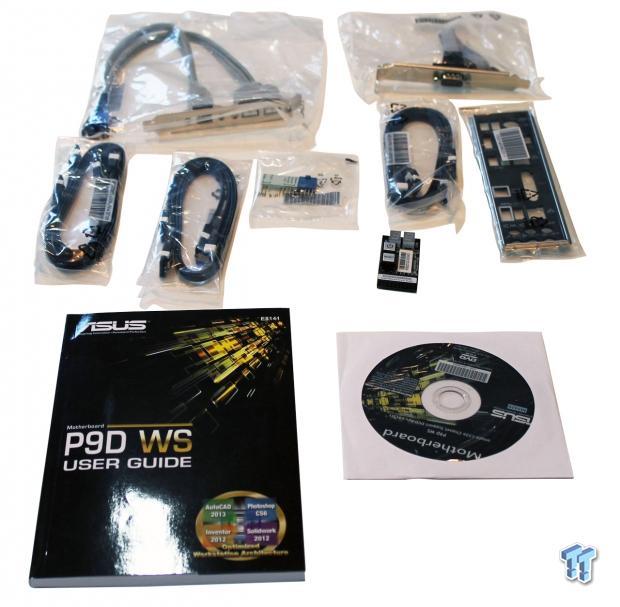
Accessories included with the P9D WS are:
Rear I/O Back Plate
3x bags of SATA cables (6 cables total)
1x USB 2.0 and IEEE 1394 Bracket
1x Serial/COM Bracket
1x G.P Diagnosis Card
USB and Front Panel Header Block
User Manual
Driver Disk
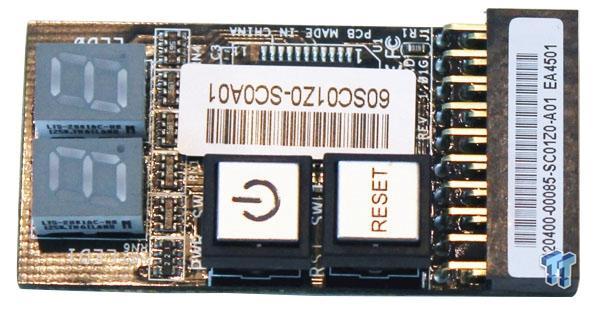
This is the G.P Diagnosis card; we really like that it is included in the package. These are very useful when running in bench mode, and not installed in a case, or it can be used to diagnosis problems with a system by reading the codes on the LED's, to help figure out what problems a system may be having.
Specifications
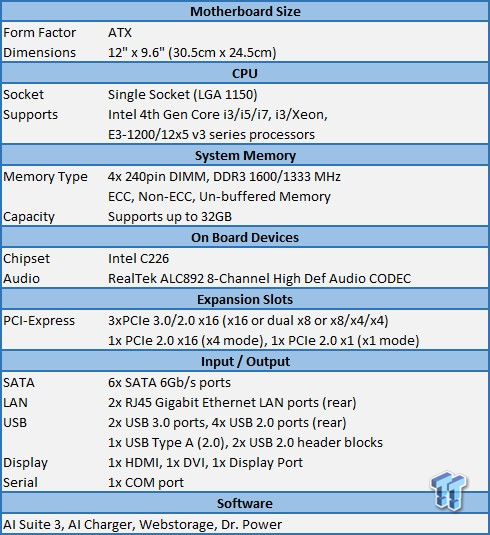
The specifications for this motherboard offer plenty of I/O options, with 6x SATA ports, 3x PCIe slots, and 6x USB ports.
Layout
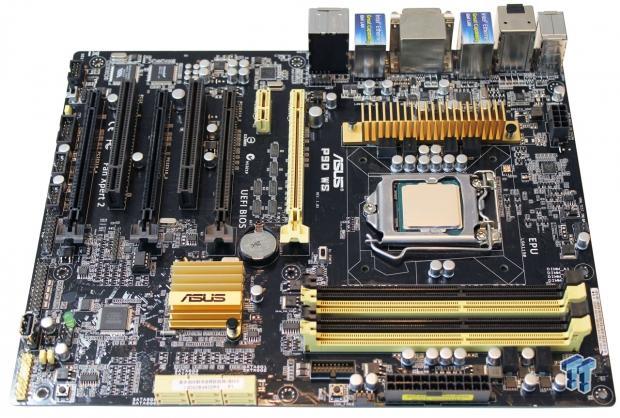
Layout of the P9D WS is typical of ATX motherboards; everything is as it should be, with no surprises. We see nothing that would stick out and block airflow.
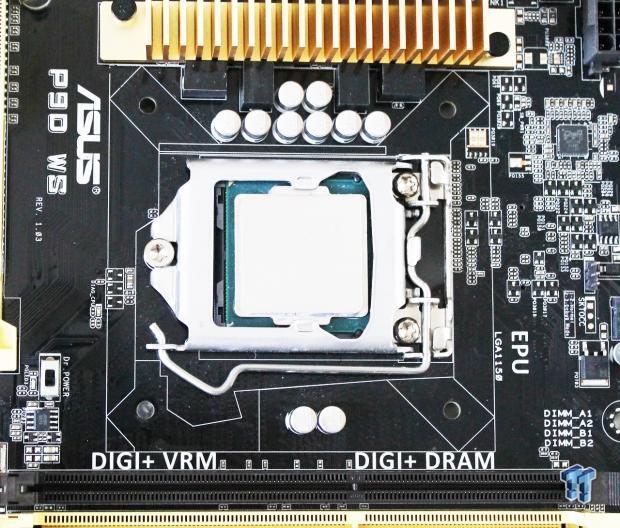
Typical layout of the CPU socket area for the new Intel CPU's; it is very clean, and there are not a lot of components in this area. This helps everything run nice and cool with good airflow.

The rear I/O area has the usual supplied connections. We also see the USB BIOS Flashback button under the DVI connector.
To use the USB BIOS Flashback button, first insert a USB storage device into the USB Flashback port on the motherboard. Launch the USB Flashback Wizard will automatically download the latest BIOS. Press and hold the USB Flashback button for three seconds or until a flashing light appears. Finally, wait until the light goes out, and the update has completed.
The onboard Intel i210 chipset supports the two RJ-45 network connectors. These also support teaming, and are certified by VMware to support virtualization.
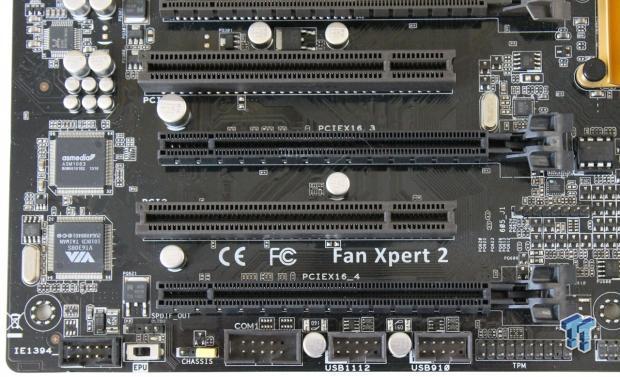
Connectors on the left side of the motherboard are clear as to their function, with easy to read labels.
When the EPU switch is set to enable, it will monitor system loading, and moderate the power consumption. This is set to disable by default.
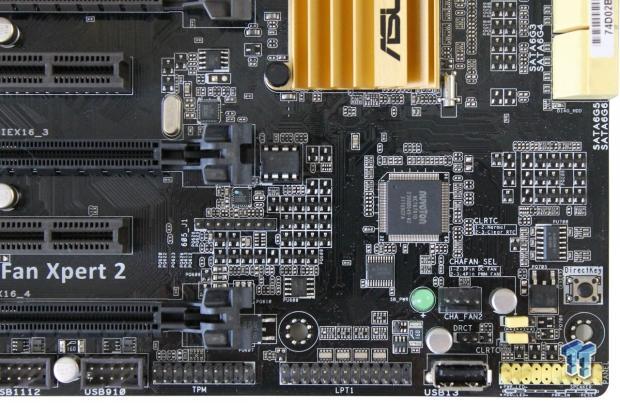
The lower left side of the motherboard again shows clean and easy to read connector labels.
Just above the mounting hole, we see the Directkey button that allows you to go right to the BIOS setup program anytime, without pressing the Delete key during post. This button also acts like a power on/off button.
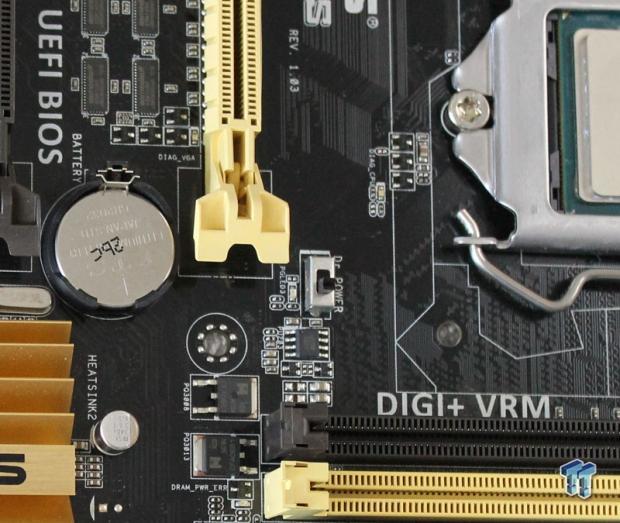
Near the first PCIe slot, we see the Dr. Power switch, which enables/disables the Dr. Power Utility.
BIOS
Finally, we find a workstation motherboard with UEFI BIOS screens. This is a nice addition to this motherboard.
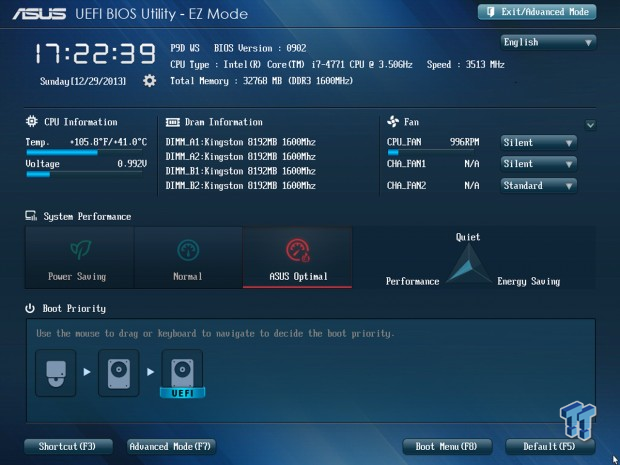
When you press the delete key during post, you start out with the EZ Mode screen. The key feature here is that it allows you to set System Performance with one click, depending on your system needs.
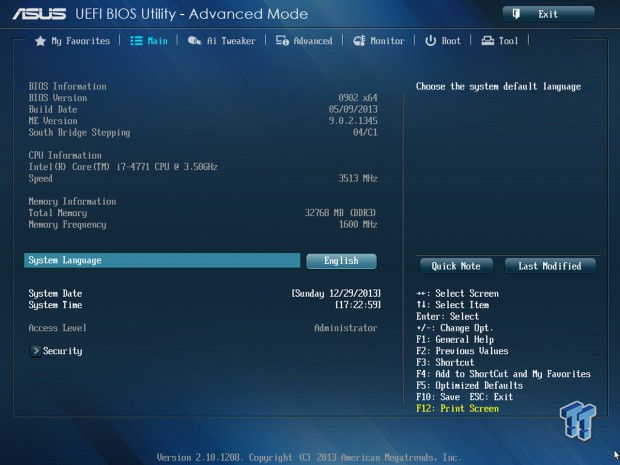
Pressing the Advanced button brings you to the main Advanced screen.
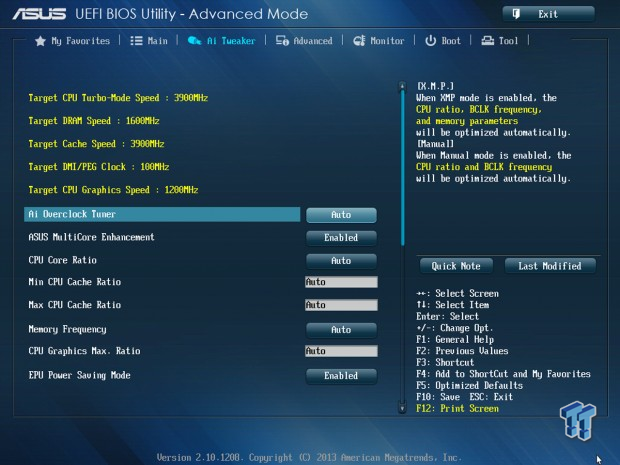
The AI-Tweaker screen allows you to set overclocking features.
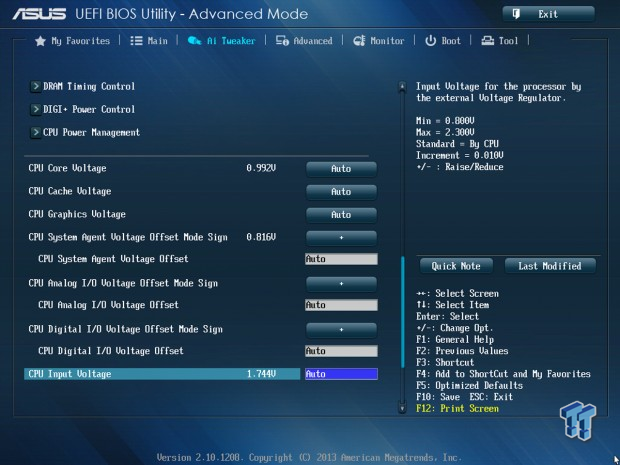
This is the second part of the AI-Tweaker configuration tab.
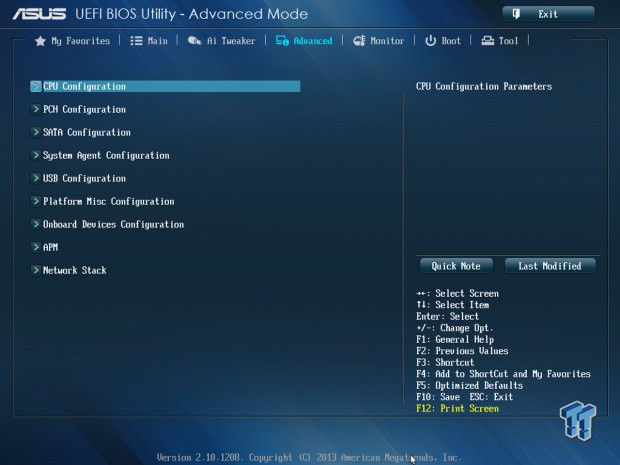
Here we see the Advanced tab settings.
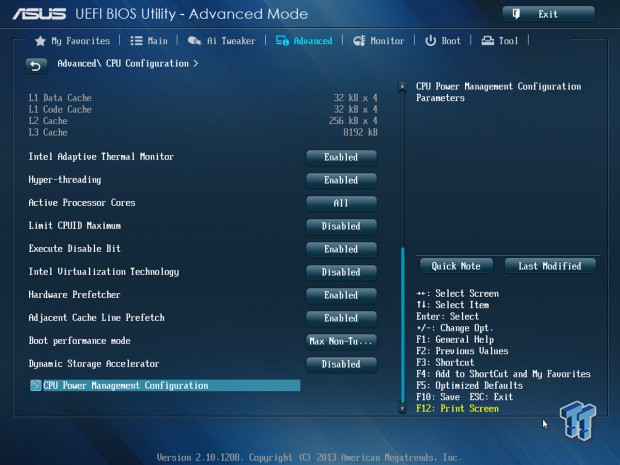
Here we find the CPU Configuration tab, and settings that you can adjust.
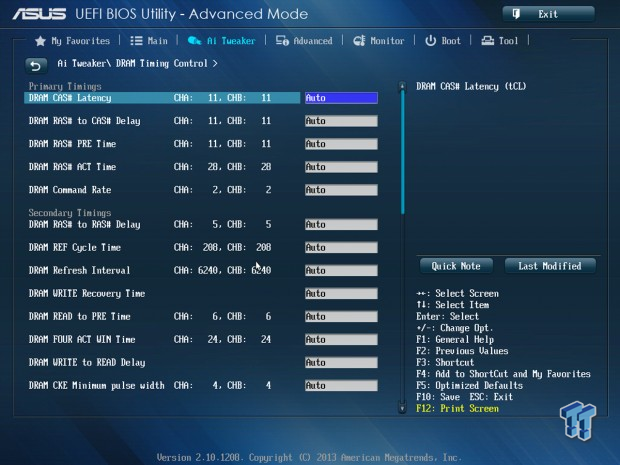
Here we find the DRAM Timing control tab.
Software
The ASUS P9D WS comes supplied with ASUS AI Suite 3, which allows you to control various system settings from the desktop.
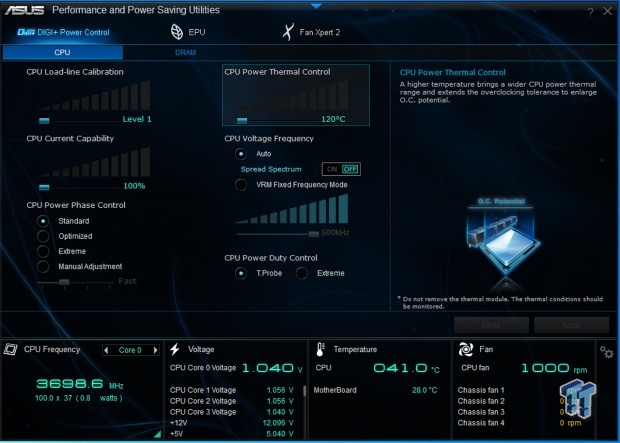
Here we see the main screen for CPU settings, which shows frequency, voltage, temperature, and fan speeds, and allows you to change different aspects of the CPU.
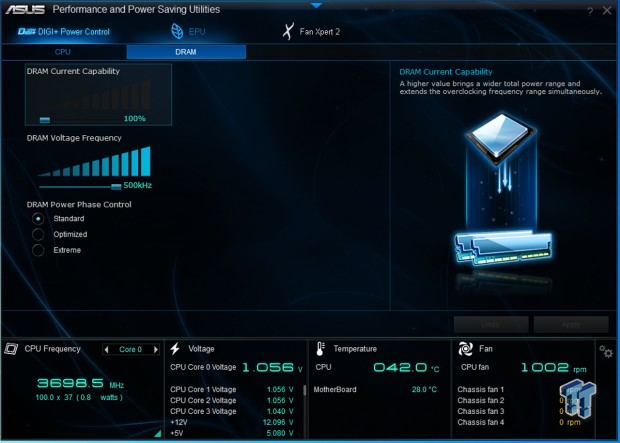
Here is the DRAM control page.
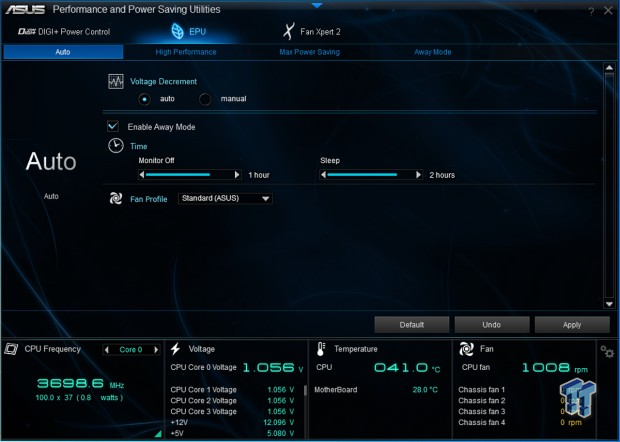
Here is the EPU screen, where you can change power saving features.
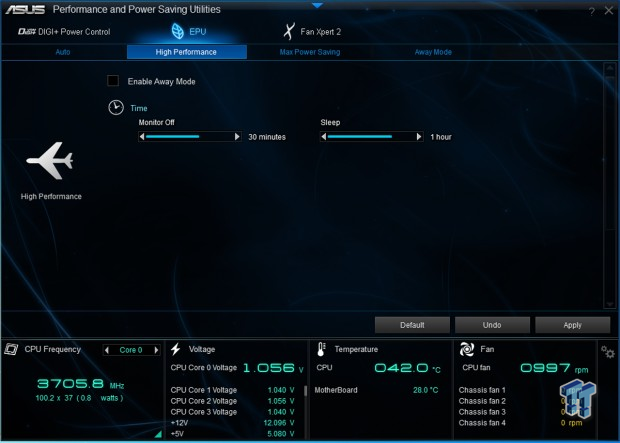
Here we see the High Performance tab for EPU settings.
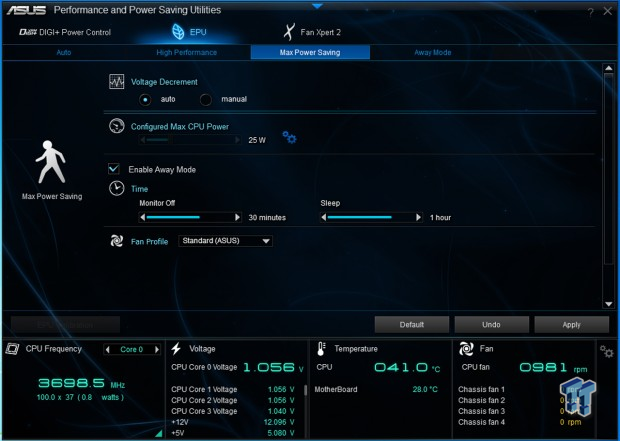
Next is the Max Power Saving tab.
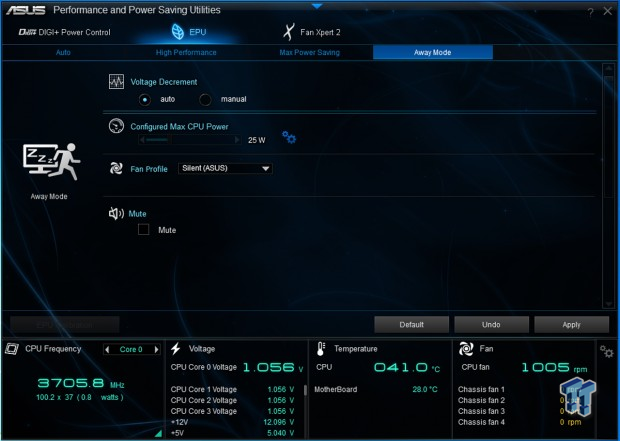
The last tab for the EPU section is the Away Mode screen.
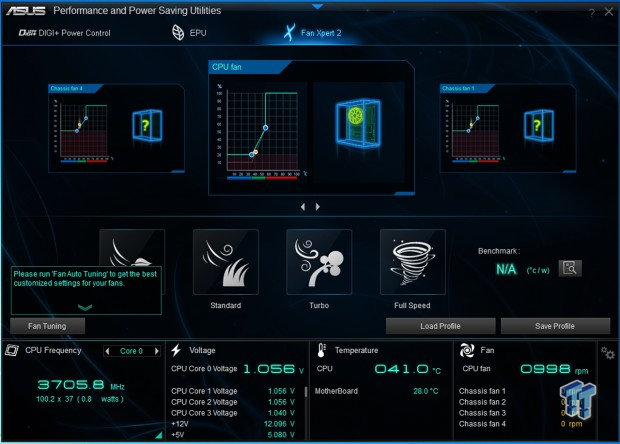
The last screen for the AI Suite 3 is Fan Xpert 2, which allows you to change the fan modes.
Test System Setup
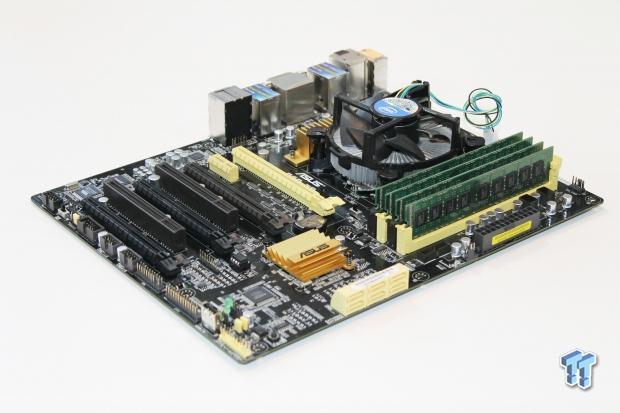
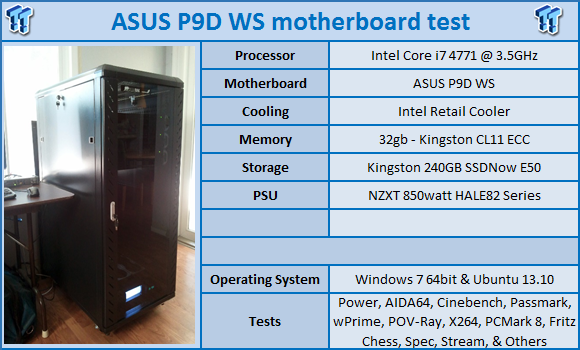
Special thanks to ASUS, NZXT, and Kingston for their support!
The test setup is typical for a workstation setup. The power supply used in these test is much higher wattage than needed for these tests.
The CPU used in these tests is an Intel Core i7 4771 @ 3.5GHz. We also showed a Xeon processor E3-1285 v3 (8M cache and 3.60GHz) to use as a comparison in performance. The memory installed is 32 GB of Kingston CL11 1600MHz ECC RAM.
For all tests that we ran, we used optimized BIOS settings for performance.
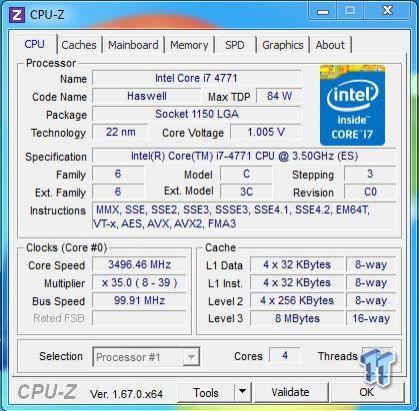
This is the CPUz screen showing the various stats of the i7 4771. As you can see, this CPU has a Max TDP of 84 watts, and core voltage of 1.005V, which means this CPU runs nice and cool under low voltage.
In some of our tests that use graphics, we used a 690gtx that we had in the lab.
System Benchmarks
PCMark 8
PCMark 8 is the latest version in the series of PC benchmarking tools by Futuremark. It is fully compatible with Windows 8, and can be run under Windows 7.
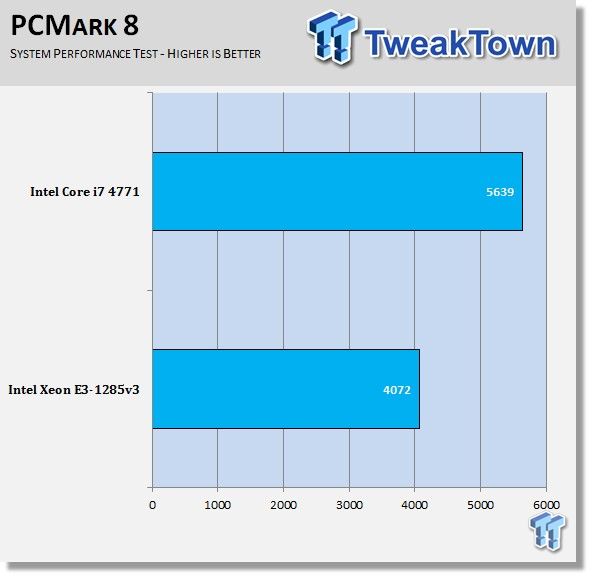
Just like in previous tests that we did with these two CPU's, we find the results will be very close to those tests. You can see in the PCMark 8 tests that both the i7 4771 and E3-1285v3 are very close in performance, with the i7 4771 getting slightly better results on the P9D WS. We used a 690gtx that we had in the lab to run this test, which explains the increase in points on this test.
These two CPU's are very close in specifications with only 100MHz different in stock and turbo speeds.
Passmark8
PassMark performance test runs 32 tests including CPU, 2D & 3D graphics, disk, and memory tests, to come up with an overall system ranking that allows you to determine how fast your computer is in comparison with other systems.
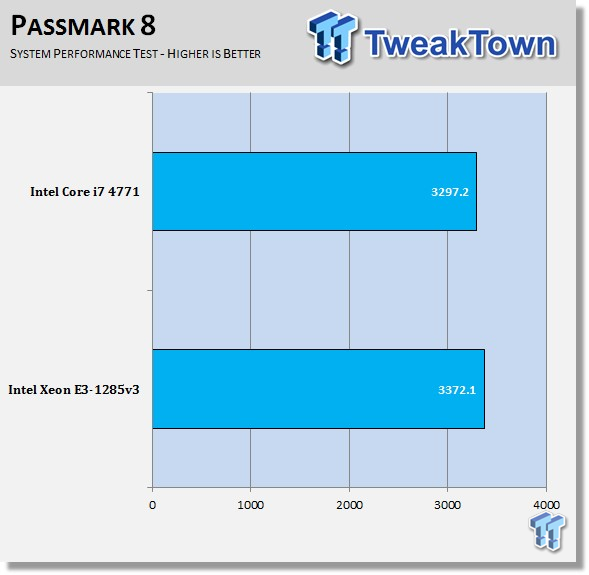
Here we see only a slight difference between these two CPU's, which is something that will be common in the rest of the tests.
CPU Benchmarks
Cinebench 11.5
CINEBENCH is a real-world cross platform test suite that evaluates your computer's performance capabilities. The test scenario uses all of your system's processing power to render a photorealistic 3D scene. This scene makes use of various different algorithms to stress all available processor cores. You can also run this test with a single core mode to give a single core rating.
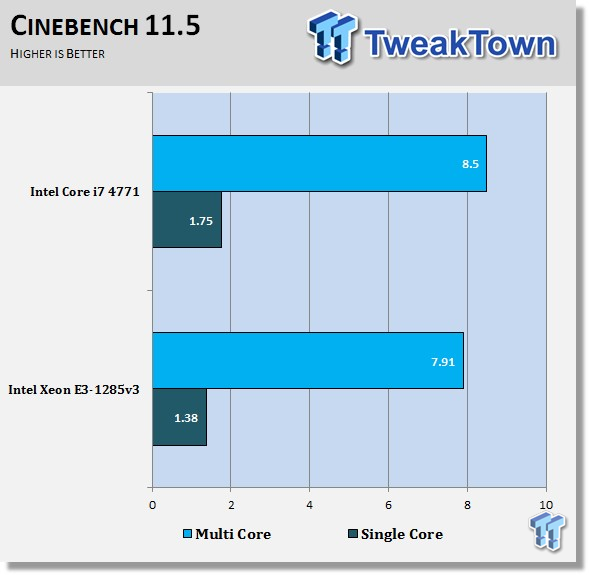
We find very close results, but with a slightly better score with the i7-4771.
Cinebench R15
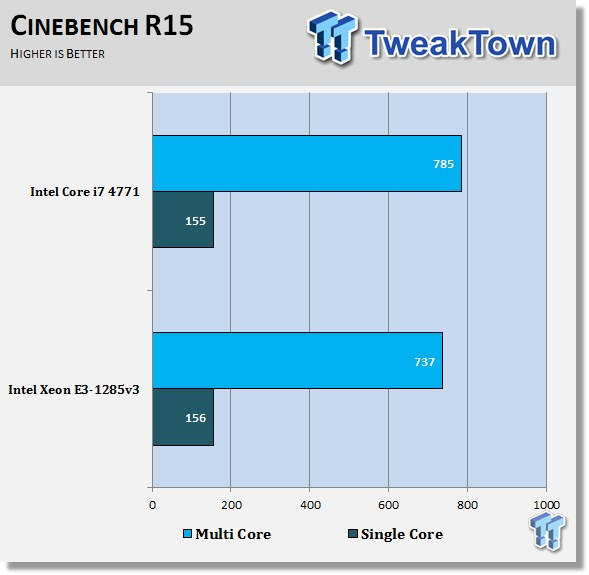
Again, we find very close results, but with a slightly better score with the i7-4771.
wPrime
wPrime is a leading multithreaded benchmark for x86 processors that tests your processor performance. This is a great test to use to rate the system speed; it also works as a stress test to see how well the system cooling is performing.
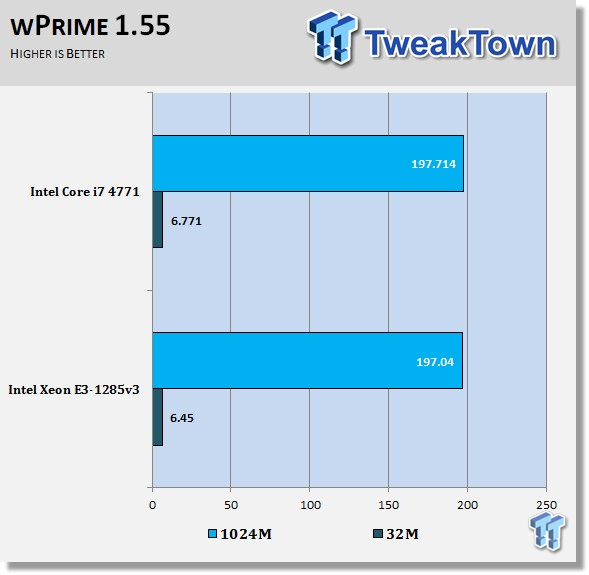
This is a very good test, and you can see that these CPUs perform very well.
POV-Ray
POV-Ray (Persistence of Vision Ray-Tracer) creates three-dimensional, photo-realistic images using a rendering technique called ray tracing. Ray tracing is not a fast process by any means, but it produces very high quality images with realistic reflections, shading, perspective, and other effects.
This is a very good test to stress CPU threads, and check memory stability and overclocks to see if the system is stable. The latest version (3.6) is a free download, and has a benchmark utility that we have run for these tests. Results are displayed showing the average PPS (pixels per second) that the render took.
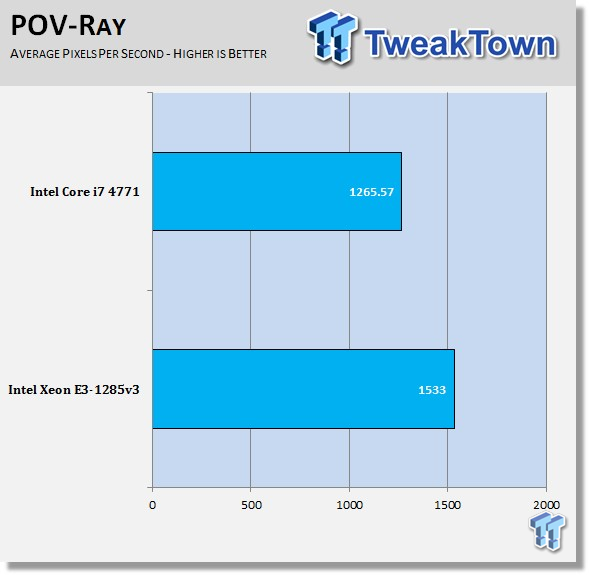
Just a very slight difference in results here that shows for the POV-Ray test results; there are almost no difference in CPU's.
x264 HD
X264 HD Benchmark measures how fast your computer can encode a 1080p video clip into a high quality x264 video file. This benchmark uses multi-core/threaded systems very efficiently, and is a good memory stability test.
Results in this test are the average of each pass performed four times.
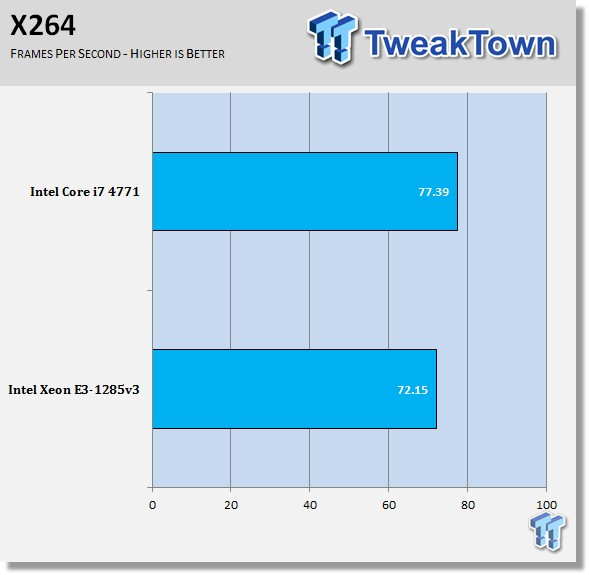
Again, we see just a very slight difference in results between the two CPU's.
Memory Benchmarks
AIDA64
AIDA64 memory bandwidth benchmarks (Memory Read, Memory Write, and Memory Copy) measure the maximum achievable memory data transfer bandwidth.
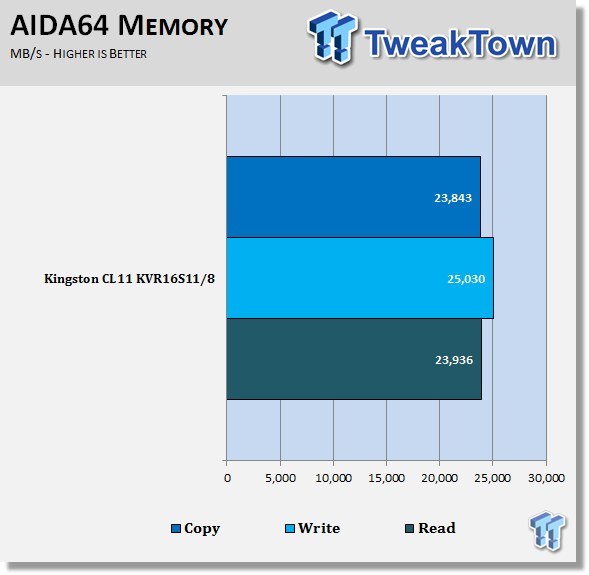
AIDA64 memory tests show the Kingston CL11 1600MHz ECC RAM kits perform very well.
Stream Memory
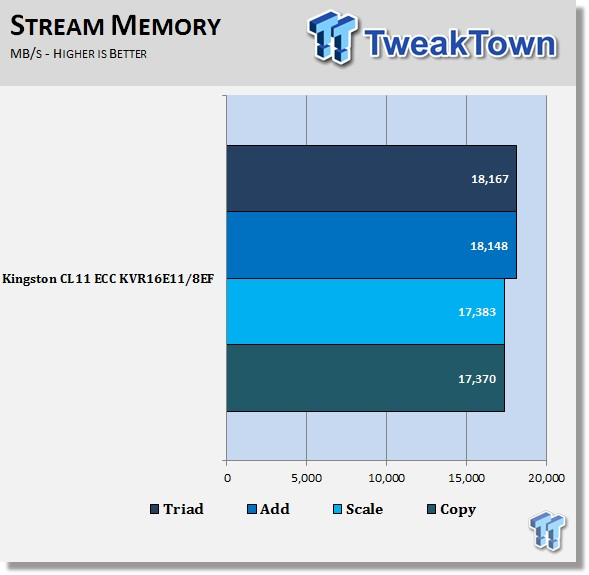
Stream is a memory test that measures sustainable memory bandwidth and the corresponding computational rate for vector operations.
LinX
LinX 0.6.4 is a CPU benchmark that measures floating-point operations per second, and is used to compare CPU performance; it is also a very good stress test to run.
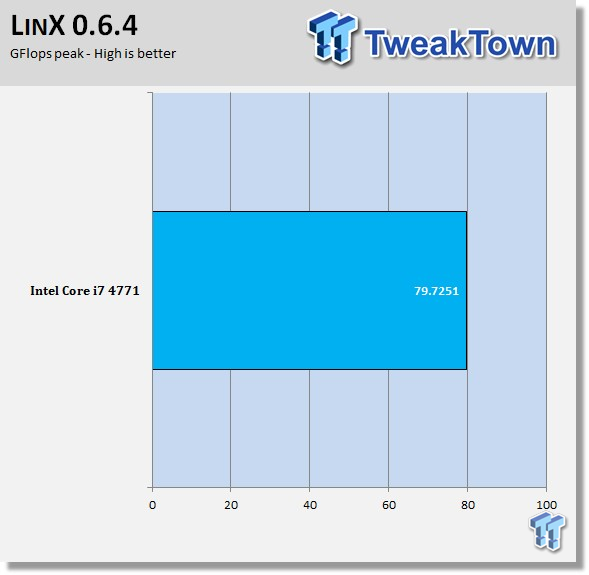
A score of 79.7 GFlops is very good for a system like this, and shows that even in a number crunching setup, this board stands up to full size systems using the same CPU.
UnixBench 5.1.3
UnixBench has been around for a long time now, and is a good general-purpose bench to test on Linux based systems.
This is a system benchmark, and it shows the performance of single threaded and multi-threaded tasks.
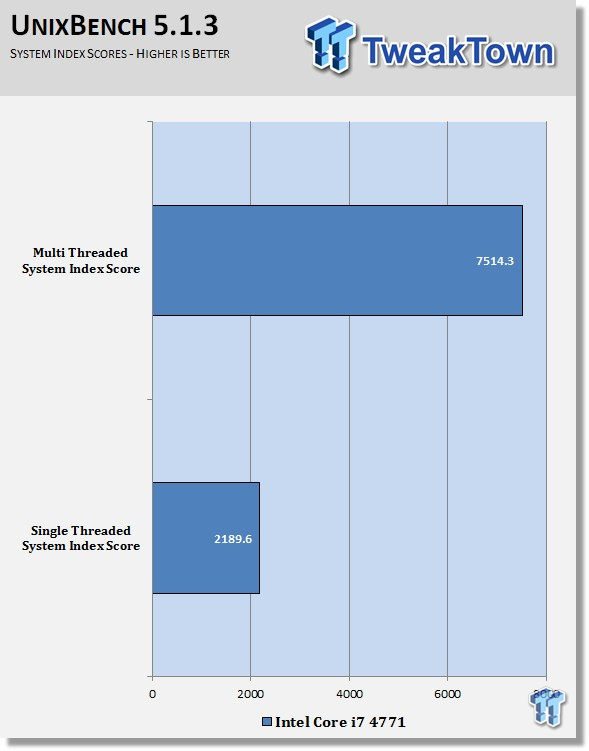
This shows the system indexes after a complete UnixBench run. Here, we get an idea of how much performance gains we get using multi-threaded applications. However, many applications use single threaded, so this number is really the base, and a higher clock speed will increase both indexes.
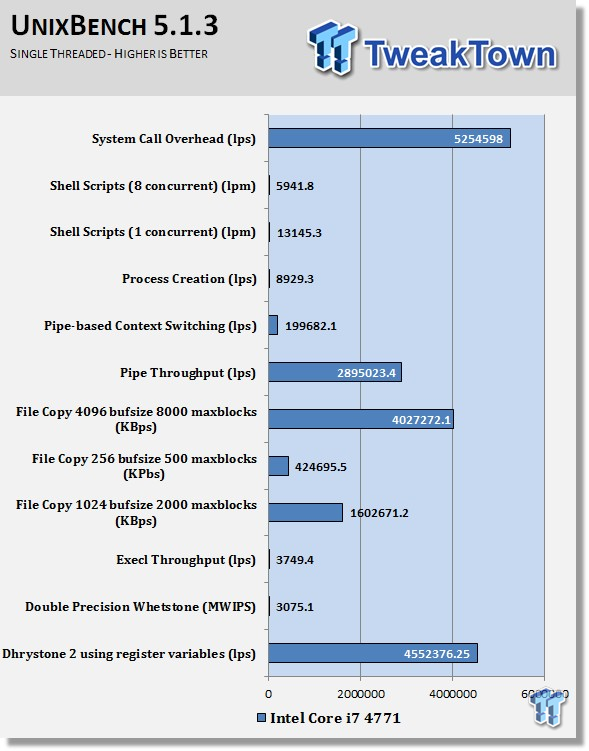
The single threaded test shows the performance of a single core. With these types of tests, CPU architecture and speed are the basis of the score. A higher clock speed will increase these scores, and have a greater impact on the results.
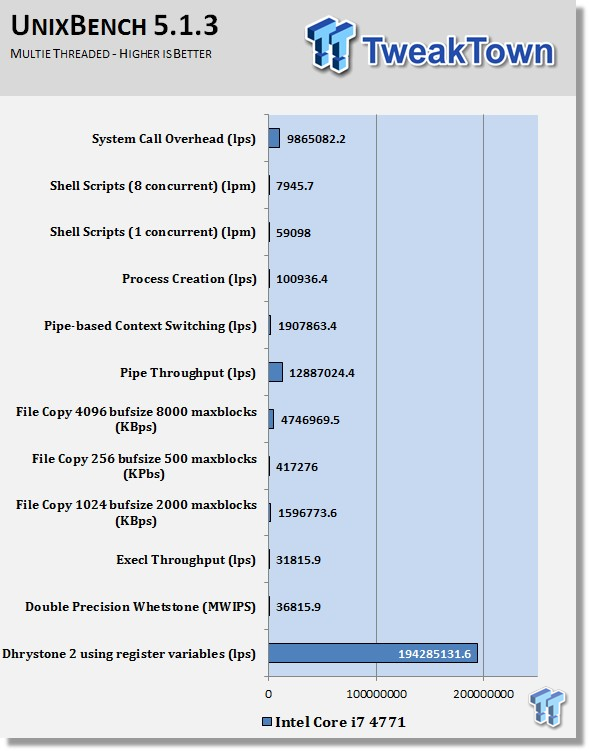
The multi-threaded test uses all eight threads of the Intel 4771. In this test, more cores/threads will have a greater impact on the results.
SPECwpc_v1.0.2
SPECwpc_v1.0.2 is a workstation benchmark that measures key aspects of workstation applications.
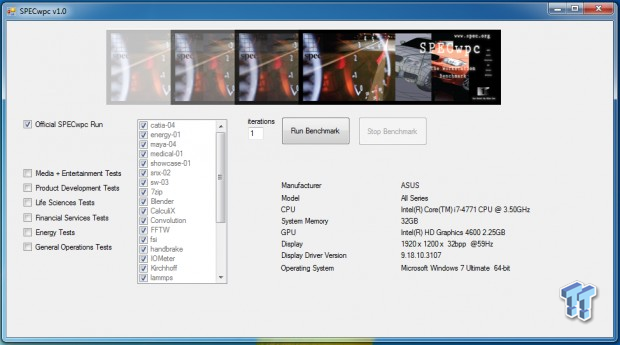
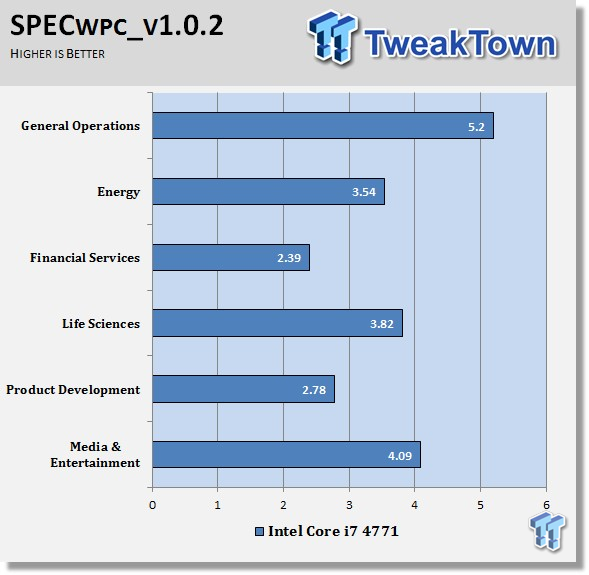
In these tests, we used a 690gtx that we had in the lab for the graphics tests. The Intel 4771 does perform very well for this entry-level platform.
These tests do put a huge load on the system, and take about eight hours to run on this system. This was the first time that an application spun the fans up to 100% on the 690gtx in the lab, which shows SPECwpc puts a heavy load on the GPU.
SPEC CPU2006v1.2
SPEC CPU2006v1.2 measures compute intensive performance across the system using realistic benchmarks to rate real performance.
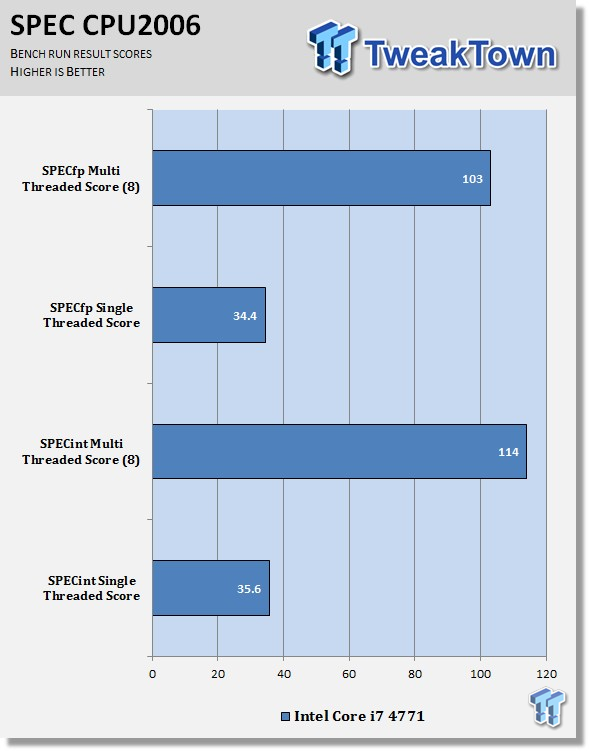
This benchmark has many different commands to use depending on what the user is looking for. For our tests, we used basic commands that run a full test.
Here, you can see the SPEC scores after full runs for Integer (int) and Floating Point (fp) tests.
Single core runs show how fast (speed) a CPU can perform a given task. In the multi-core runs, we set SPEC CPU2006v1.2 to use all threads, and this is a measure of the throughput of the system.
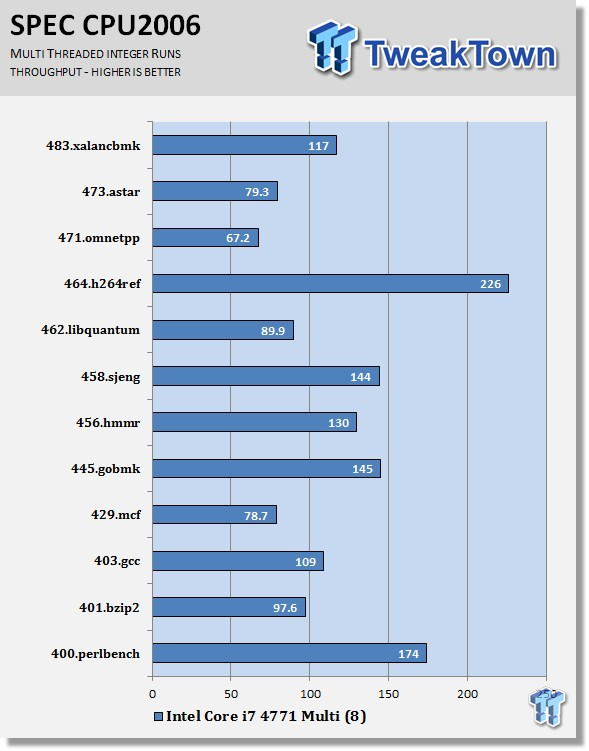
Looking at the results of single threaded integer runs, we can get an idea of speed at which the Intel 4771 can crunch through the different integer tests. Not all CPU's are equal here, and ones that have a higher speed will perform these tests faster. In this case, this is the stock speed of the Intel 4771 with turbo on. Naturally, using an overclocked system will generate higher results.
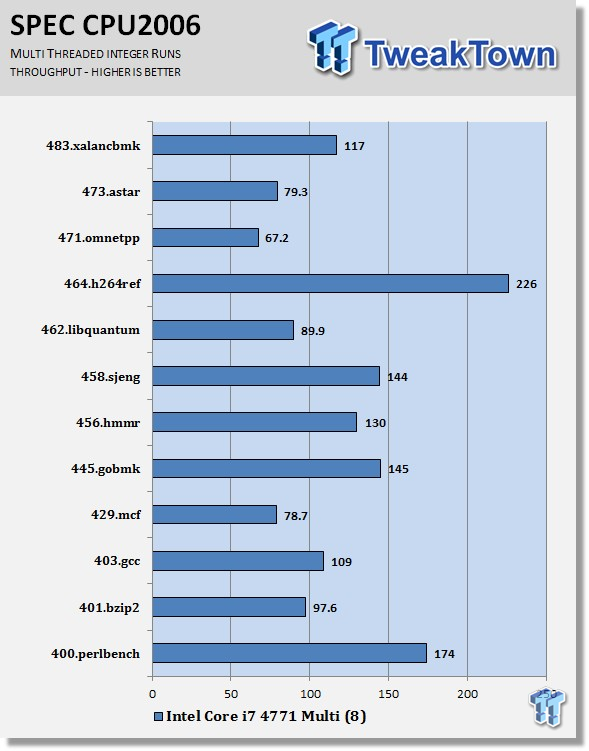
Now we run the test using all eight threads of the Intel 4771, to measure the throughput of the system. In this test, more cores/threads will have a greater effect on the outcome.
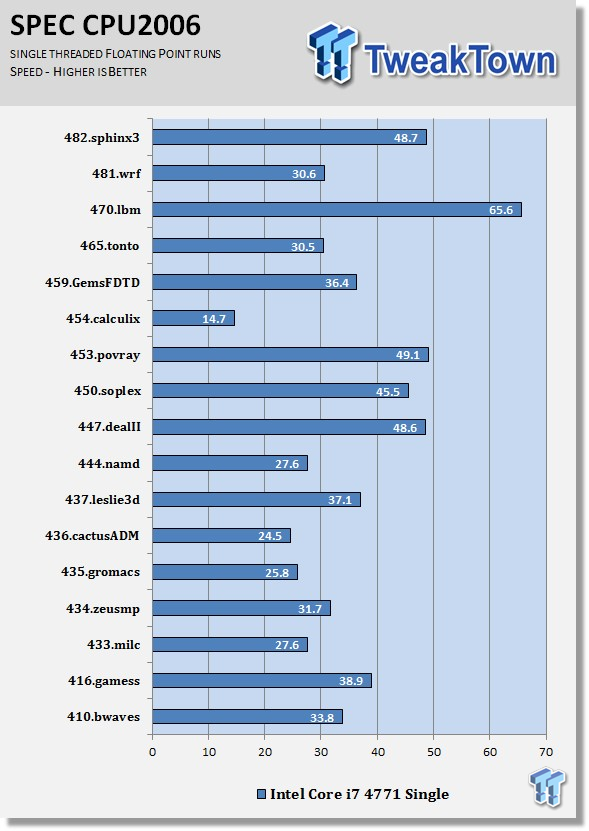
Just like the integer tests, we now run the floating-point tests in single (speed) mode.
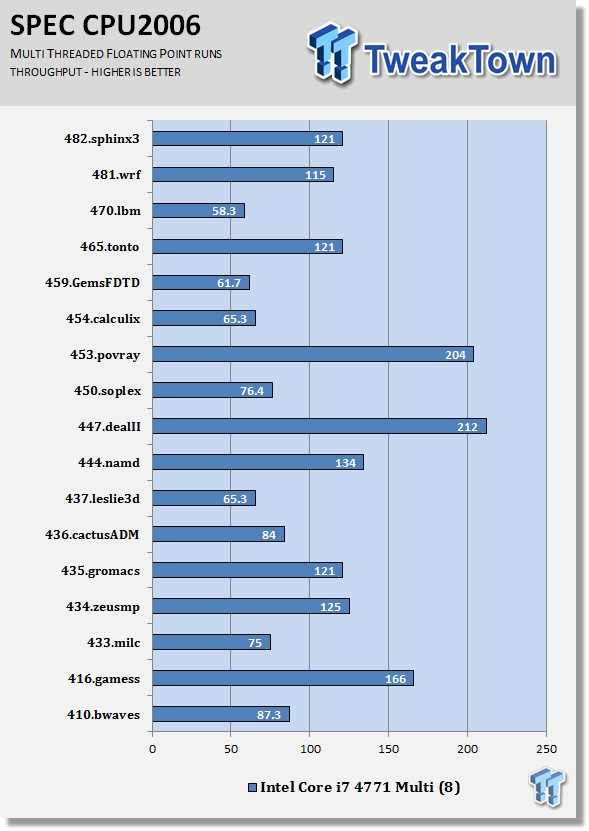
Here, we see the results of the multi-threaded floating-point run that uses all eight threads of the Intel 4771. Like the multi-threaded integer test, more cores/threads will have a greater impact on the test.
Power Consumption
We used the WattsUp? Pro meter in these tests, which allowed us to measure power use directly from the wall. This meter also uses a USB cable to connect to a computer, and Logger Pro software to graph the readings while we run our tests.
To test total system power use, we used AIDA64 Stability test to load the CPU, and then recorded the results.
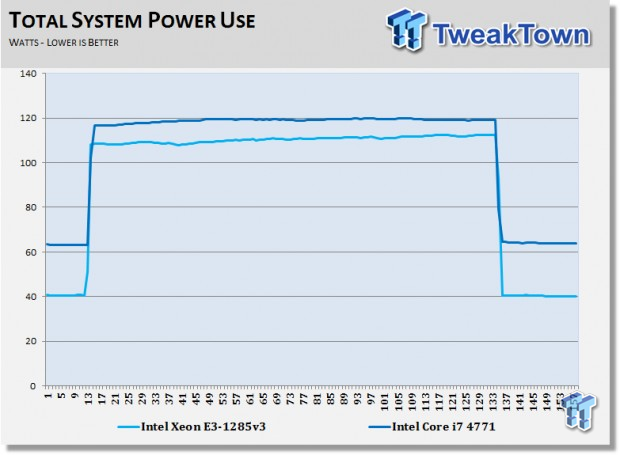
Here, we can see the results of our power tests, with the Xeon E3-1285v3 showing the lowest power use. There is about 20 watts difference between the two at idle.
Final Thoughts
We ran the ASUS P9D WS in the lab for over a week under all kinds of different tests conditions, and it's been a rock as far as stability is concerned.
The new tests that we have started using put extreme loads on the system for extended periods of time, and the P9D WS handled this with no problems. It stayed nice and cool, even with the stock Intel CPU cooler, so there is no need really to install higher-end coolers on a system like this.
We have used the Intel 4771 on several motherboards here in the lab, and found the test results to be on par with the others. What sets this board apart from the others is the UEFI BIOS, which is a nice improvement over the others that still use the Award BIOS. It makes simple things like booting into the BIOS, clicking optimized for performance, and clicking F10 to save and reboot, very easy to do.
The motherboard itself is very clean, and has easy to read labels for all the connection headers, which makes setup a breeze.
We found the supplied software, AI Suite 3, to work very well at adjusting the different system settings. It also gives the ability to check on system temperatures, to make sure the system is running nice and cool. This is useful at first, but after the system is setup and running, you might not ever check it again; however, it is nice to have it just in case.
Dr. Power is also very nice to have; it will alert you in the middle of a long run if your power supply starts giving you issues. If you use a power supply that is very close in rating to what your max power load would be, this might come in handy; but nowadays, installing a higher rated power supply is not uncommon, unless you are trying to save money on build costs.
ASUS offers a limited warranty period of three years through the ASUS website. At the time of writing, the price of the P9D WS was $234.45, which is a good price, compared to other workstation motherboards in this class. Check below for up to date pricing.
PRICING: You can find the ASUS P9D WS Motherboard for sale below. The prices listed are valid at the time of writing, but can change at any time. Click the link to see the very latest pricing for the best deal.
United States: The ASUS P9D WS Motherboard retails for $234.49 at Amazon.

