


Our Verdict
Introduction
The bulk of Samsung's enterprise SSD offerings focused on the OEM space in the past. Samsung has recently begun to open up their product line to the broader retail market with the release of the 845DC PRO and the 845DC EVO. Both of these SSDs utilize new NAND technologies, 3D V-NAND and 3-bit MLC respectively, that offer tangible benefits for their respective target environments.
While the new products sport the latest in NAND technology, the 843 series from Samsung features their tried-and-true 21nm Toggle MLC NAND. The SM843 (reviewed here) is geared for lighter read-centric workloads with 20-30% read/write distributions. The SM843T we are testing today offers robust endurance for workloads with 40-50% read/write distributions. The SM843T expands write endurance up to 1.8 DWPD, an increase over the 1 DWPD provided by the SM843. The SM843T offers up 1,930 TBW of endurance for the 480GB model, and 3,680 TBW for the 960 GB capacity.
Another differentiator between the two models is the inclusion of Power-Loss Protection (PLP). Power-loss protection in the Samsung SM843T is provided by tantalum capacitors, and Samsung's Sudden Power Off and Recovery (SPOR) technology.
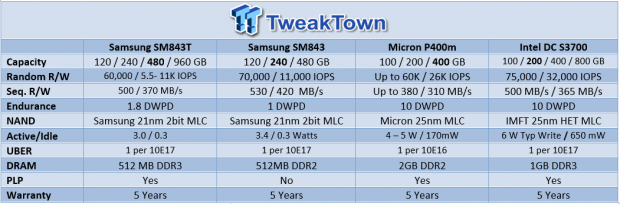
The SM843T comes in 2.5 and 1.8" form factors in 120, 240, 480, and 960 GB capacities. The SM843T sports 4k random read speeds of 60,000 IOPS, and 11,000 IOPS for 4k random write. Sequential read is impressive at 500 MB/s, and sequential write speed weighs in at 370 MB/s.
The SM843T also offers up an endurance increase of up to 5.4 DWPD when overprovisioning the drive to a useable capacity of 100, 200, 400, or 800 GB. This is helpful for users who wish to sacrifice capacity to increase endurance. Samsung also lists an increased 4k random write speed of up to 35,000 IOPS when using the same overprovisioning levels that increase endurance. Providing these specific guidelines for overprovisioning is helpful, and we would like to see other manufacturers follow suit.
The SSD features a slim 7.5mm chassis, and leverages the three-core MDX controller and 512MB of DDR2 SDRAM. Samsung produces all of the components, which can be a considerable advantage in many aspects. The SM843T features an UBER rating of one per 10E17, and a two-million hour MTBF. The SM843T also offers AES-256 encryption for the security conscious.
The SM843Tn is currently supplanting the SM843T. The SM843Tn is a newer model with a die revision and similar performance and endurance specifications. The SM843Tn series will not feature a 960GB capacity point. The SM843T will provide the 960 GB model in the near term. The 3D V-NAND SV843 will supplant the 960 GB SM843Tn in the future.
Our Latest SSD Review Coverage
- Micron 6600 ION 245.76TB Enterprise SSD Review - Best in Class Programming Speeds
- Memblaze PBlaze 7 7A40 Ocean 61.44TB Enterprise SSD Review - Oceans of QLC at 3.3 million IOPS
- KIOXIA CD9P-R 7.68TB E3.S Review - The Best-In-Class Data Center SSD
- DapuStor Roealsen6 R6060 E1.L 245.76TB SSD Review - Massive Capacity with Fast Retrieval
- Phison Pascari X200P 7.68TB Enterprise SSD Review - Sequential Read Champion
All of the aforementioned features are rounded off with a five-year warranty. One of Samsung's big focuses with the SM843T is on performance consistency, and it shines through in our performance testing. Let's take a closer look.
Samsung SM843T Internals and Specifications
Samsung SM843T Internals


The Samsung SM843T comes in the 2.5" and 1.8" form factor with a 7.2mm z-height, and the traditionally spartan Samsung livery.
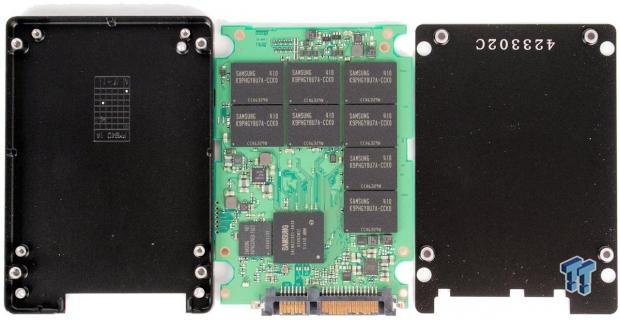
The construction of the SM843T is fairly simple, with no thermal pads. The PCB is held within the case by an additional four fasteners.


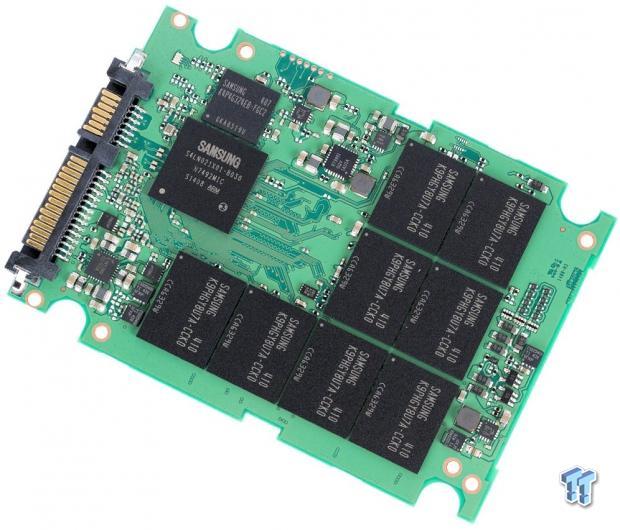
The 480GB SM843T features 8 x 21nm 64Gb MLC packages. The rear of the PCB is bare, with the exception of the tantalum capacitors used for host power-loss protection.
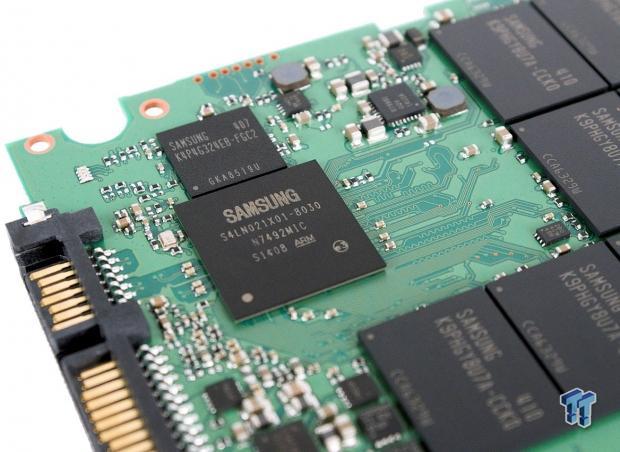
The tri-core S4LN021X01-8030 MDX controller powers the SSD, and is flanked by a 512MB package of DDR2 SDRAM.
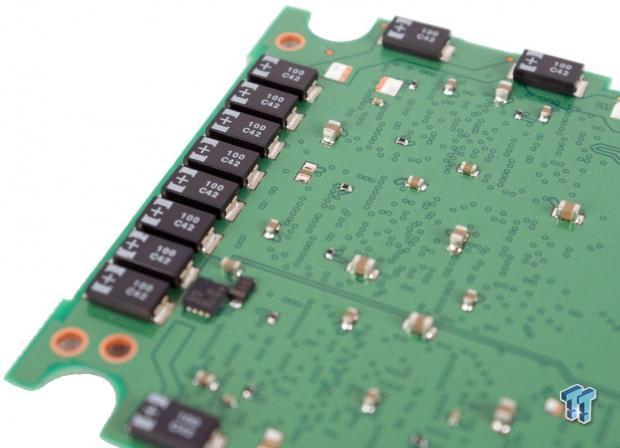
The robust power fail system comes via the Tantalum capacitors and SPOR (Sudden Power Off and Recovery) firmware enhancements.
Samsung SM843T Specifications

The SM843T is listed with the MZ7WD480HAGM-00003 part number.
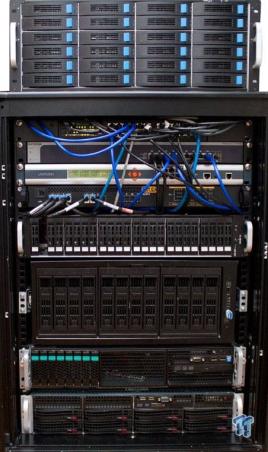
Test System and Methodology

Our approach to storage testing targets long-term performance with a high level of granularity. Many testing methods record peak and average measurements during the test period. These average values give a basic understanding of performance, but fall short in providing the clearest view possible of I/O QoS (Quality of Service).
While under load, all storage solutions deliver variable levels of performance. "Average" results do little to indicate performance variability experienced during actual deployment. The degree of variability is especially pertinent, as many applications can hang or lag as they wait for I/O requests to complete. While this fluctuation is normal, the degree of variability is what separates enterprise storage solutions from typical client-side hardware.
Providing ongoing measurements from our workloads with one-second reporting intervals illustrates product differentiation in relation to I/O QoS. Scatter charts give readers a basic understanding of I/O latency distribution without directly observing numerous graphs. This testing methodology illustrates performance variability, and includes average measurements during the measurement window.
IOPS data that ignores latency is useless. Consistent latency is the goal of every storage solution, and measurements such as Maximum Latency only illuminate the single longest I/O received during testing. This can be misleading, as a single "outlying I/O" can skew the view of an otherwise superb solution. Standard Deviation measurements consider latency distribution, but do not always effectively illustrate I/O distribution with enough granularity to provide a clear picture of system performance. We utilize high-granularity I/O latency charts to illuminate performance during our test runs.
Our testing regimen follows SNIA principles to ensure consistent, repeatable testing, and utilizes multi-threaded workloads found in typical production environments. We measure power consumption during precondition runs. This provides measurements in time-based fashion, with results every second, to illuminate the behavior of power consumption in steady state conditions. We also present IOPS-to-Watts measurements to highlight efficiency.
The SSDs in the test pool feature the following capacities: Intel DC S3700 is 200GB, the SM843 is 240GB, the Micron P400m is 400GB, and the Samsung SM843T is 480GB. The SSDs are tested over their full LBA range to highlight performance at maximum utilization. The first page of results will provide the "key" to understanding and interpreting our test methodology.
Benchmarks - 4k Random Read/Write
4k Random Read/Write
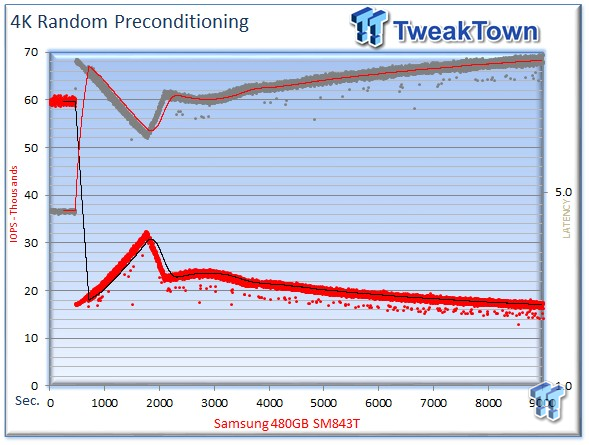
We precondition the 480GB Samsung SM843T for 9,000 seconds, or two and a half hours, receiving performance reports every second. We plot this data to illustrate the drives' descent into steady state.
This dual-axis chart consists of 18,000 data points, with the IOPS on the left, and the latency on the right. The red dots signify IOPS, and the grey dots are latency measurements during the test. We place latency data in a logarithmic scale to bring it into comparison range. The lines through the data scatter are the average during the test. This type of testing presents standard deviation and maximum/minimum I/O in a visual manner.
Note that the IOPS and latency figures are nearly mirror images of each other. This illustrated high-granularity testing can give our readers a good feel for latency distribution by viewing IOPS at one-second intervals. This should be in mind when viewing our test results below. This downward slope of performance only occurs during the first few hours of use, and we present precondition results only to confirm steady state convergence.
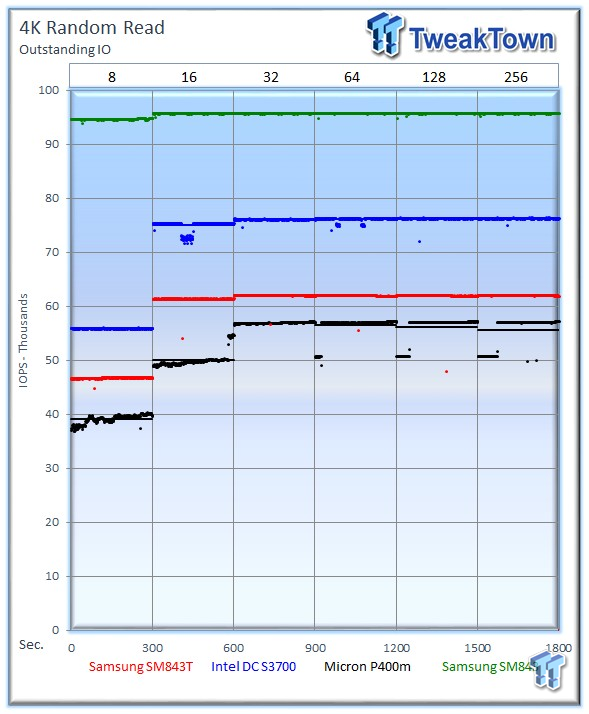
Each level tested includes 300 data points (five minutes of one second reports) to illustrate performance variability. The line for each OIO depth represents the average speed reported during the five-minute interval. 4k random speed measurements are an important metric when comparing drive performance, as the hardest type of file access for any storage solution to master is small-file random. 4k random performance is a heavily marketed figure, and one of the most sought-after performance specifications.
The Samsung SM843T averages 62,015 IOPS at 256 OIO (Outstanding I/O). The Samsung SM843 leads the chart with 95,815 IOPS. The Micron P400m averages 55,530 IOPS, and the Intel DC S3700 averages 76,301 IOPS. The SM843 is much faster than its high-endurance counterpart at random read.


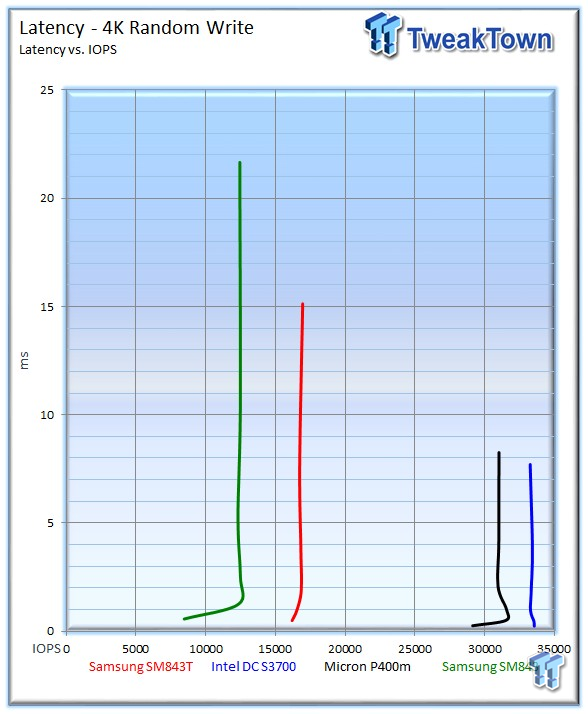
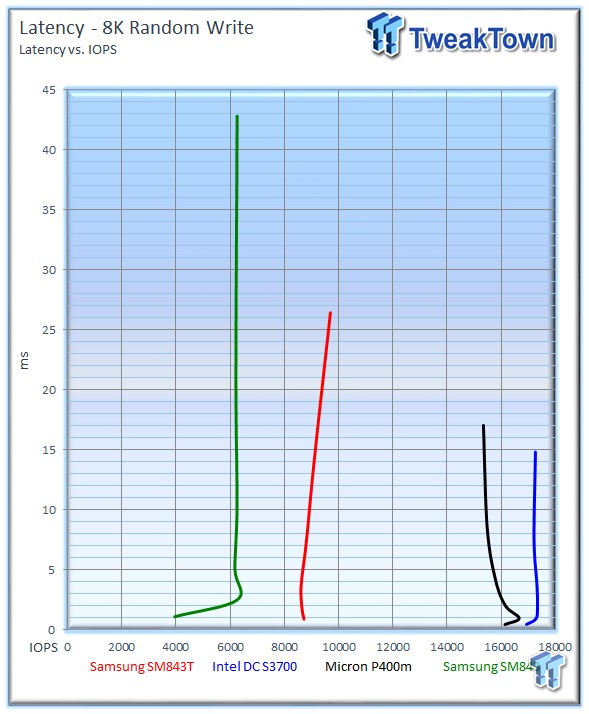
Our Latency vs IOPS charts compare the amount of performance attained from each solution at specific latency measurements. Many applications have specific latency requirements. These charts present relevant metrics in an easy-to-read manner for readers who are familiar with their application requirements.
The SM843T provides nearly 62,000 IOPS at .1ms; the SM843 delivers 96,000 IOPS; the DC S3700 provides 76,000 IOPS; and the P400m provides 57,000 IOPS.

Garbage collection routines in heavy write workloads are more pronounced, leading to performance variability.
The SM843T averages 16,950 IOPS at 256 OIO; the P400M averages 31,026 IOPS; the SM843 averages 12,432 IOPS; and the Intel DC S3700 with 33,841 IOPS. The original SM843 is very speedy with pure random read workloads, but doesn't fare as well in heavy write workloads. The SM843T offers stronger performance in heavy write workloads, but doesn't muster the unabated write speeds of the Intel and Micron. The SM843T provides a much tighter performance envelope during the test period, highlighting its focus on predictable latency performance.

The Intel DC S3700 and Micron P400m separate themselves from the pack in this test.
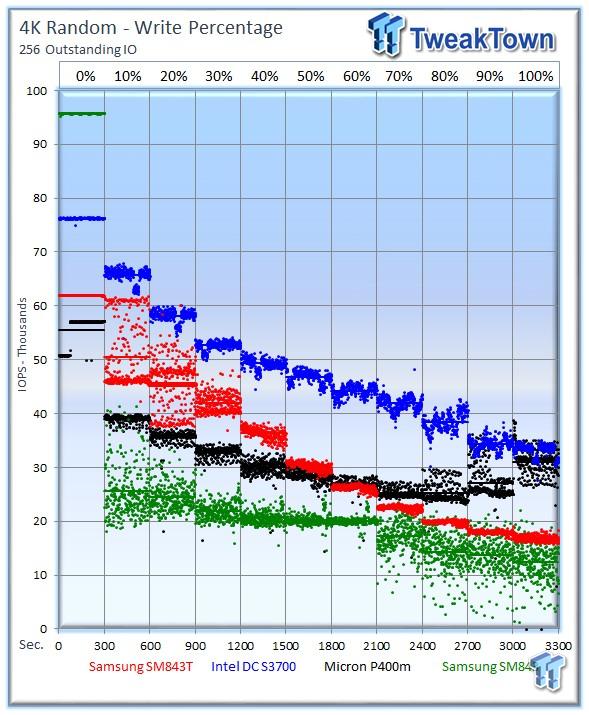
Our write percentage testing illustrates the varying performance of each solution with mixed workloads. The 100% column to the right is a pure 4k write workload, and 0% represents a pure 4k read workload.
The Intel easily leads this test with all write mixtures. The SM843 predictably leads the high read test, but falls quickly as we mix in heavier write activity. The SM843T performs well in heavier read workloads, but begins to lose steam as we mix in heavier write activity.

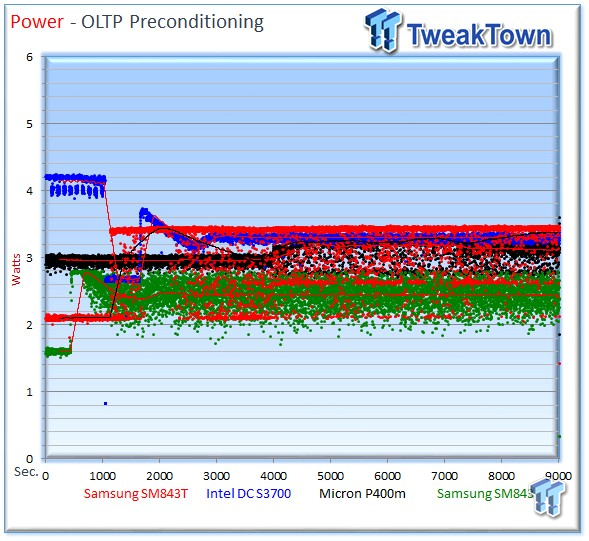
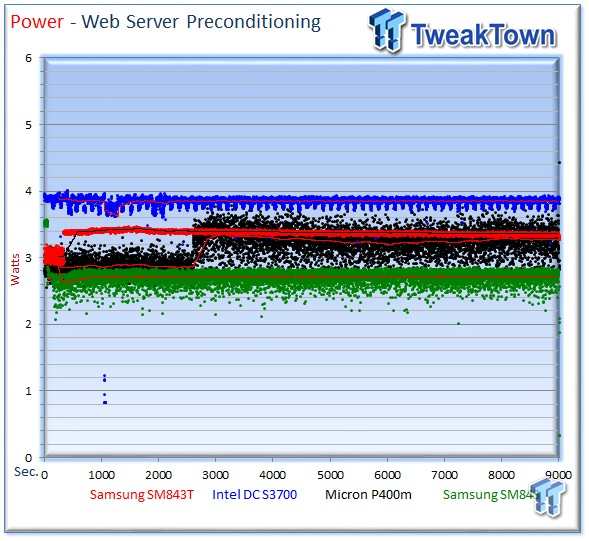
We record power consumption measurements during our precondition run. We calculate the stated average results after the device has settled into steady state during the last five minutes of the test.
The SM843T averages 3.38 watts, and only the SM843 is lower with its average of 2.86 watts. The P400M averages 4.00 watts, and the DC S3700 averages 3.72 watts during the measurement window.
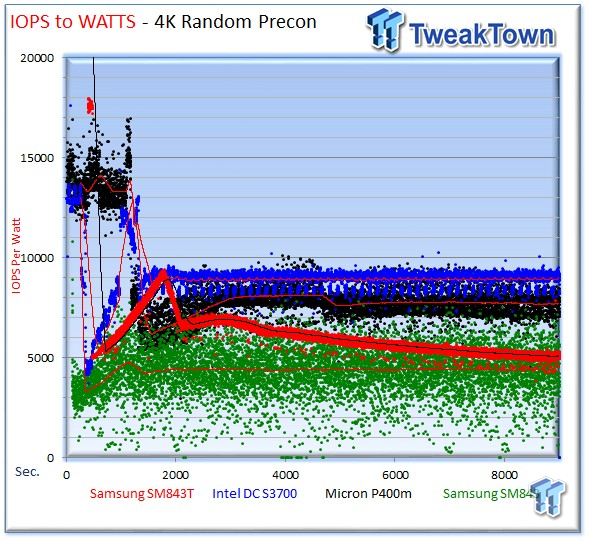
IOPS-to-Watts measurements are generated from data recorded during our precondition run, and the stated average is from the last five minutes of the test.
The SM843T averages 5,071 IOPS per watt, placing it near the SM843 with its average of 4,621 IOPS per watt. The DC S3700 averages 8,930 IOPS per watt, and the P400m weighs in at 7,684 IOPS per watt.
Benchmarks - 8k Random Read/Write
8k Random Read/Write


Many server workloads rely heavily upon 8k performance, and we include this as a standard with each evaluation. Many of our server workloads also test 8k performance with various mixed read/write distributions.
The average 8K random read speed of the Samsung SM843T is 37,251 IOPS at 256 OIO -second only to the SM843 at 44,444 IOPS. The Micron P400M scores 35,551 IOPS, and the Intel DC S3700 measures 45,423 IOPS. The SM843T closes the performance gap with 8K data, which is crucial for the majority of real-world workloads.


The SM843T narrows the latency gap considerably with 8k read activity.

The SM843T averages a very consistent 9,695 IOPS; the P400M averages 15,345 IOPS; the SM843 averages 6,254 IOPS; and the DC S3700 averages 17,263 IOPS. The SM843T continues to offer extremely consistent performance in heavy random write workloads.
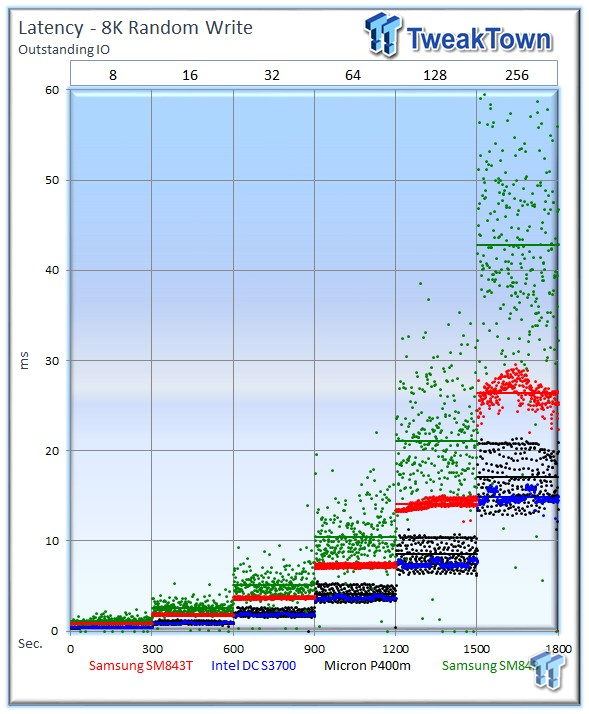
The Intel DC S3700 and Micron P400m separate themselves from the pack with very good 8k write latency.
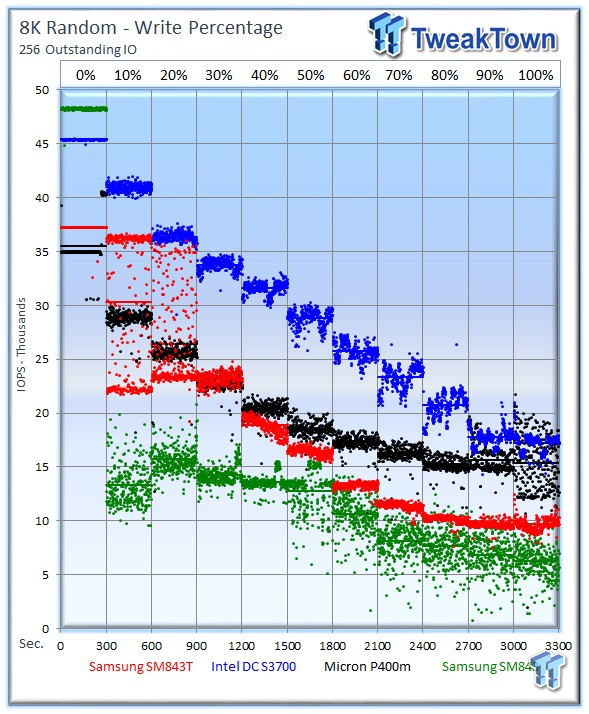
The SM843T falls into the same performance profile we witnessed with the 4k write percentage testing.
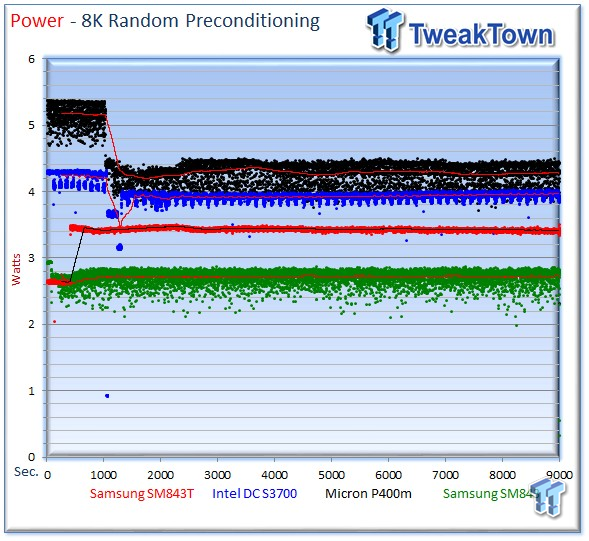
Power consumption for the SM843T averages 3.41 watts, the SM843 averages 3.54 watts, the P400M averages 4.27 watts, and the DC S3700 averages 3.96 watts. Once again, the SM843T sports miserly power consumption figures.
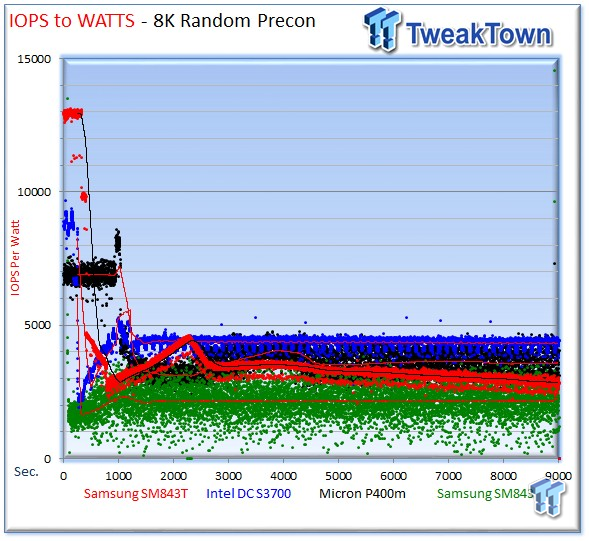
The SM843T averages 2,847 IOPS per watt; the P400M averages 3,577 IOPS per watt; the SM843 averages 2,234 IOPS per watt; and the DC S3700 averages 4,328 IOPS per watt.
Benchmarks - 128k Sequential Read/Write
128k Sequential Read/Write

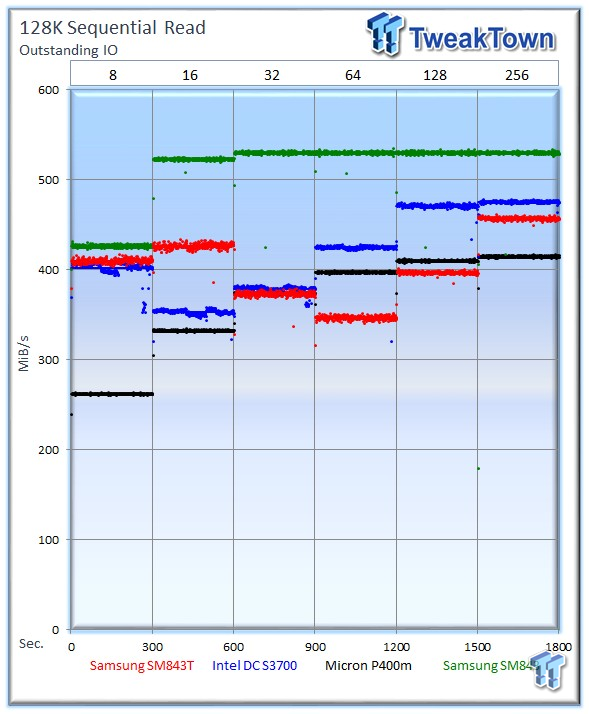
128k sequential speed reflects the maximum sequential throughput of the SSD, and is indicative of performance in OLAP, batch processing, streaming, content delivery applications, and backup scenarios.
The SM843T averages 457 MB/s at 256 OIO. The SM843 pulls ahead with an average of 528MB/s. The Micron P400M averages 414 MB/s, while the Intel DC S3700 delivers an average of 474 MB/s.


The SM843 provides the lowest overall sequential read latency.
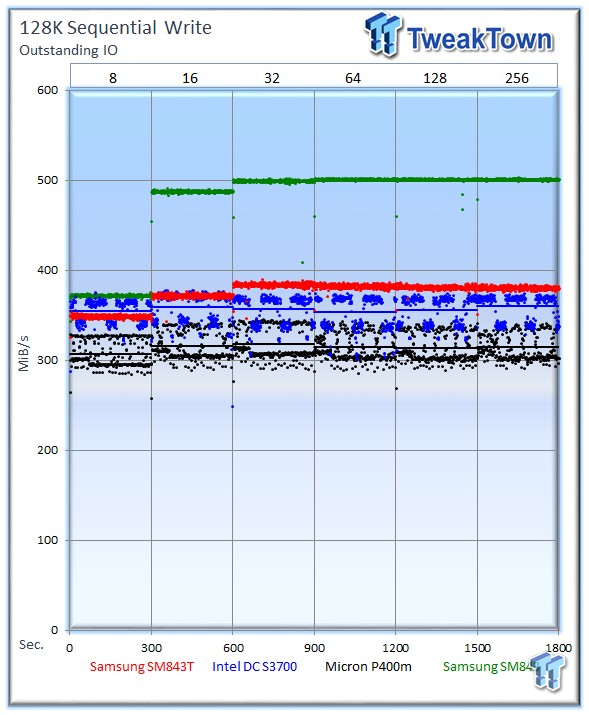
Sequential write performance is important in tasks such as caching, replication, HPC, and database logging. The SM843T is second in this test, with a speed of 380 MB/s. The SM843 leads with 501 MB/s, the P400M averages 314MB/s, and the DC S3700 scores 360 MB/s.

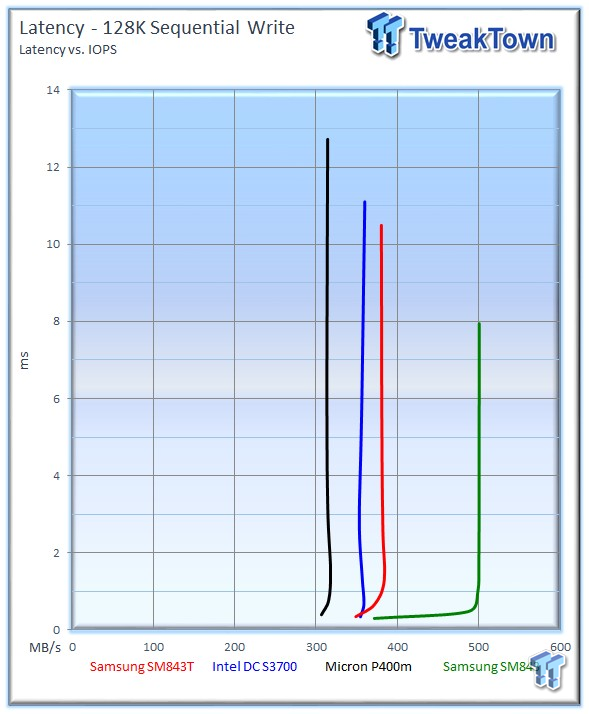
Once again, the closest competitor for the SM843T in some situations is the SM843.

The SM843T is very competitive in mixed sequential workloads, winning the majority of the read/write mixtures.

The SM843T averages a miserly 3.31 watts, the SM843 averages 3.65 watts, the P400M averages 5.8 watts, and the DC S3700 averages 4.28 watts.

The SM843T averages 114 MB/s per watt; the SM843 averages 136 MB/s per watt; the P400M averages 54 MB/s per watt; and the DC S3700 averages 82 MB/s per watt.
Benchmarks - Database/OLTP and Web Server
Database/OLTP


This test consists of Database and On-Line Transaction Processing (OLTP) workloads. OLTP is the processing of transactions such as credit cards and high frequency trading in the financial sector. Databases are the bread and butter of many enterprise deployments. These demanding 8k random workloads with a 66 percent read and 33 percent write distribution bring even the best solutions down to earth.
The SM843T averages 26,100 IOPS and features a nice, consistent performance profile. The P400M averages 21,075 IOPS, the Samsung SM843 has a very consistent average of 13,653 IOPS at 256 OIO, and the Intel DC S3700 averages 32,820 IOPS at 256 OIO.


The SM843T comes in second during the test window.
The SM843T averages 3.35 watts, the SM843 averages 2.43 watts, the P400M averages 3.11 watts, and the DC S3700 averages 3.30 watts.

The SM843T averages 7,714 IOPS per watt; the SM843 averages 5,969 IOPS per watt; the P400M averages 6,752 IOPS per watt; and the DC S3700 averages a tremendous 10,629 IOPS per watt.
Web Server


The Web Server workload is read-only with a wide range of file sizes. Web servers are responsible for generating content users view over the Internet, much like the very page you are reading. The speed of the underlying storage system has a massive impact on the speed and responsiveness of the server hosting the website.
The SM843T averages 19,932 IOPS at 256 OIO. The SM843 averages 28,800 IOPS, and the P400M averages 21,196 IOPS, falling to the DC S3700 average of 24,551 IOPS.

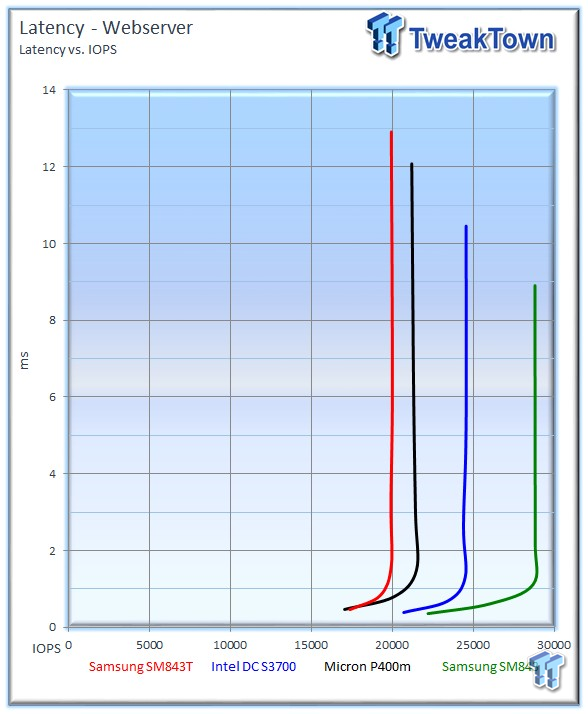
The SM843 pulls ahead in latency vs. IOPS testing.
The SM843T averages 3.35 watts, the SM843 averages 2.7 watts, the P400M averages 3.27 watts, and the DC S3700 requires 3.85 watts during the web server workload.

The SM843T averages 1,158 IOPS per watt; the SM843 averages 1,094 IOPS per watt; the P400M scores 2,971 IOPS per watt; and the DC S3700 averages 2,096 IOPS per watt.
Benchmarks - Email Server
Email Server


The email server workload is a demanding 8K test with a 50% read and 50% write distribution. This application is indicative of the performance in heavy write workloads.
The SM843T comes in second with an average of 18,652 IOPS; the SM843 averages 11,839 IOPS; the Micron P400M averages 17,657 IOPS; and the Intel DC S3700 averages 29,354 IOPS at 256 OIO.


The SM843T distances itself from the pack during the measurement window.

The SM843Taverages 3.41 watts, the SM843 averages 2.68 watts, the P400M averages 3.39 watts, and the DC S3700 averages 3.72 watts.
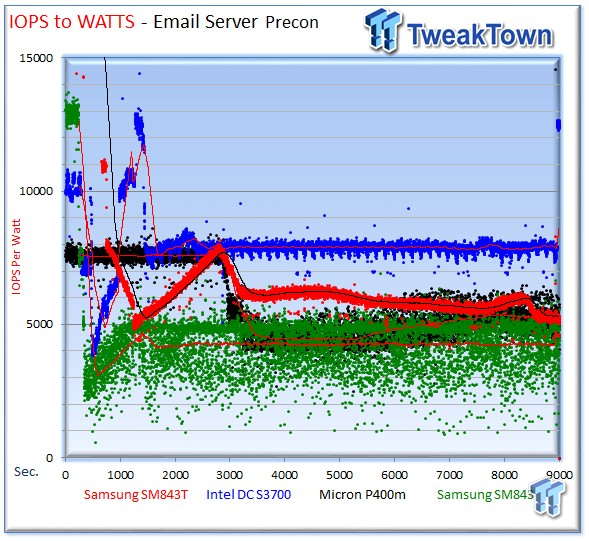
The SM843T averages 5,298 IOPS per watt; the SM843 averages 4,491 IOPS per watt; the P400M averages 5,213 IOPS per watt; and the DC S3700 scores 9,077 IOPS per watt.
Final Thoughts
Samsung has continued to refine their product line, and the SM843Tn is already supplanting the SM843T we tested today. The SM843Tn is a newer model with a die revision, and similar performance and endurance specifications. Samsung OEM SSDs can be hard to find in the wild, but some distributors, such as RamCity, have access to Samsung OEM drives.
The most redeeming quality of the SM843T was its consistent performance during our tests. The SM843T does not sport the flashy performance specs of other SSDs, but its consistent performance is clearly a strong suit. The benefits of consistent performance are huge in the datacenter. Faster performance often comes at the price of performance consistency. Steady performance is more desirable; especially in RAID and mirrored environments.
The SM843T scored low in the 100% 4k random read category, but narrowed the gap during our 8K tests. The strength with 8k workloads is important, as the majority of applications in the datacenter lean heavily upon 8k performance. In 8k random read testing, the SM843T placed a close second to its counterpart, the SM843. In many cases, the two Samsung SSDs were very close in performance, but the terrific random read speed of the SM843 is hard to beat in many tests.
The solid performance of the SM843T with 8k workloads carried over to the server workloads. The SM843T placed second in the OLTP workload, but did so with a very tight performance envelope, with very little variability. The write-intensive email workload also did little to faze the SM843T. The SM843T placed second in the workload with a consistent performance profile.
Sequential performance was a strong suit, with high marks in sequential read and write workloads. The SM843T excelled during mixed sequential testing by leading nearly every write mixture test. Power consumption for the SM843T was miserly, and its overall efficiency results were competitive with the other leading SSDs in the test pool.
The SM843T offers power-loss protection with Tantalum capacitors and SPOR (Sudden Power Off and Recovery) technology. This combination of hardware and firmware guarantees protection of data in the event of power-loss. The SSD also features a two-million hour MTBF, and a one per 10E17 UBER rating.
Samsung also provides specific overprovisioning guidelines to help users boost random write performance and increase endurance. We would like to see other SSD manufacturers follow suit with similar information. With the competitive nature of the SSD market, users can find great deals and tailor their purchase to their specific workload requirements.
The SM843T is covered by a five-year warranty, and is already in service in datacenters around the world. Samsung's fast pace of innovation promises more exciting new SSD technologies, and we will be following up with further products evaluations soon.
 Micron 6600 ION 245.76TB Enterprise SSD Review - Best in Class Programming Speeds
 Memblaze PBlaze 7 7A40 Ocean 61.44TB Enterprise SSD Review - Oceans of QLC at 3.3 million IOPS
 KIOXIA CD9P-R 7.68TB E3.S Review - The Best-In-Class Data Center SSD
 DapuStor Roealsen6 R6060 E1.L 245.76TB SSD Review - Massive Capacity with Fast Retrieval
 Phison Pascari X200P 7.68TB Enterprise SSD Review - Sequential Read Champion
 TCL debuts Ultimate Pro 32X3B and 27X3B gaming monitors with LG's 4th-gen WOLED panel
 Apple will offer the iPhone and Apple Watch for $17.99 and $11.99 per month
 Memory supply could plummet 70% as AI's endless hunger devours global production
 Valve fixes Steam bug that downloaded games online instead of over your local network
 World's first tri-mode 1300Hz gaming monitor and 12K ultrawide confirmed
 MOZA's first full-cockpit HMA150 motion system adds a new dimension to flying or racing
 Anthropic gives thoughts on open-weights models, especially those from China
 Xbox explains why its massive outage locked players out of games they owned
 Take-Two doubles down on GTA 6 release date, expects net bookings to increase by 22%
 Lenovo's Legion C700 is a thin Android handheld built just for local game streaming
 Logitech G316 X 98 Wired Gaming Keyboard Review - Retro-Inspired Board that Falls a Little Short
 Biwin M560 2TB SSD Review - Best Overall Retail-Ready DRAMless SSD
 Logitech G512 X 98 Analog Mechanical Gaming Keyboard Review - An Innovative Two-in-One
 Thrustmaster T.Flight HOTAS 5 MSFS Edition Review
 SteelSeries Arctis Nova Pro Omni Wireless Headset Review - One Headset to Rule Them All
 SteelSeries Arctis Nova 7 Wireless Gen 2 Headset Review - New and Improved, But Is It Enough?
 AMD Ryzen 7 7700X3D Review - Days of Future Past
 Samsung 990 2TB SSD Review - Ninth Gen QLC at PCIe Gen4 Speeds
 ASUS ExpertBook Ultra (Panther Lake) 14" Business Laptop Review
 ASUS ROG Raikiri II Xbox Wireless Controller Review - Ready to Take Control
 Printer Not Working in Windows? How to fix detection, print queues and drivers
 The Ultimate Guide to Personalizing Your Windows 11 Taskbar
 How to Turn Your Windows Laptop Into a Second Monitor with Miracast and Wireless Display in Minutes
 6 Mistakes to Avoid When Buying a Windows Laptop
 I capped Windows Update's bandwidth with Delivery Optimization, and my downloads stopped choking
 I use this decade-old free tool that finds files faster than Windows Search does
 I install and update most of my apps with this Windows command now, and I stopped downloading sketchy installers
 Hisense U6SF 65-inch MiniLED TV: High Performance Meets Leisurely Convenience
 I stopped digging through Windows menus after I set up this one folder
 Don't sell your Windows laptop until you do these things