Introduction
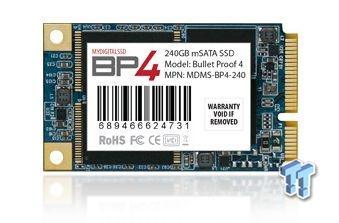
We've already published reports of MyDigitalSSD's 2.5" Bullet Proof 4 (BP4) in the 2.5" size and found it to be the least power-hungry SSD on the market. MyDigitalSSD also has a new mSATA version that uses the same Phison S8 controller and new firmware that increases the drive's overprovisioning. In our testing, the new firmware came with more than just a significant performance increase from the BP3 - also increased battery life.
MyDigitalSSD set new battery life standards with the BP4 and at this time they are equal to the early SandForce B02 stepping products that we've tested in the lab. In a month we'll be at Computex Taipei 2013 and B02 should be all over the place in new products, but until then, MyDigitalSSD's BP4 is the battery life king... and they might even have the crown after Computex, too. The main difference for those buying today, the BP4 is available now and has been on sale at Amazon for over a month already.
MDSSD's BP4 uses the same controller found in the BP3, the Phison S8. As we've mentioned before, most SSD's are just simply FPGA chips and the programming / firmware is more important than the actual silicon, most of the time. Holding that statement true today, the Phison S8 in the BP4 is programmed for increased overprovisioning - that's why the marketing capacity is now 240GB. The data performance is also faster on the BP4. Random data is quicker due to new programming, and sequential performance is faster thanks to new Toshiba 19nm Toggle Type B flash.
The mSATA market is really starting to heat up and several notebooks / ultrabooks cut the red ribbon in around a month's time. In order to meet low pricing demands by customers, many of the OEMs have turned to older, slower designs that cost less than new exciting products. Soon to market low-cost ultrabooks with small cache SSD's paired with HDD's will require an upgrade to full flash based mSATA drives to make your ultrabook perform like your desktop with an SSD in it now. With the slots present, dropping in a large SSD is still the best bang for the buck upgrade most users can do, without diving under the notebook skin too deep.
Specifications, Pricing and Availability
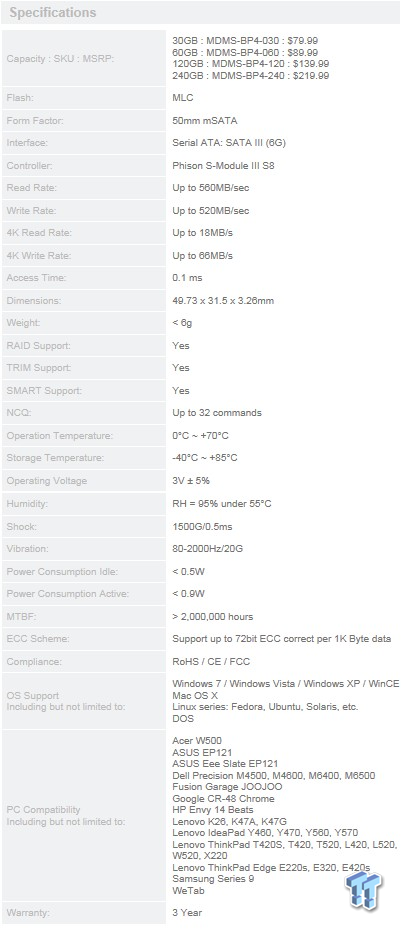
MyDigitalSSD released four capacity sizes in the new BP4 mSATA product line - 30GB, 60GB, 120GB - and the model we're looking at today, 240GB. The BP4 product line uses SATA III for 6Gbps of data bandwidth. Performance ratings from MDSSD come in at 560MB/s sequential read and 520MB/s sequential write speeds.
Drives built with S8 controllers have never lacked sequential performance, but their random performance has always been down a bit. MDSSD rates the BP4 at 18MB/s 4k read and 66MB/s 4K write. We'll see where the BP4 falls in our performance charts today, which is packed with the fastest mSATA products on the market.
Of course, performance is only part of the equation; price plays a significant role when making a purchase decision. The prices listed in MDSSD's spec sheet are the MSRP. After a little research, we found deep discounts available from MyDigitalSSD's e-tail wing, mydigitaldiscount.com. On their site we found the BP4 240GB at $179.99. The other capacity sizes are also significantly less - 30GB at $39.99, 60GB at $59.99 and the 120GB at $179.99. All prices were taken at the time of writing.
MyDigitalSSD BP4 240GB mSATA SSD

This is one of those rare occasions where we test a MyDigitalSSD product after its official launch. That means we have the full kit as you receive it when ordered from MDSSD.
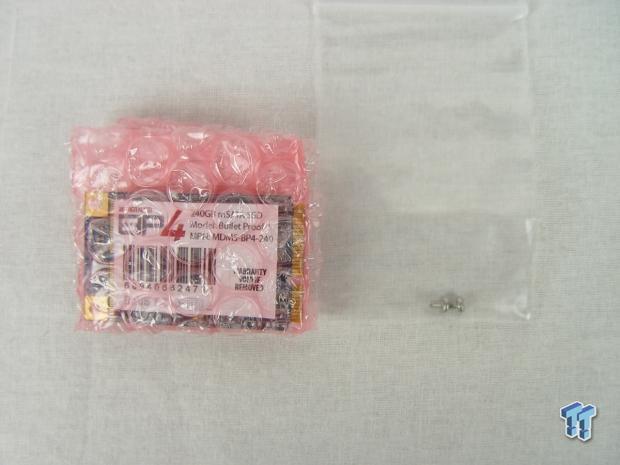
Inside the brown box is the MDSSD BP4 and three screws often not shipped with notebooks that didn't originally come with the mSATA slot populated.
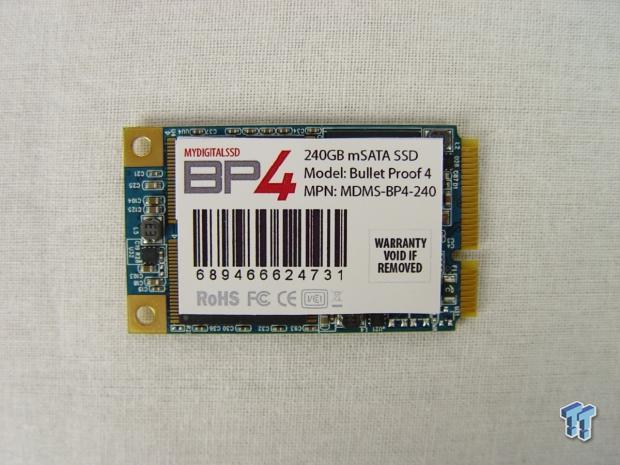
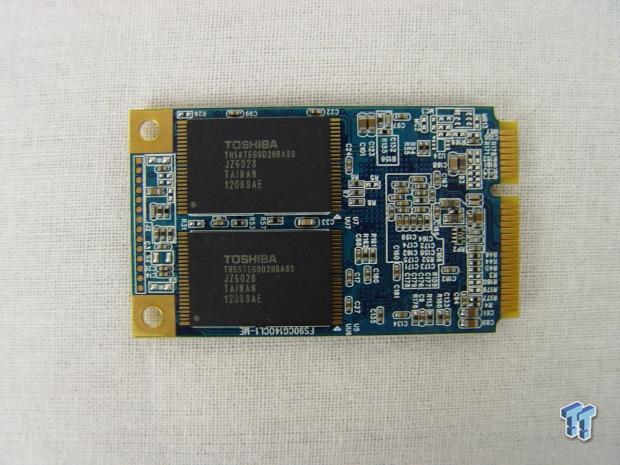
The new Toshiba 19nm Type B Toggle NAND in a BGA package for all to see.
Benchmarks - Test System Setup and ATTO Baseline Performance
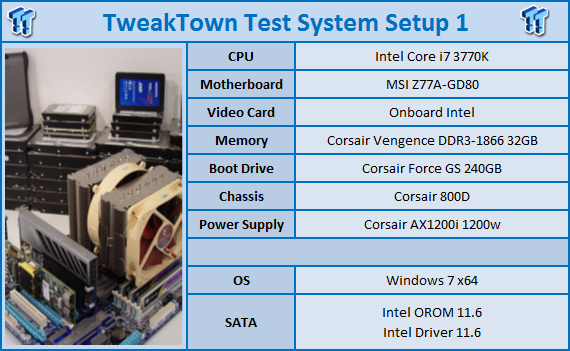
Desktop Test System
Lenovo W530 - Mobile Workstation
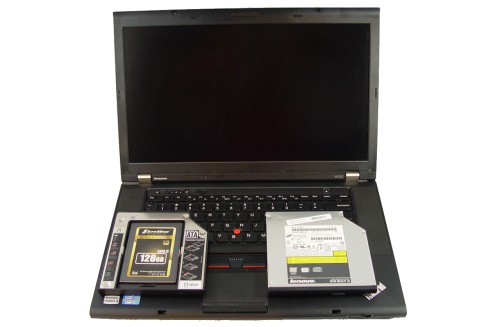
We use two systems for SSD testing. The desktop runs a majority of the tests and the Lenovo W530 runs the notebook power tests as well as the real-world file transfer benchmark.
ATTO Baseline Performance
Version and / or Patch Used: 2.34
ATTO is used by many disk manufacturers to determine the read and write speeds that will be presented to customers.
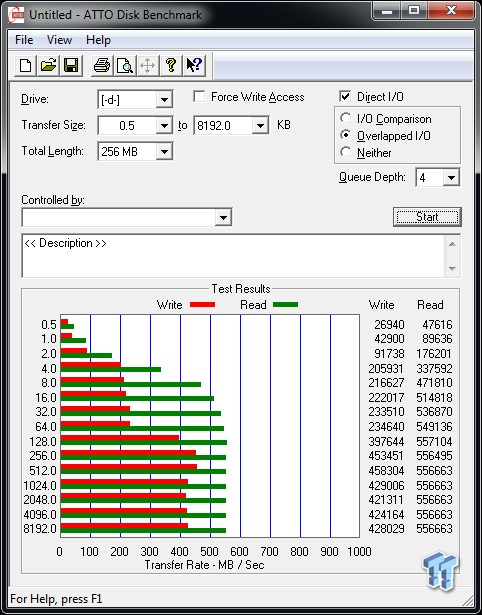
Looking down the ATTO block performance graph, read first, the BP4 240GB hits 560MB/s quick and then stays there for the duration of the test. The peak write block was at 512KB and was 458MB/s.
Benchmarks - Sequential Performance
HD Tune Pro
Version and / or Patch Used: 4.00
Developer Homepage: http://www.efdsoftware.com
Product Homepage: http://www.hdtune.com
HD Tune is a Hard Disk utility which has the following functions:
Benchmark: measures the performance
Info: shows detailed information
Health: checks the health status by using SMART
Error Scan: scans the surface for errors
Temperature display
HD Tune Pro gives us accurate read, write and access time results and for the last couple of years has gained popularity amongst reviewers. It is now considered a must have application for storage device testing.
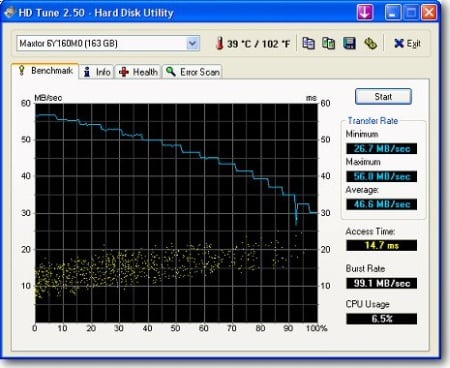
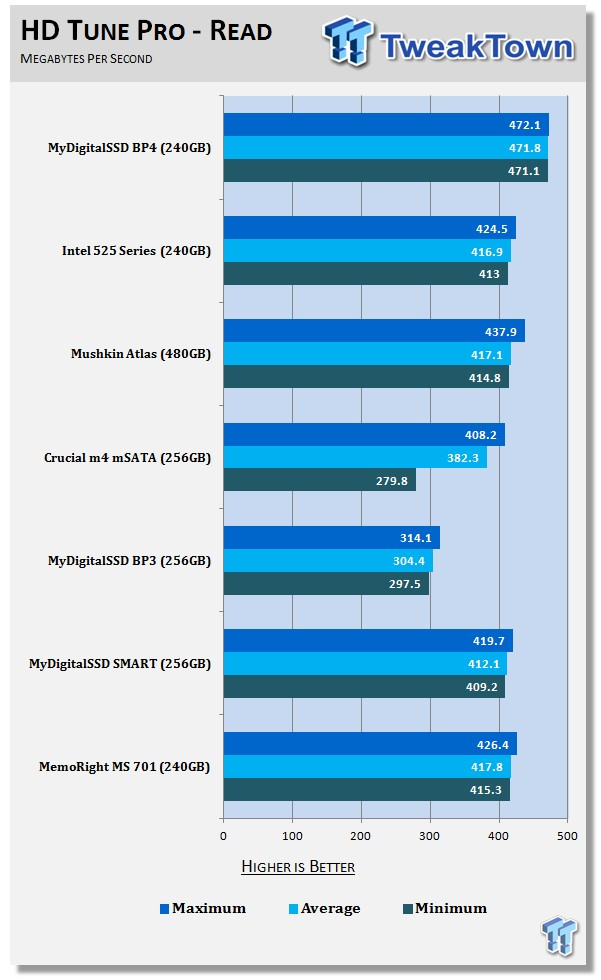
The MDSSD BP4's massive sequential speed comes through in our first test. At just over 471MB/s, the BP4 240GB outperforms every other mSATA drive in early fresh state sequential read testing.
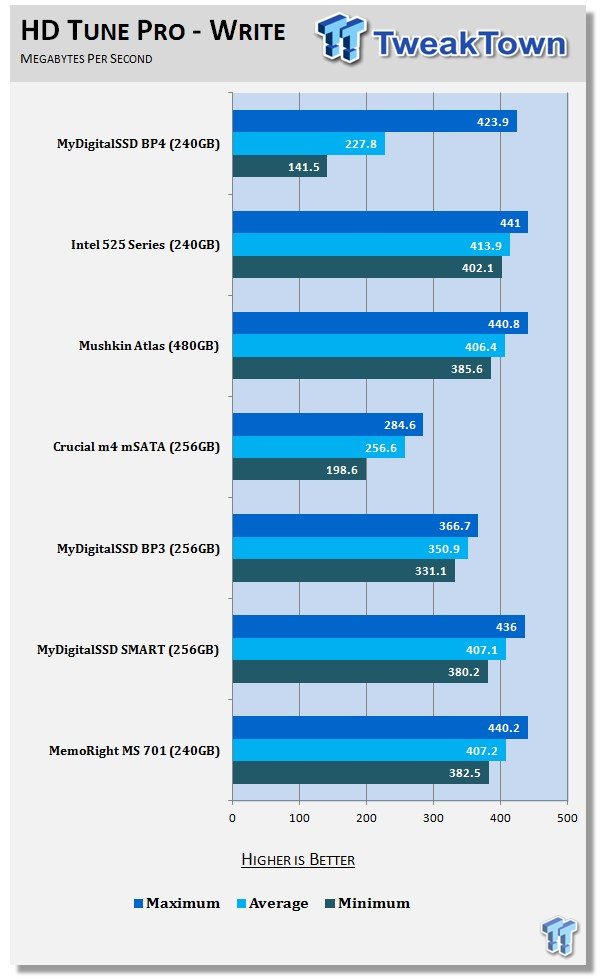
As soon as you start writing data to the BP4 mSATA, the write speed inconsistencies show their head. It's quite odd to have a drive kick so much ass reading data and then quickly drop off while writing data.
The BP4 runs in four-channel mode in the mSATA configuration (2.5" uses all 8 channels), like most other mSATA SSDs on the market today.
Benchmarks - AIDA64 Random Access Time
AIDA64 Random Access Time
Version and / or Patch Used: 1.60
Developer Homepage: http://www.aida64.com
Product Homepage: http://www.aida64.com
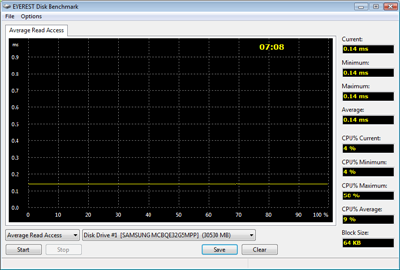
AIDA64 offers several different benchmarks for testing and optimizing your system or network. The Random Access test is one of very few if not only that will measure hard drives random access times in hundredths of milliseconds as oppose to tens of milliseconds.
Drives with only one or two tests displayed in the write test mean that they have failed the test and their Maximum and possibly their Average Scores were very high after the cache fills. This usually happens only with controllers manufactured by JMicron and Toshiba.
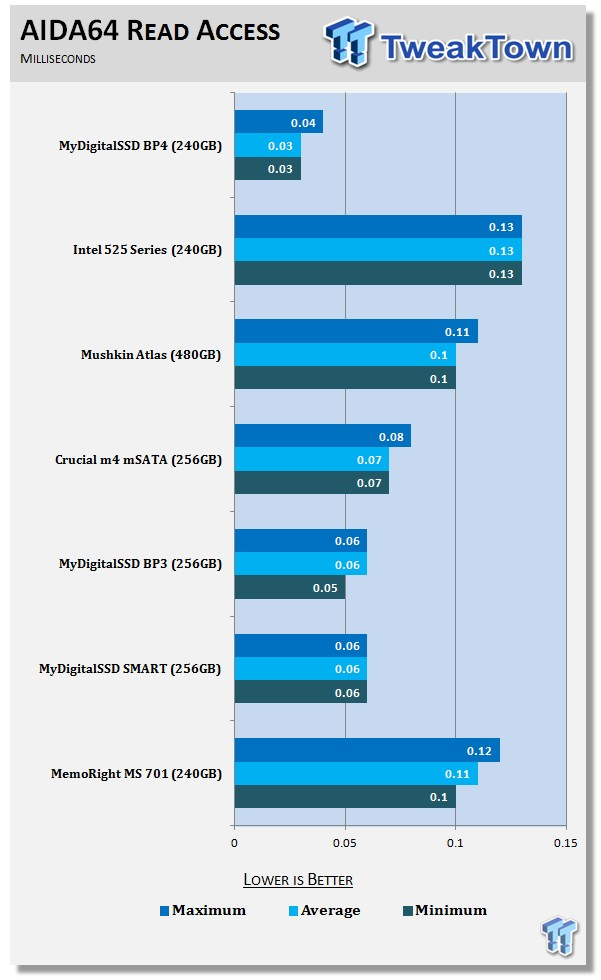
The BP4 240GB mSATA has exceptionally low read latency. This is more than just a charted statistic, the drive feels remarkably fast when reading data, even by SSD standards.
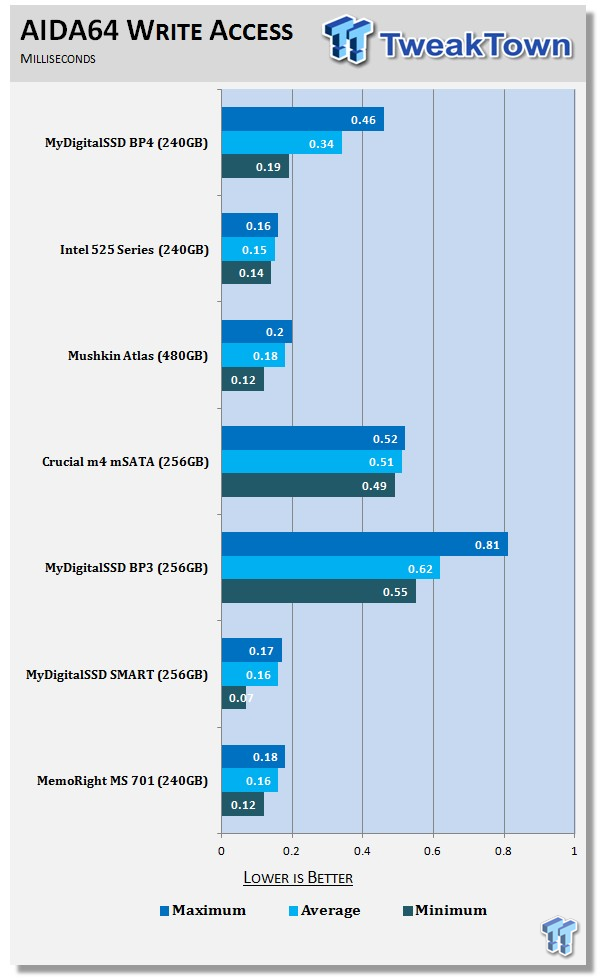
Then in one fell swoop the write latency brings us back to center fence post, swaying on which side we fall to, yea or nay. I wonder if Michael Jordan would still be the greatest player of all time if he kept his offence skills, but was an average defensive player?
Benchmarks - Anvil Storage Utilities
Anvil Storage Utilities
Version and / or Patch Used: RC6
So what is Anvil Storage Utilities? First of all, it's a storage benchmark for SSDs and HDDs where you can check and monitor your performance. The Standard Storage Benchmark performs a series of tests, you can run a full test or just the read or the write test or you can run a single test, i.e. 4K DQ16.
Anvil Storage Utilities is not officially available yet but we've been playing with the beta for several months now. The author, Anvil on several international forums has been updating the software steadily and is adding new features every couple of months.
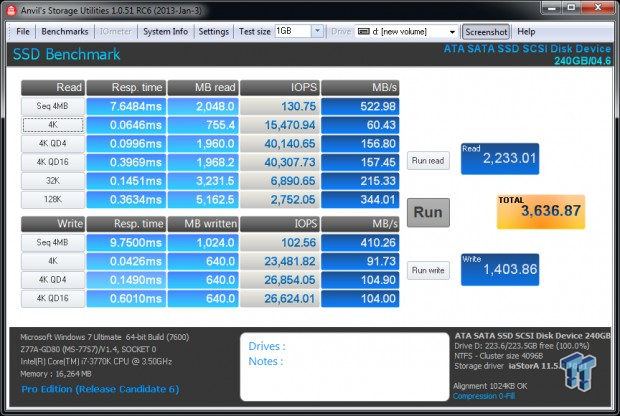
The software is used several different ways and to show different aspects for each drive. We've chosen to use this software to show the performance of a drive with two different data sets. The first is with compressible data and the second data set is incompressible data. Several users have requested this data in our SSD reviews.
0-Fill Compressible Data
Incompressible Data
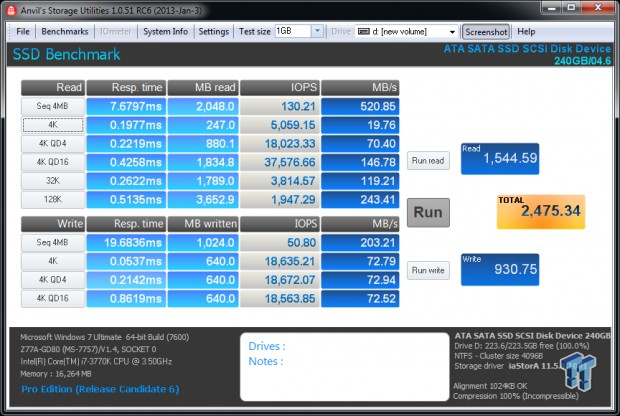
A number of changes came with the new Phison S8 firmware, one of which is higher performance with compressible data and slightly lower performance with incompressible data.
We never received an answer when asked if a compression method was introduced, i.e. SandForce like algorithms. For now, we can just say that the BP4 performs differently when working with different types of data.
Read IOPS through Queue Depth Scale
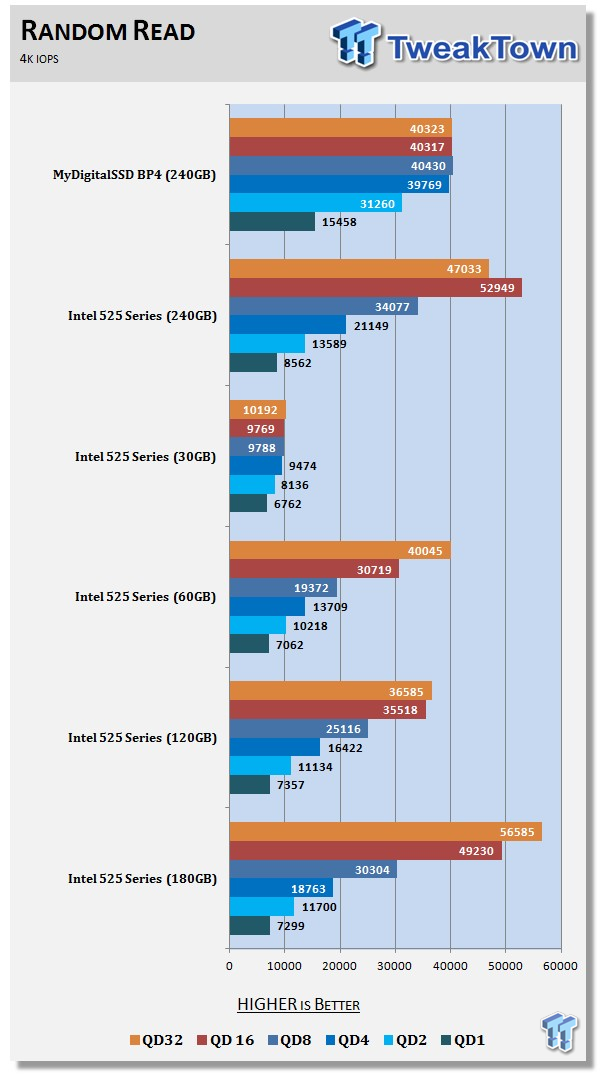
We haven't tested many mSATA SSDs after introducing some of our new tests. That takes us back to the moment we realized we'd missed several 128GB class SSDs and went on a sample spree to catch up. We're now in the process of collecting mSATA drives for review purposes.
The MyDigitalSSD BP4 240GB increases read IOPS rapidly and where it matters most to a majority of users, at low queue depths.
Scaling Write IOPS through Queue Scale
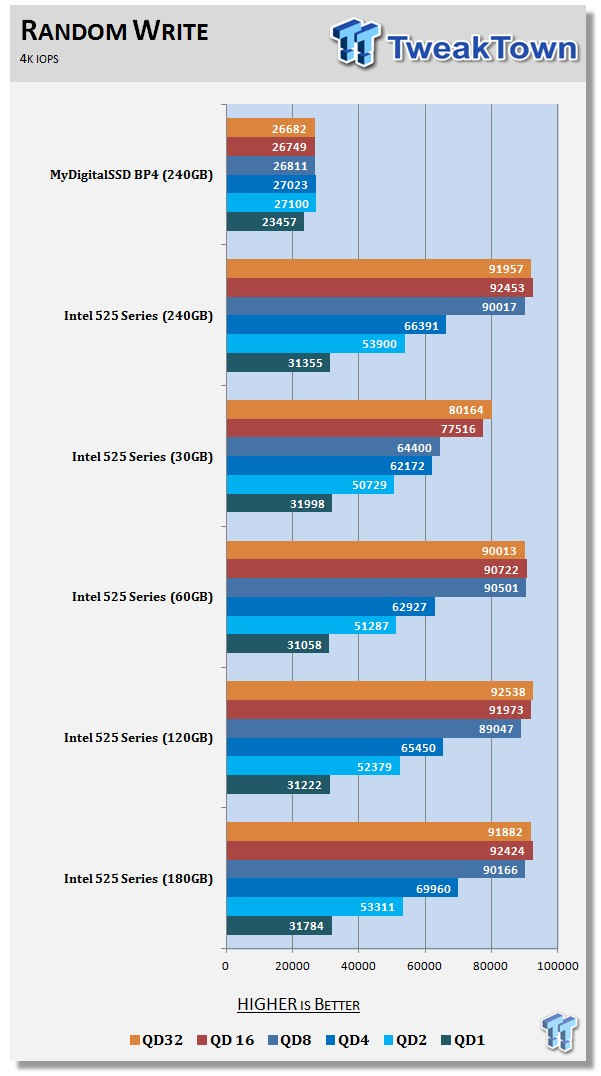
Then we get to the 4K write IOPS and discover a brick wall at roughly 27K IOPS.
Benchmarks - CrystalDiskMark
CrystalDiskMark
Version and / or Patch Used: 3.0 Technical Preview
Developer Homepage: http://crystalmark.info
Product Homepage: http://crystalmark.info/software/CrystalDiskMark/index-e.html
Download here: http://crystaldew.info/category/software/crystaldiskmark
CrystalDiskMark is a disk benchmark software that allows us to benchmark 4K and 4K queue depths with accuracy.
Key Features:-
* Sequential reads/writes
* Random 4KB/512KB reads/writes
* Text copy
* Change dialog design
* internationalization (i18n)
Note: Crystal Disk Mark 3.0 Technical Preview was used for these tests since it offers the ability to measure native command queuing at 4 and 32.
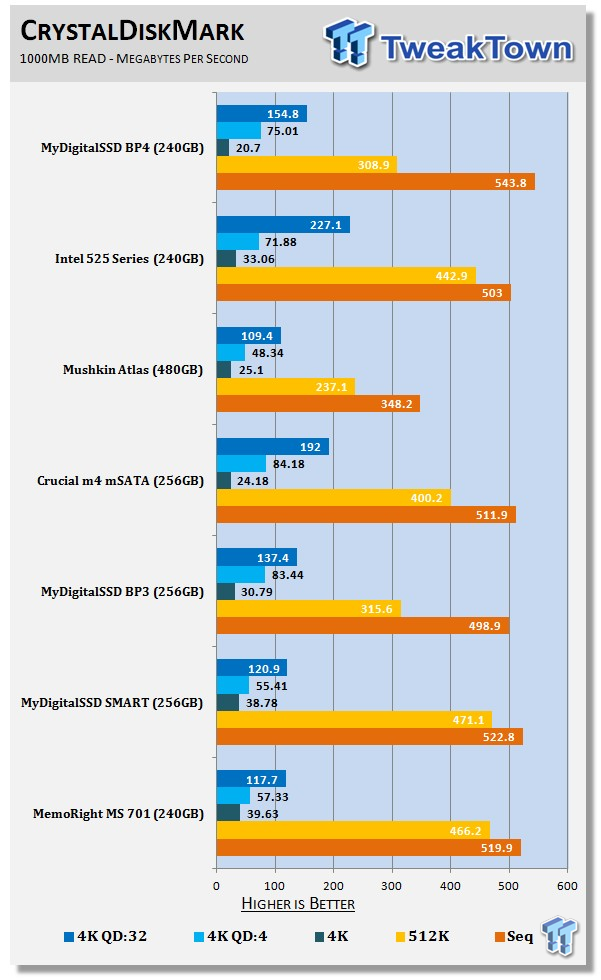
In this chart we have both the MyDigitalSSD BP3 with the Phison S8 controller on older programming and Toshiba 24nm and can compare the performance to the new BP4, both in mSATA form factor. The older model delivers better 4K read performance at QD1 and QD4, but the new 16K page size 19nm Toggle (on the BP4) delivers better performance at higher queue depths.
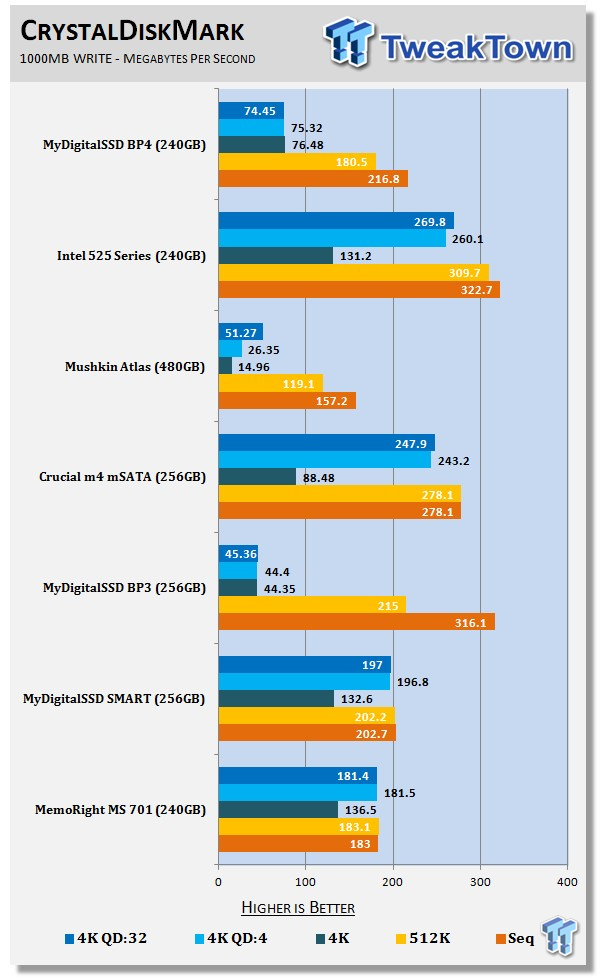
Both BulletProof mSATA drives show the same write performance brick wall, but the new BP4 has a higher ceiling when writing 4K data.
Benchmarks - PCMark Vantage Hard Disk Tests
PCMark Vantage - Hard Disk Tests
Version and / or Patch Used: 1.0.0
Developer Homepage: http://www.futuremark.com
Product Homepage: http://www.futuremark.com/benchmarks/pcmark-vantage/

PCMark Vantage is the first objective hardware performance benchmark for PCs running 32 and 64 bit versions of Microsoft Windows Vista. PCMark Vantage is perfectly suited for benchmarking any type of Microsoft Windows Vista PC from multimedia home entertainment systems and laptops to dedicated workstations and high-end gaming rigs. Regardless of whether the benchmarker is an artist or an IT Professional, PCMark Vantage shows the user where their system soars or falls flat, and how to get the most performance possible out of their hardware. PCMark Vantage is easy enough for even the most casual enthusiast to use yet supports in-depth, professional industry grade testing.
FutureMark has developed a good set of hard disk tests for their PCMark Vantage Suite. Windows users can count on Vantage to show them how a drive will perform in normal day to day usage scenarios. For most users these are the tests that matter since many of the old hat ways to measure performance have become ineffective to measure true Windows performance.
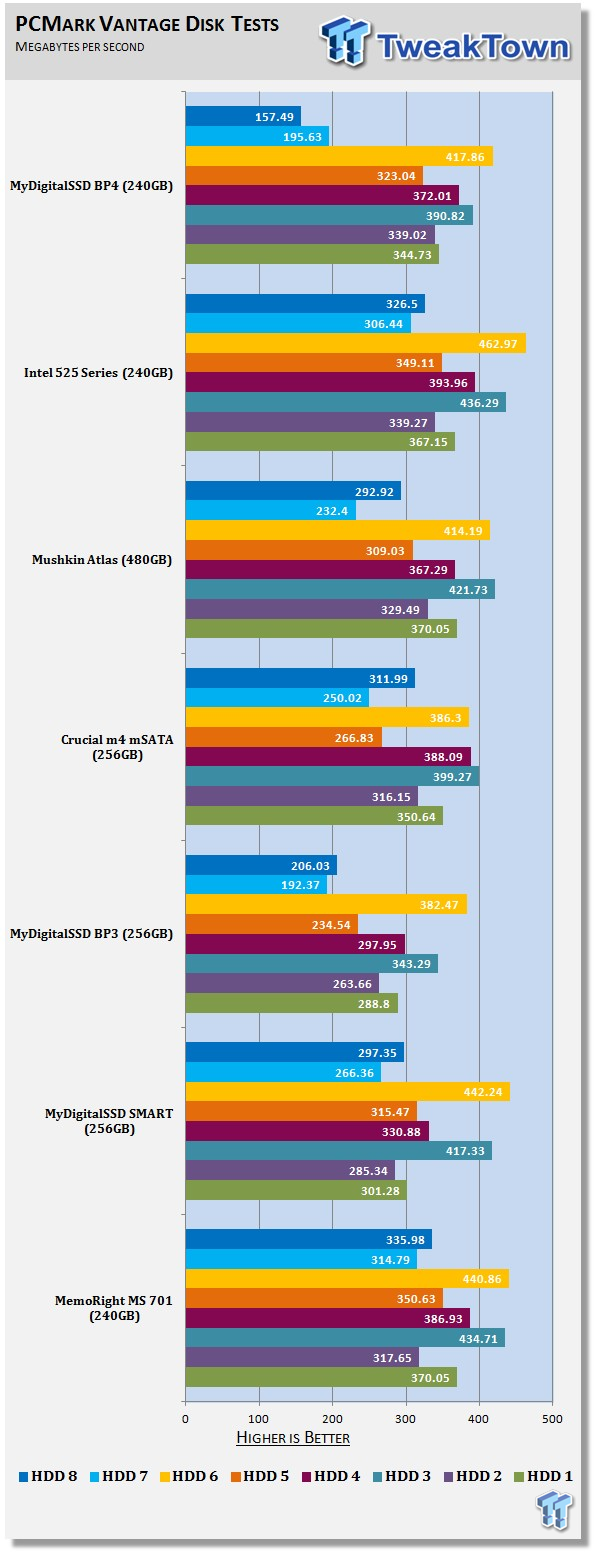
HDD1 - Windows Defender
HDD2 - Gaming
HDD3 - Windows Photo Gallery
HDD4 - Vista Startup
HDD5 - Windows Movie Maker
HDD6 - Windows Media Center
HDD7 - Windows Media Player
HDD8 - Application Loading
With the drives empty, we can start to see where corner case scenarios show better performance between the drives. It's no surprise the BP4 does well in the tests that are sequential read intensive.
Benchmarks - PCMark Vantage - Drives with Data Testing
For a complete breakdown on the Drives with Data Testing please read this article. You will be able to perform this test at home with the files provided in the article - full instructions are included.
- Brief Methodology
SSDs perform differently when used for a period of time and when data is already present on the drive. The purpose of the Drives with Data testing is to show how a drive performs in these 'dirty' states. SSDs also need time to recover, either with TRIM or onboard garbage collection methods.
Drives with Data Testing - 25%, 50%, 75% Full States and Dirty / Empty Test
Files needed for 60 (64GB), 120 (128GB), 240 (256GB)
60GB Fill - 15GB, 30GB, 45GB
120GB Fill - 30GB, 60GB, 90GB
240GB Fill - 60GB, 120GB, 160GB
Empty but Dirty - a test run just after the fill tests and shows if a drive needs time to recover or if performance is instantly restored.

Once we start getting data on the drives, the BP4 drops off fast and then, even after deleting the data, the recovery time is high. Normally we would point to this behavior in our TRIM test (green bar) and say that TRIM isn't working. That isn't the case, TRIM is working - it just takes a lot longer to complete the operation. A lot in this case is around ten minutes.
Running the test again ten minutes after the last standard test shows performance is once again back to light use levels. Our published results have a set amount of time between each test for consistency.
Benchmarks - BootRacer
BootRacer - System Boot Time
Version and / or Patch Used: 4.0
Developer Homepage: Greatis
Product Homepage: BootRacer
Download here: http://www.greatis.com/bootracer/download.htm
Note: In this test we use the Lenovo W530 Mobile Workstation loaded with an operating system and several program files. The data on the drive at the time of the test is 45GB. The second test, 50GB Free, was ran with the drives filled with block data until only 50GB of free capacity remained.
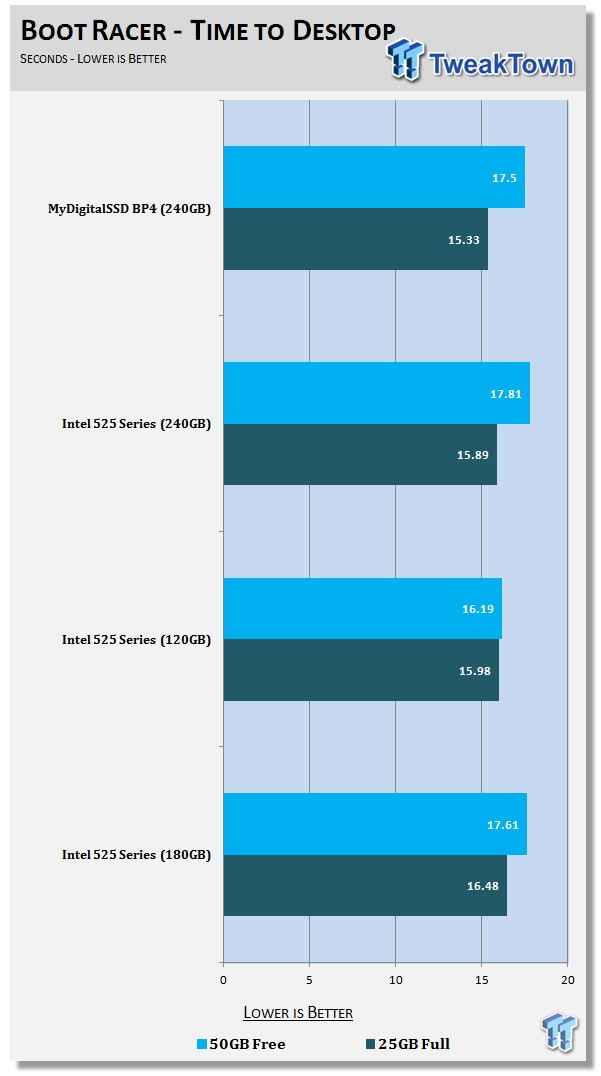
Increasing the amount of data on the BP4 also takes a toll on boot performance. Here we see the time for a reboot operation. The BP4 does well in this test, but there is a two second increase when moving from 25GB of data on the drive and 190GB of data on the drive.
The tally is in line with the Intel 525 Series 240GB.
Benchmarks - DiskBench
DiskBench - Directory Copy
Version and / or Patch Used: 2.6.2.0
Developer Homepage: Nodesoft
Product Homepage: DiskBench
Download here: http://www.nodesoft.com/diskbench/download
Note: In this test we use the Lenovo W530 Mobile Workstation and a SuperSSpeed S301 SLC 128GB SSD to move a 15GB block of data to and from the target drive. This is part of our real world test regiment. Roughly 45GB of data resides on the target drive before the '15GB Block' is transfer. The 15GB Block is the same data we built for the Data on Disk Testing and is a mix of compressible and incompressible data.
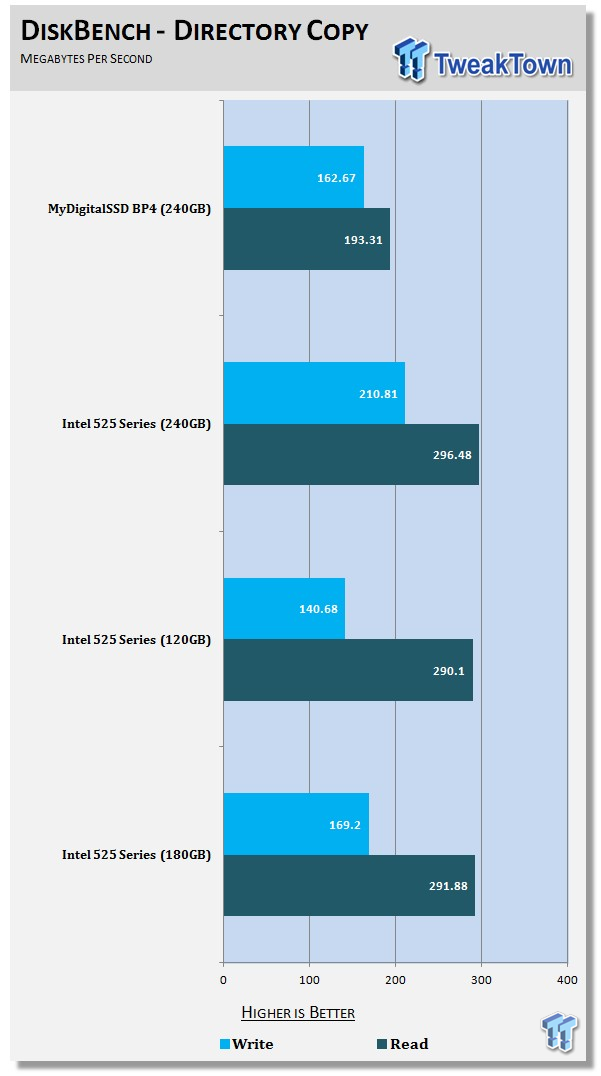
In this test we're writing controlled data to the MyDigitalSSD BP4 and then reading it back. The test uses mixed data, compressible and incompressible.
Benchmarks - Power Testing
Bapco MobileMark 2012 1.5
Version and / or Patch Used: 2012 1.5
Developer Homepage: http://www.bapco.com
Test Homepage: http://www.bapco.com
MobileMark 2012 1.5 is an application-based benchmark that reflects usage patterns of business users in the areas of office productivity, media creation and media consumption. Unlike benchmarks that only measure battery life, MobileMark 2012 measures battery life and performance simultaneously, showing how well a system design addresses the inherent tradeoffs between performance and power management.
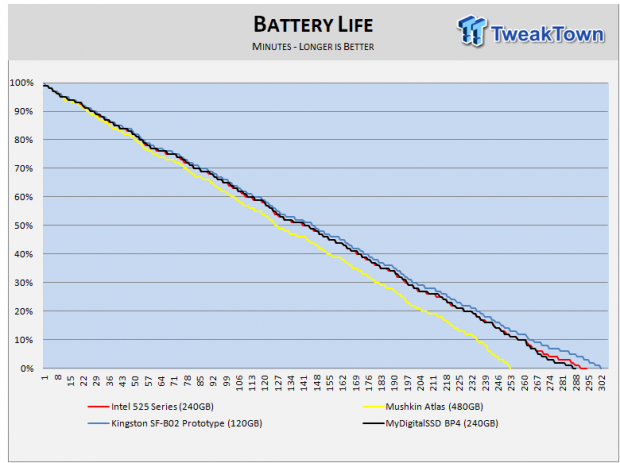
The MyDigitalSSD BP4 2.5" gives the longest battery life we've tested to date with a 2.5" SSD, but 2.5" battery life doesn't always relate to mSATA battery life. Strap in because you're about to get six months of lab testing in a few educational paragraphs.
At this time there are very few notebooks with mSATA slots running the SATA III spec. I found a grand total of two, both using AMD processors and chipsets. This will change with the introduction of Haswell, Intel's 4th generation Core processor. Haswell brings new chipsets with it and the SATA III port count increases from two to (up to) six, depending on the chipset used. We don't have any firm Intel Haswell data, nothing confirmed, but the popular rumor says up to six SATA III ports. That number may be just flagship desktop boards but, well you get the idea. It's not released yet, but it's pretty safe to say you won't have to worry about your mSATA port running at SATA II speeds, like they do now.
There are two methods of testing mSATA products. The first is with a native mSATA slot. On current notebooks and desktops that means SATA II limitations. The second method is with an mSATA to 2.5" adapter bracket to get SATA III speeds. The adapter kind of destroys the purpose of the mSATA form factor.
The mSATA to 2.5" adapter brackets available in the wild, i.e. retail, all use the 5-volt power line and converts it to 3.3 volts, the standard voltage for mSATA. Intel made a very limited number of special adapters that accept 3.3 volts and forward it directly to the mSATA drive. The chart below shows accurate 3.3 volts power consumption data with SATA III speeds, tested on a desktop motherboard.
The chart above, the Notebook Battery Life chart, also shows native 3.3 volts, but at SATA II speeds. This is a limit dictated by our Lenovo W530 and every other existing Intel based notebook on the market today that we know of. There are ultrabook products with mSATA SATA III ports, but we've yet to find one that also accepts 2.5" form factor HDD/SSDs. We wanted to use the same notebook for testing both mSATA and 2.5" products, and we got it wrong. We should have went with two separate test beds, a notebook for 2.5" SATA III and an ultrabook for mSATA. With Haswell just around the corner, we're not going to change the test system until after May when Haswell arrives.
PCMark Vantage HDD Tests - Power Draw
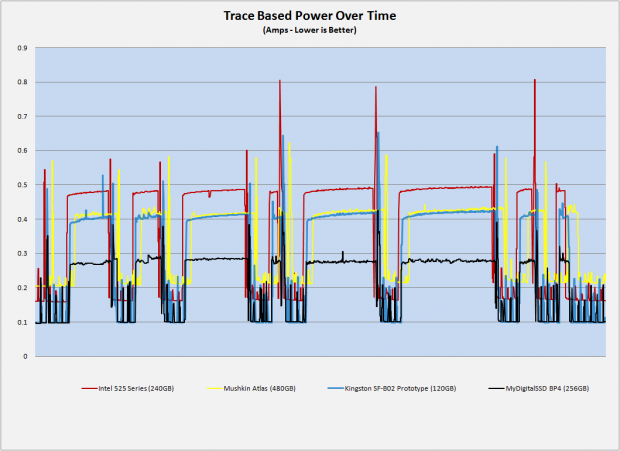
Running an mSATA drive at SATA II speeds increases what's called disk busy time. A drive is idle, gets sent a command, completes the task and then returns to idle. The time it takes to complete the task is the busy time. In the Trace Based Power Over time chart we clearly see the disk busy time and the return to idle by the power usage. Over SATA II, the busy time increases because the bus is slower.
The more time a SSD can spend at idle power, the longer the battery life. Several events can take a SSD out of an idle power state, the user requesting an action or a SSD performing background tasks.
Let's dive into these two charts starting with the second chart first. We've automated the test from the very beginning. Both software tools are open and a script starts upon requesting an action. The data logger starts for 10 samples and then the Vantage HDD test starts. All of the latency comes from the SSD and not in the actions of starting the tests.
In the chart, you can see the Intel 525 starts before the other drives. The MDSSD BP4 and Kingston prototype with a LSI SandForce B02 controller start at the exact same time and the Mushkin Atlas with asynchronous flash starts much later.
We can use the distance between the spikes and idle state drops to measure performance and disk busy time. There is little backend activity happening in the trace power chart, but in the Notebook Power chart, which runs for up to five hours, background activity becomes a factor.
In our notebook test, the MyDigitalSSD BP4 240GB delivers less battery life than the Intel 525 240GB and Kingston Prototype with a LSI SandForce B02 stepping controller. This is while limited to SATA II speeds, though. I suspect there will be significant changes when the mSATA drives are connected to SATA III. Also, Haswell based systems bring a new SATA spec feature called DEVSLP or Dev Sleep. We know the B02 controller takes advantage of DEVSPL.
By the time you read this, we'll have a Haswell based notebook in the US lab, but we'll be bound by NDA's from disclosing our findings until June 4th.
Final Thoughts
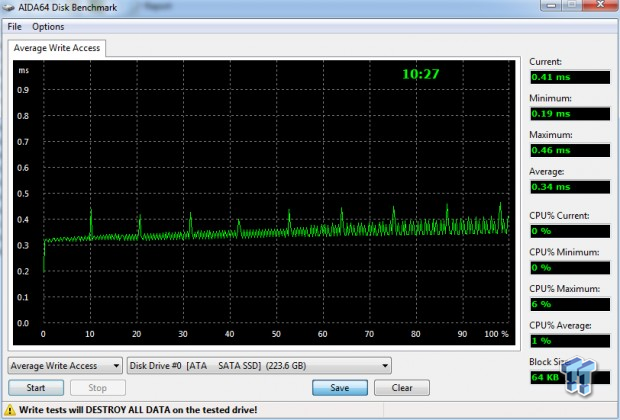
The MyDigitalSSD BP4 delivers very good sequential read performance until the drive has a significant amount of data on it. At that point a noticeable decrease in performance starts a downward slide that negatively affects the user experience. That isn't the worst part, though. That honor goes to the inconsistent write performance that affects write latency and when you have high latency, you have low IOPS performance.
How did the BulletProof 4 go from such a good 2.5" drive to such a poor mSATA drive? It's all about the channels. The mSATA version is limited to just four channels and the 2.5" utilizes all eight channels. Personally, I think we are seeing the affects of poorly written firmware that isn't optimized for a four channel controller. I can't point to any one area and tell you with certainty that my theory is correct, though. If there are issues with the firmware and efficiency, then reducing the number of channels is an easy way to highlight them.
Going into this review we fully expected the mSATA variant of BP4 to deliver class leading battery life, but we know now that isn't the case. BP4 is really close to LSI SandForce's B02 at this time. Going forward into Haswell, BP4's battery life will look average. SSDs with DEVSLP will have a massive advantage since they'll drop to just .1mW and recover from that nearly nonexistent consumption state in 100ms. The new B02 controller and Plextor's new Marvell based mSATA drive both support DEVSLP. The feature isn't on BP4's product spec list, but it's possible for MDSSD to add the feature later. That still doesn't get around the write latency or the poor performance when the BP4 mSATA has data populating the drive.
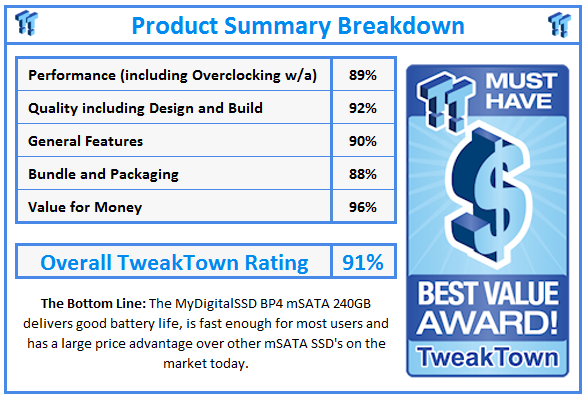
The great equalizer though is the price and that's where the BP4 has an advantage over the competition. After researching, we found that every other current gen 256GB class mSATA drive tips the scales north of $200. A few are close to the $200 price point but most, like the SX300, M4, M500 and so on, are closer to $250. The 240GB BP4 mSATA we tested today costs less than $180 at mydigitaldiscount.com. With a $20 to $70 price advantage, the BP4 mSATA 240GB is very attractive for those looking for a bang for the buck mSATA SSD.

