


Introduction
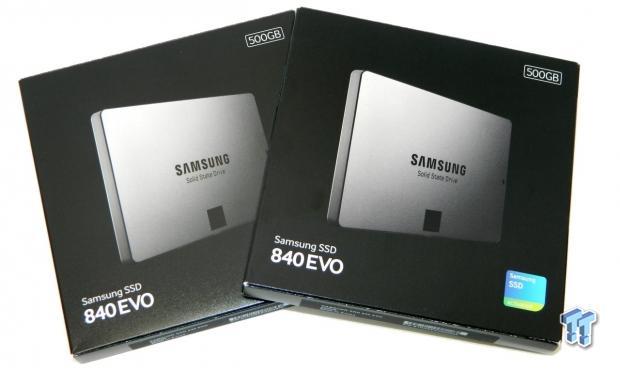
Today we're going to RAID 0 a pair of Samsung's newest SSD's for your viewing pleasure. So far Samsung is the only player to implement TLC (Triple Level Cell) NAND technology into a retail product. Samsung is looking to revolutionize solid state storage by producing products that have more capacity at a lower cost.
Samsung first introduced us to TLC based solid state drives with their original SSD 840. Samsung's SSD 840 proved to be a solid performer as well as a very reliable platform. Samsung proved beyond a shadow of a doubt that TLC NAND is a totally viable option for consumer based storage implementation.
Samsung's recently launched SSD 840 EVO is a second generation TLC based SSD. Building on the success of the original SSD 840, Samsung is taking TLC implementation to a whole new level. EVO stands for "evolution", so, as you might guess, Samsung is billing their new SSD 840 EVO as "the next evolution in solid state storage".
What makes the EVO the next evolution in solid state storage? In my opinion, the most important technology implemented into the EVO is what Samsung calls "Turbo Write" technology. Turbo Write technology is a write acceleration layer Samsung's baked into their new 19nm TLC NAND.
Turbo Write is an emulated SLC (Single Level Cell) layer baked into the EVO's NAND array. Special programming allows a portion of the EVO's TLC based NAND array to operate like SLC NAND. This pseudo SLC layer allows for write acceleration because programming one bit per cell (SLC) can be accomplished at a lower latency than programming three bits per cell (TLC).
Turbo Write technology successfully mitigates the shortcomings of TLC NAND by accelerating write speed, lowering write amplification, and greatly increasing endurance. Turbo Write technology allows Samsung to offer the consumer a solid state storage solution that has class leading performance AND pricing all-in-one product.
Specifications, Pricing and Availability
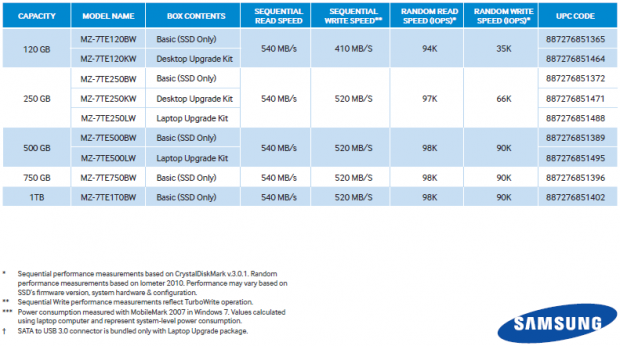
Available in five capacity sizes, the EVO is the most affordable Hyper-Class SSD available today. Specifications list the 500GB SSD 840 EVO as capable of 540 MB/s sequential reads and 520 MB/s sequential writes. Random read speed is listed at 98,000 IOPS at 4K, QD32. Random write speed is listed at 90,000 IOPS at 4K, QD 32. The SSD 840 EVO has a z-height of 7mm.
Our Latest RAID Article Coverage
- HighPoint Rocket 1604L Gen5 x16 NVMe Software RAID AIC Review: half the price with full 59 GB/s speed
- HighPoint Rocket 7604A Gen5 x16 NVMe RAID AIC Review - Half the Size, All the Speed
- OWC Accelsior 8M2 4TB PCIe RAID Card - 26 GB/s on the cheap
- Cheap Samsung SM961 NVMe VROC RAID SSD Performance
- LaCie 2Big RAID Desktop Storage Review
Samsung backs the SSD 840 EVO with an industry standard limited three-year warranty. The SSD 840 EVO comes bundled with Samsung's own data migration software and Samsung's Magician software.
The 500GB Samsung SSD 840 EVO is available from Newegg for the low price of $344 (69 cents per GB) at the time of writing. Since this is a RAID review, we are going to focus on performance, rather than features.
For a more in-depth look at EVO's feature set, I will refer you to Chris Ramseyer's extensive review.
Now let's see what kind of performance we can get from a pair of 500GB SSD 840 EVO's in RAID 0.
Samsung SSD 840 EVO 500GB
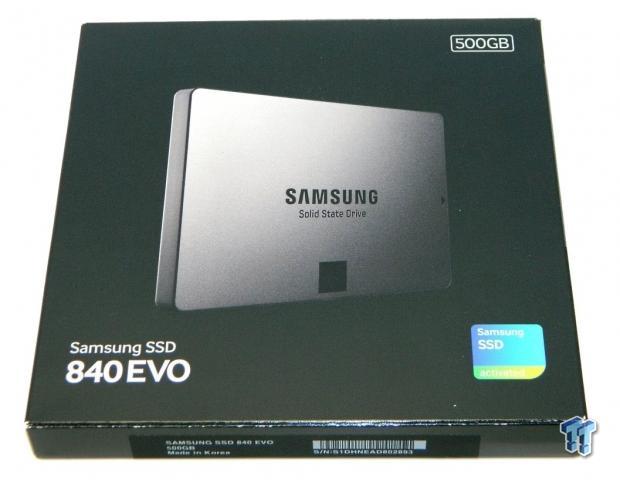
Samsung's SSD 840 EVO comes packaged in a small attractive box that has a picture of the drive on the front. The black box is textured and has white lettering.
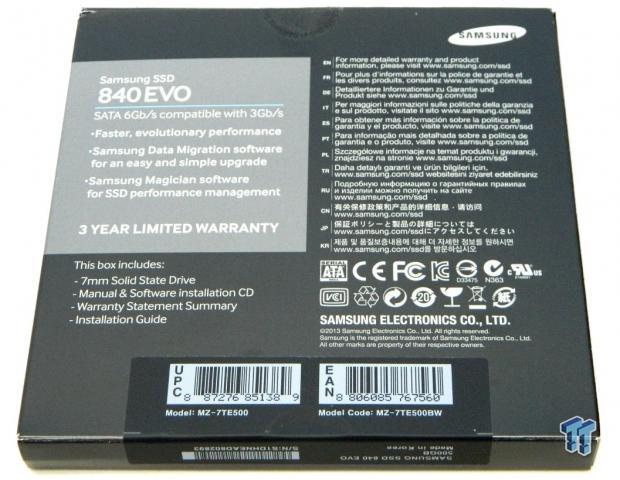
The rear of the box lists some advantages you will experience when using an EVO in your system and lists the bundled software. The drives serial number and UPC are listed as well.
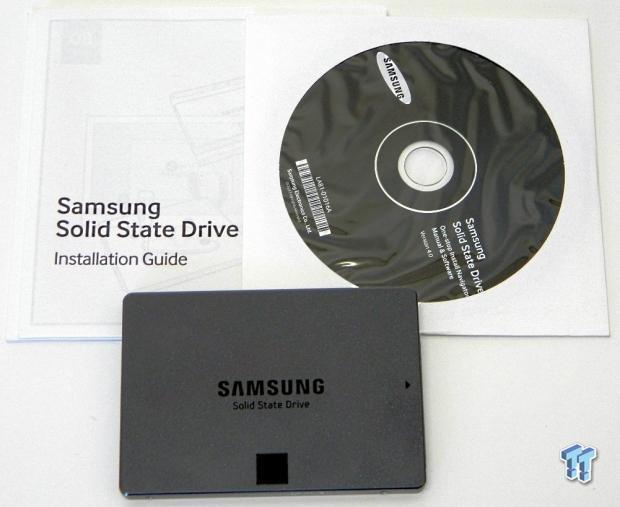
The EVO comes cradled in a protective plastic tray that we removed for our photo. Included is a printed installation guide and software CD.
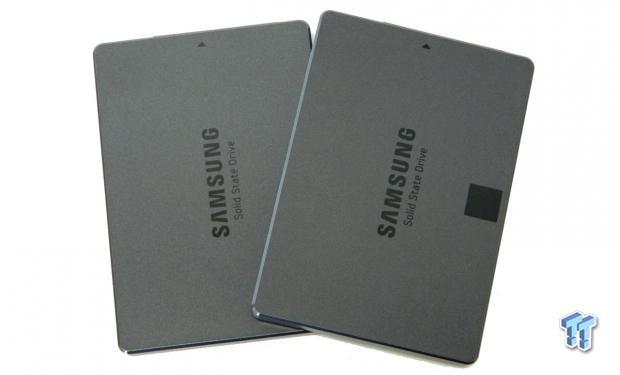
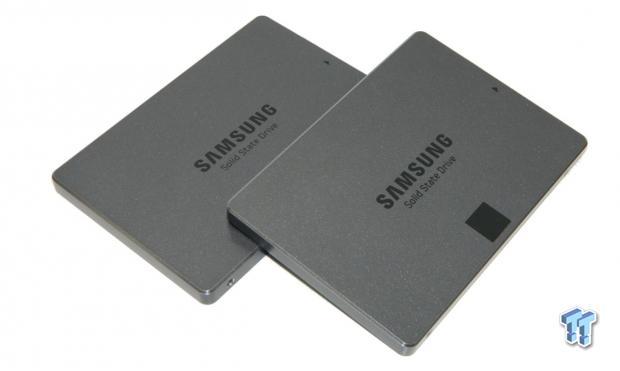
The top and sides of the EVO's enclosure are formed from piece of cast, glass beaded aluminum painted dark gray. Beveled edges and rounded corners give it a nice touch.
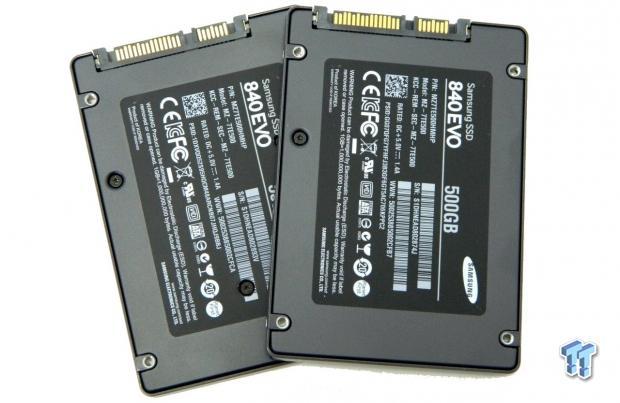
The bottom of the drives enclosure is formed from a piece of stamped sheet aluminum painted dark gray. Centered on the rear face of the enclosure is a manufacturer's sticker that lists the drives part number, serial number and capacity. The bottom of the enclosure is secured by three pentalobe screws, two of which are hidden by the sticker.
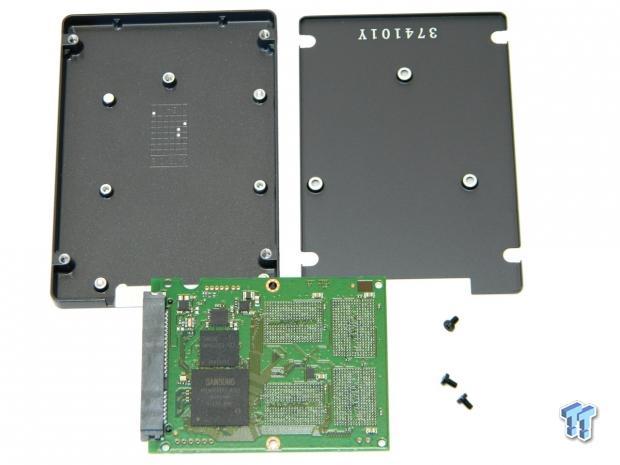
Here's what the Samsung SSD 840 EVO 500GB SSD looks like completely disassembled. The EVO is all about minimalism. The PCB is much smaller than the enclosure.
Benchmarks - Test System Setup, Drive Properties & ATTO Baseline Performance
Desktop Test System
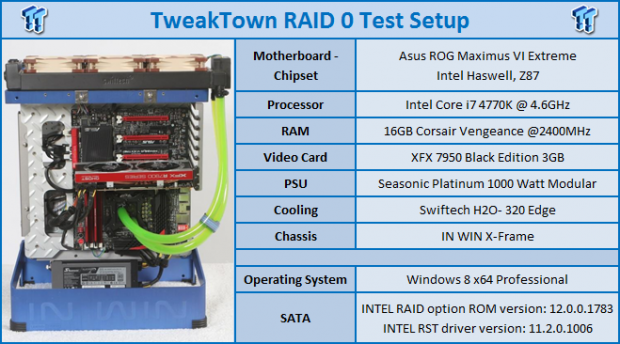
Drive Properties
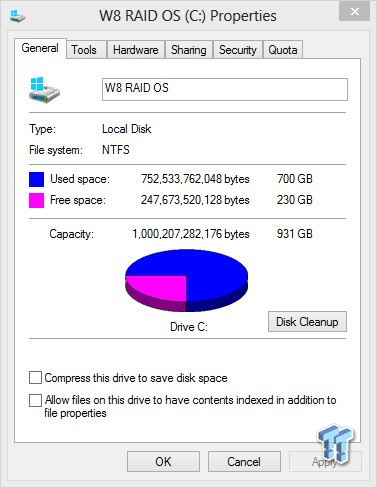
The majority of our testing will be done with our test drive/array as our boot volume. Our boot volume is 75% full for all OS Disk "C" drive testing, to mimic a typical consumer OS volume implementation. We're using 64K stripes for all our arrays. Write caching is enabled.
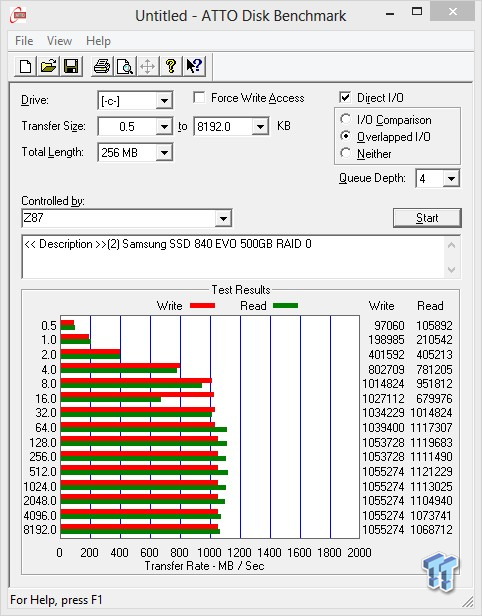
ATTO Baseline Performance
Version and / or Patch Used: 2.47
ATTO is a timeless benchmark used to provide manufactures with data used for marketing storage products.
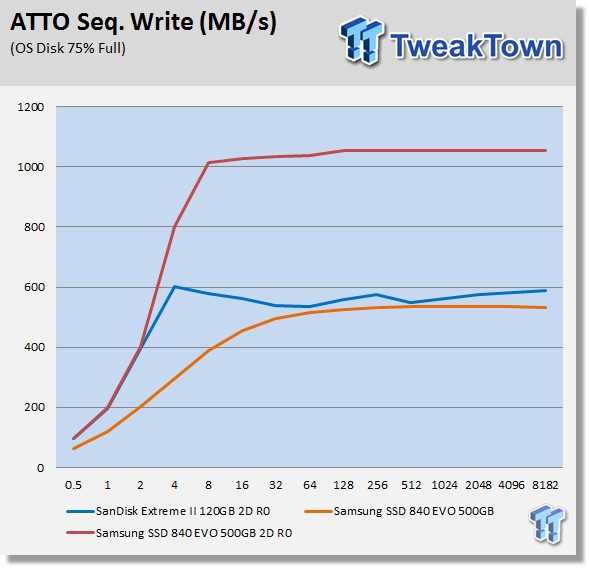
Sequential Write
Sequential Read
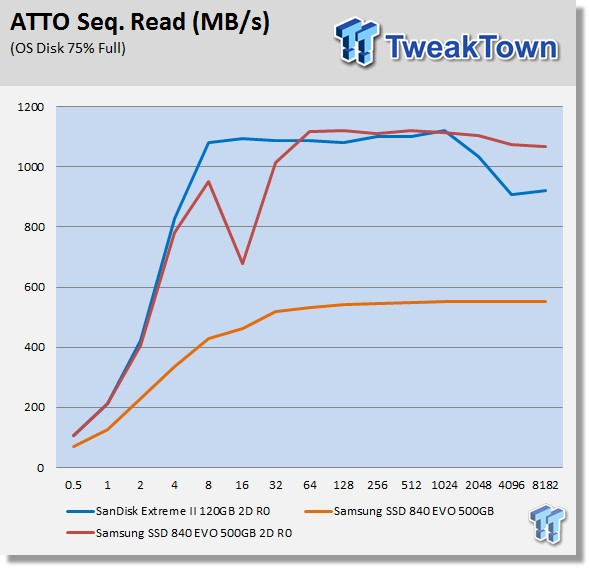
Typically, SSD's that have capacities of 240GB or larger have far better write performance than smaller drives. The EVO we are testing today has a capacity of over 240GB and as such has superior write performance. The EVO's "Turbo Write" technology further enhances write performance.
A single 500GB EVO has nearly equivalent write performance to a pair of 120GB drives. A Pair of EVO's in RAID can write at over 1GB per second.
Both our RAID arrays have read performances that easily exceed 1GB per second.
Benchmarks - Anvil Storage Utilities
Anvil Storage Utilities
Version and / or Patch Used: RC6
So what is Anvil Storage Utilities? First of all, it's a storage benchmark for SSDs and HDDs where you can check and monitor your performance. The Standard Storage Benchmark performs a series of tests, you can run a full test or just the read or the write test or you can run a single test, i.e. 4K DQ16.
The software is used several different ways and to show different aspects for each drive. We've chosen to use this software to show the performance of a drive with two different data sets. The first is with compressible data and the second data set is incompressible data. Several users have requested this data in our SSD reviews.
0-Fill Compressible Data
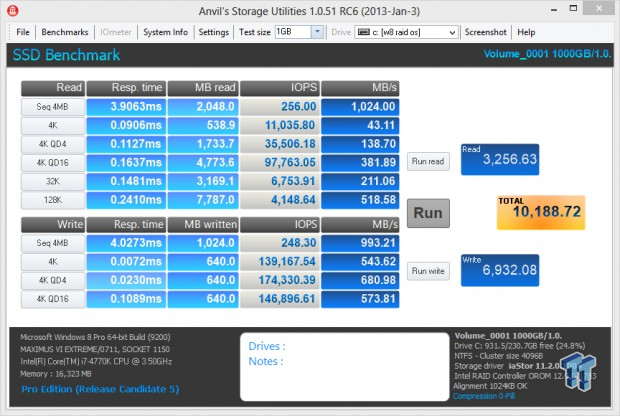
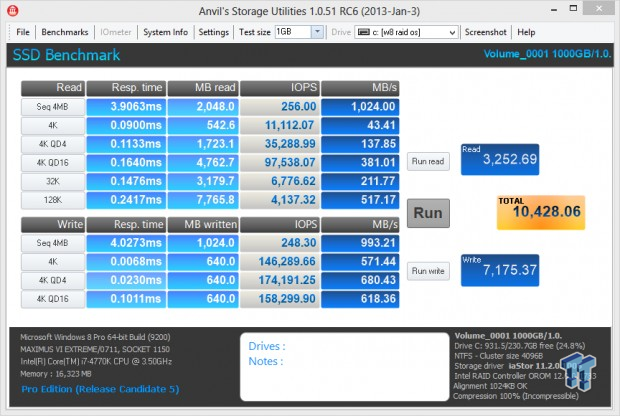
Any time you can score over 10,000 points with a pair of drives, you are dealing with hyper-class SSD's.
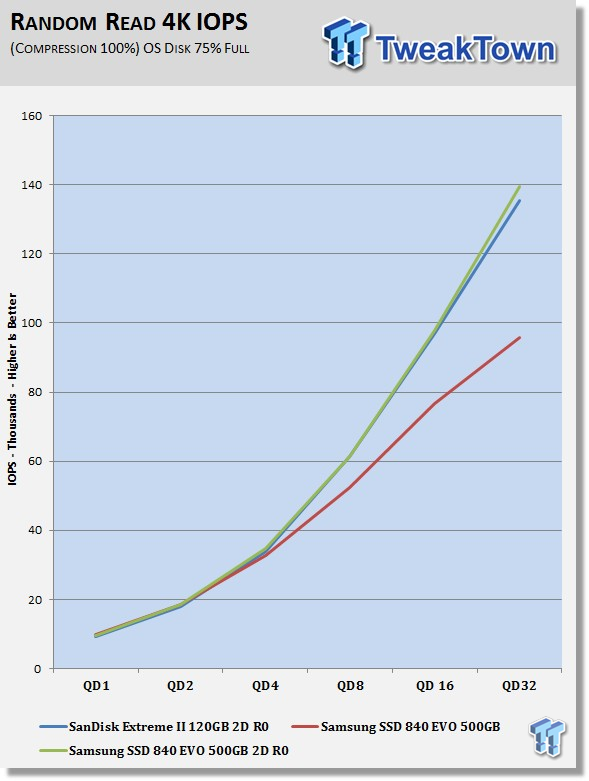
0-Fill Compressible Read IOPS through Queue Depth Scale
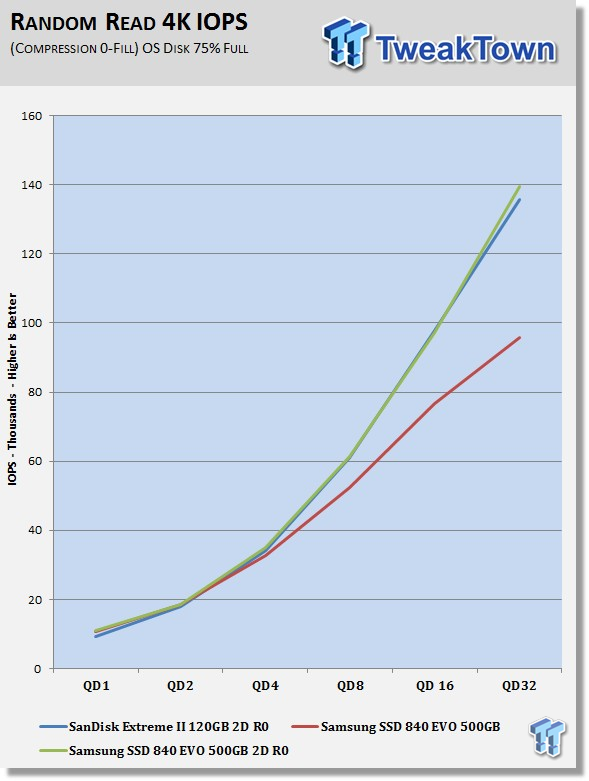
The Extreme II has great 4K QD1 read performance, but the EVO is in a league of its own, especially when dealing with compressible data.
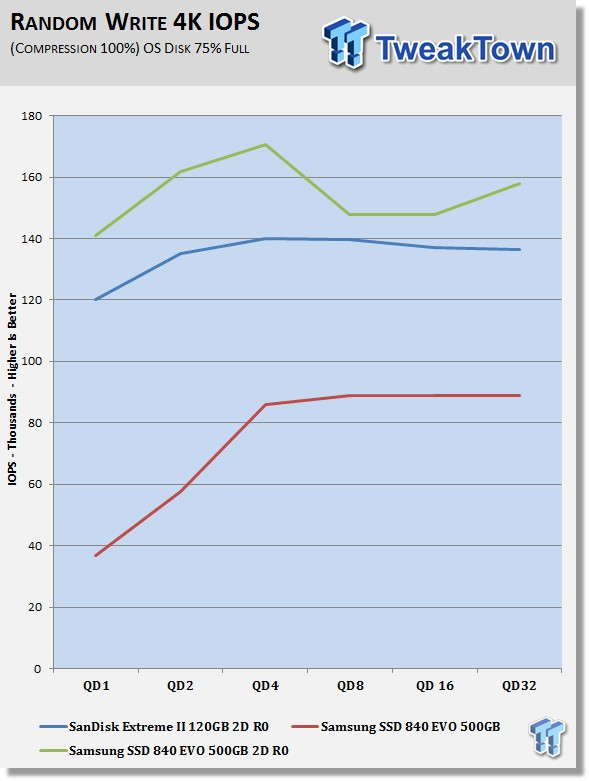
0-Fill Compressible Write IOPS through Queue Depth Scale
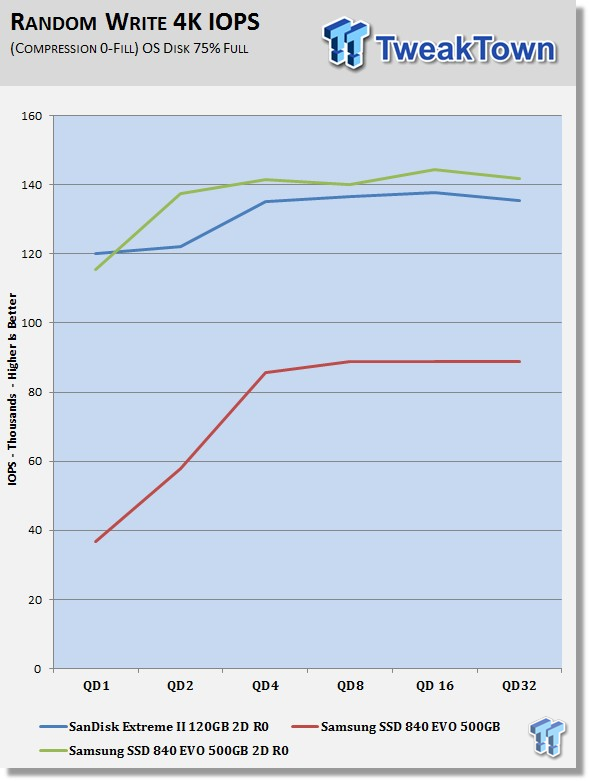
Write caching enables our array to put out three times the performance of a single EVO where it matters most; 4K QD1.
Compression 100% Incompressible Data
Here's the thing, a pair of EVO's is essentially writing at full speed at single queue depths. 571 MB/s at 4K QD1 is astounding performance, especially when you consider we're significantly handicapped by running Windows 8. If we were running Windows 7, 4K QD1 write performance would be well over 700 MB/s.
Incompressible Read IOPS through Queue Depth Scale
For some unknown reason, the EVO does prefer compressible data when reading at 4K QD1. This may be a testing anomaly, and even if it's not, the EVO still has better 4K QD1 incompressible read performance than any drive on the market today.
Incompressible Write IOPS through Queue Scale
Interestingly enough, our write IOPS with incompressible data are significantly better than with compressible data. We're going to chalk this up to differences between runs more than a difference between data types. Samsung's flagship SSD's get faster the more you use them. This defies logic, but it's something I've noticed since the 840 Pro launched.
Benchmarks - CrystalDiskMark
CrystalDiskMark
Version and / or Patch Used: 3.0 Technical Preview
Developer Homepage: http://crystalmark.info
Product Homepage: http://crystalmark.info/software/CrystalDiskMark/index-e.html
Download here: http://crystaldew.info/category/software/crystaldiskmark
CrystalDiskMark is disk benchmark software that allows us to benchmark 4K and 4K queue depths with accuracy.
Key Features:-
* Sequential reads/writes
* Random 4KB/512KB reads/writes
* Text copy
* Change dialog design
* internationalization (i18n)
Note: Crystal Disk Mark 3.0 Technical Preview was used for these tests since it offers the ability to measure native command queuing at 4 and 32.
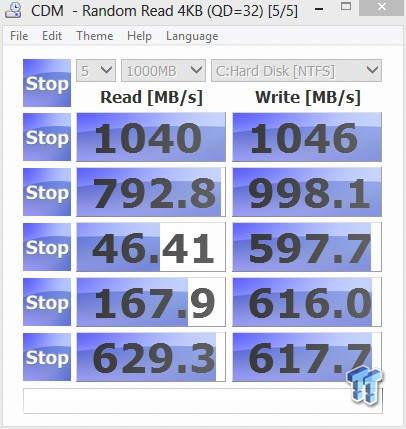
Looks like I grabbed this screenshot before the run was fully complete.
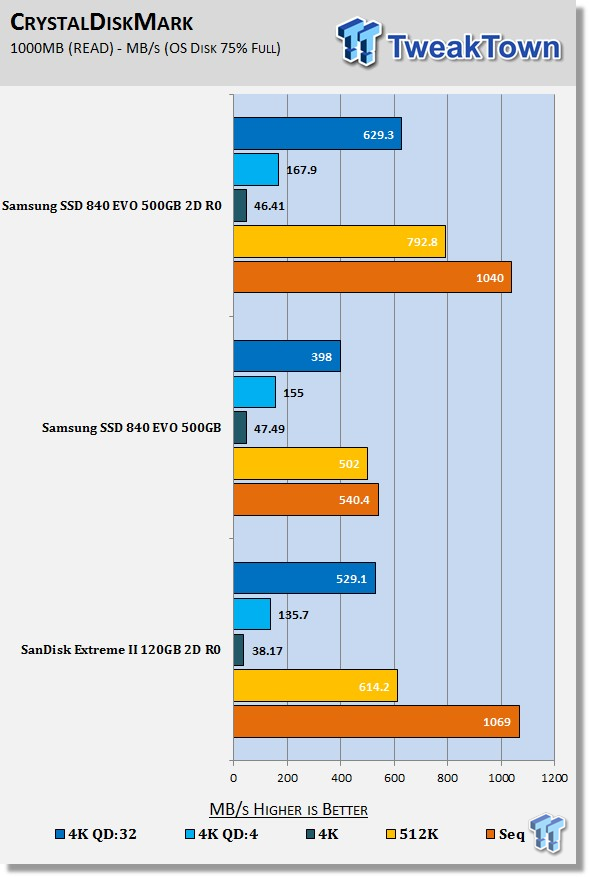
It's most unusual to see 4K QD4 read performance getting a boost from RAID. I've benched probably 50 or more different SATA III arrays and never seen this before.
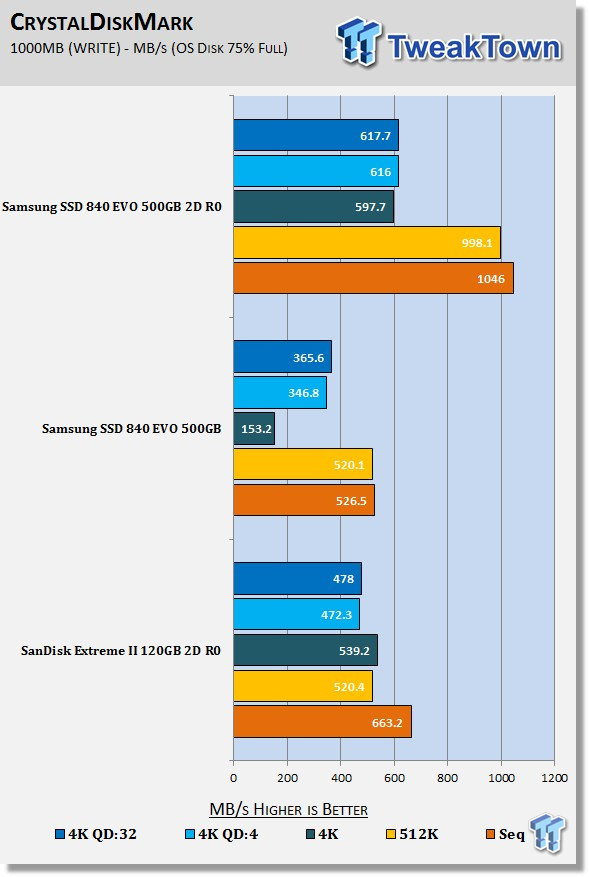
It's hard to believe the EVO has TLC NAND under the hood. Like we saw with our Anvil's testing, our EVO array is running full speed at 4K QD1 writes.
Benchmarks - AS SSD
AS SSD
Version and / or Patch Used: 1.7.4739.38088
Product Homepage: http://alex-is.de/PHP/fusion/news.php
Download here: http://alex-is.de/PHP/fusion/downloads.php
AS SSD determines the performance of Solid State Drives (SSD). The tool contains four synthetic as well as three practice tests. The synthetic tests are to determine the sequential and random read and write performance of the SSD. These tests are carried out without the use of the operating system caches.
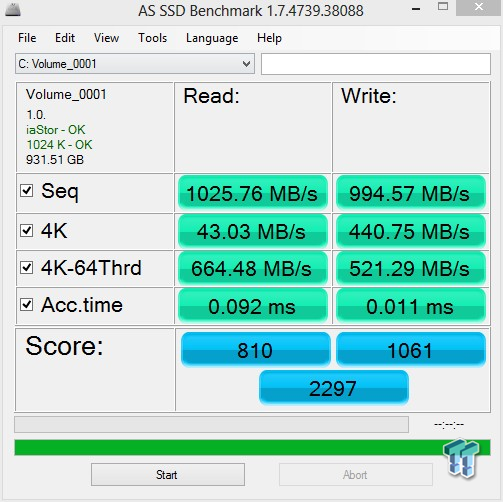
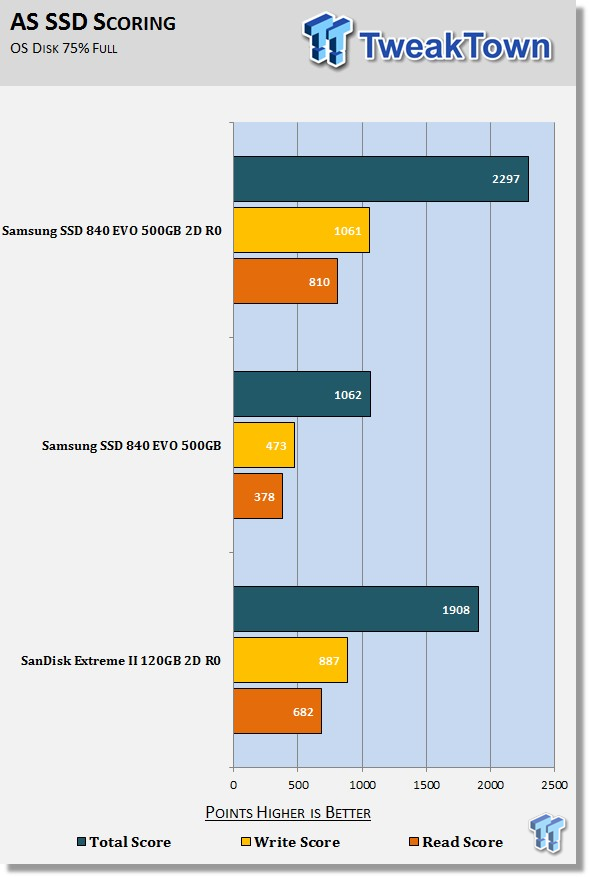
Our two-drive EVO array is able to more than double the score of a single EVO.
Benchmarks - PCMark Vantage
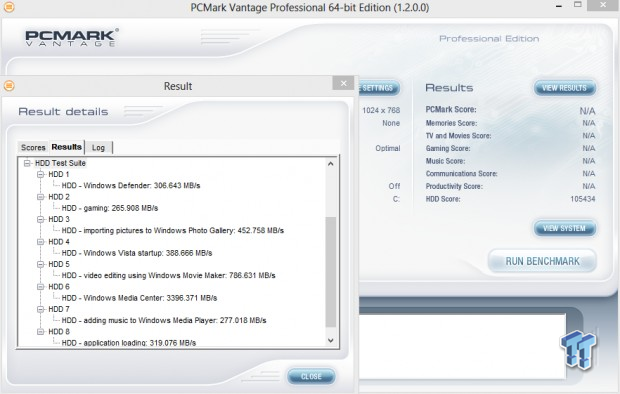
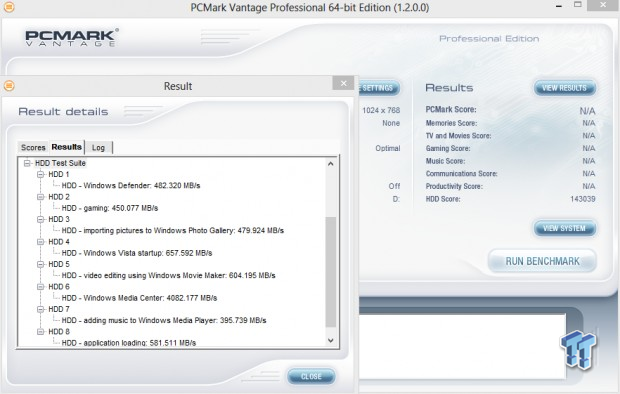
PCMark Vantage - Hard Disk Tests
Version and / or Patch Used: 1.2.0.0
Developer Homepage: http://www.futuremark.com
Product Homepage: http://www.futuremark.com/products/pcmarkvantage

PCMark Vantage is the first objective hardware performance benchmark for PCs running 32 and 64 bit versions of Microsoft Windows Vista. PCMark Vantage is perfectly suited for benchmarking any type of Microsoft Windows Vista PC from multimedia home entertainment systems and laptops to dedicated workstations and high-end gaming rigs. Regardless of whether the benchmarker is an artist or an IT Professional, PCMark Vantage shows the user where their system soars or falls flat, and how to get the most performance possible out of their hardware. PCMark Vantage is easy enough for even the most casual enthusiast to use yet supports in-depth, professional industry grade testing.
The reason we like PCMark Vantage is because the recorded traces are played back without system stops. What we see is the raw performance of the drive. This allows us to see a marked difference between scoring that other trace based benchmarks do not exhibit. An example of a marked difference in scoring on the same drive would be empty vs. filled vs. steady state.
We run Vantage 3 ways. The first run is with the OS drive/Array 75% full to simulate a lightly used OS volume filled with data to an amount we feel is common for most users. The second run is with the OS volume written into a "Steady State" utilizing SNIA's guidelines (Rev 1.1). Steady state testing simulates a drive/arrays performance similar to that of a drive/array that has been subjected to consumer workloads for extensive amounts of time. The third run is a Vantage HDD test with the test drive/array attached as an empty lightly used secondary device.
OS Volume 75% full - Lightly Used
OS Volume 75% full - Steady State

Secondary Volume Empty - Lightly Used
As you can see, there's a big difference between an empty drive/array and one that's 75% full/used and one that's in a steady state.
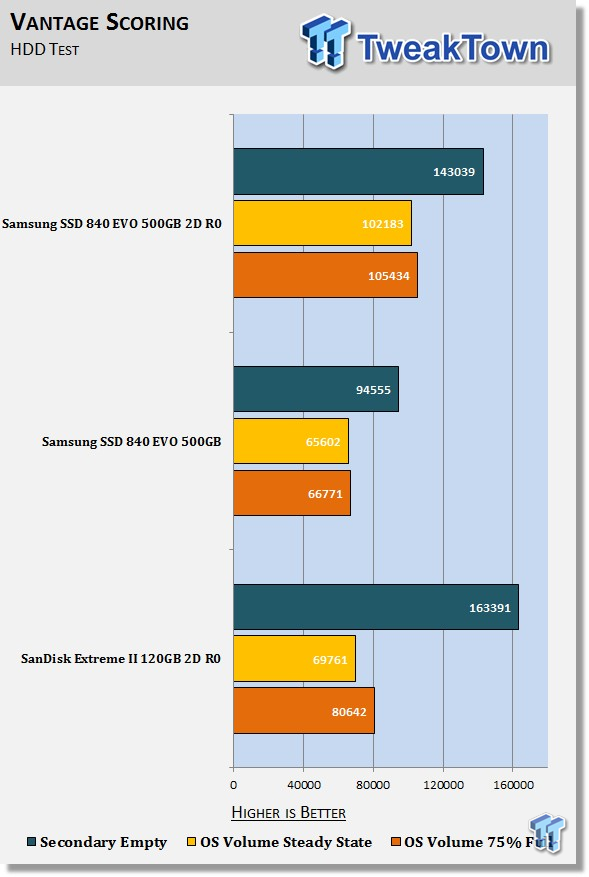
The important scores to pay attention to are "OS Volume Steady State" and "OS Volume 75% full". These two categories are most important because they are indicative of typical of consumer based user states.
A single 500GB EVO has the best 75% full and steady state performance of any drive we've ever tested. Our EVO arrays performance in a steady state is simply remarkable. It's pretty easy to see why a drive/array's empty performance is not a good way to judge its actual performance.
Benchmarks - PCMark 7
PCMark 7 - System Storage
Version and / or Patch Used: 1.4.00
Developer Homepage: http://www.futuremark.com
Product Homepage: http://www.futuremark.com/benchmarks/pcmark7
PCMark 7 includes 7 PC tests for Windows 7 & 8, combining more than 25 individual workloads covering storage, computation, image and video manipulation, web browsing and gaming. Specifically designed to cover the full range of PC hardware from netbooks and tablets to notebooks and desktops, PCMark 7 offers complete PC performance testing for Windows 7 & 8 for home and business use.
We will look to the Raw system storage scoring for RAID 0 evaluations because it's done without system stops and therefore allows us to see significant scoring differences between drives/arrays.
OS Volume 75% full - Lightly Used
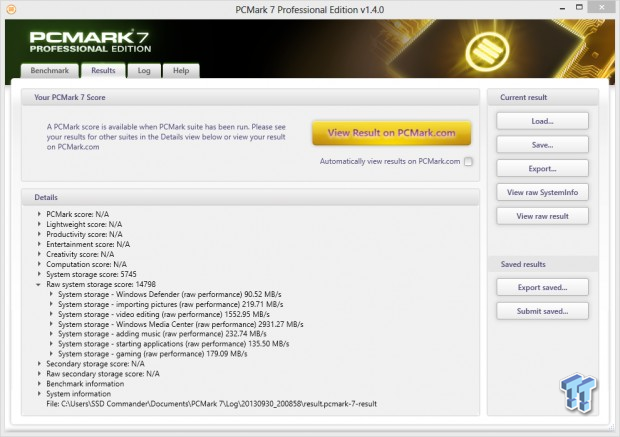
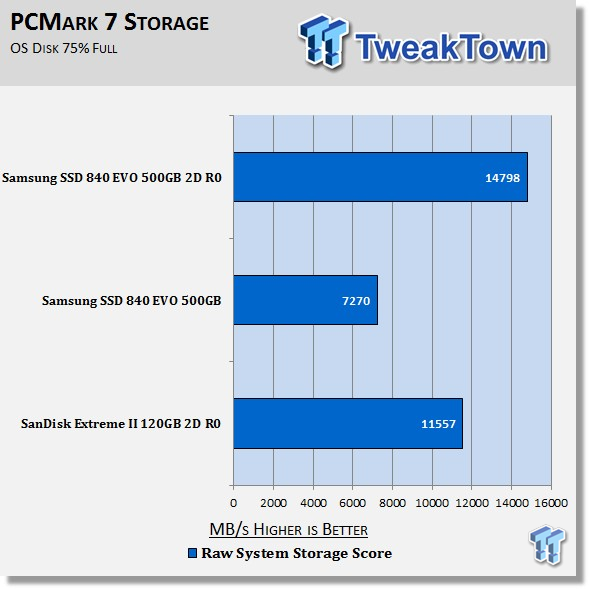
Echoing what we saw with Vantage, our EVO array is capable of incredible real-world performance. The EVO's higher capacity allows our EVO array to easily outperform our smaller capacity Extreme II array.
Secondary Volume Benchmarks - Disk Response Times
Iometer
Version and / or Patch Used: 1.1.0
Product Homepage: http://www.iometer.org
Download here: http://sourceforge.net/projects/iometer
Iometer is an I/O subsystem measurement and characterization tool for single and clustered systems. It was originally developed by the Intel Corporation and announced at the Intel Developers Forum (IDF) on February 17, 1998 - since then it's become wide spread within the storage industry.
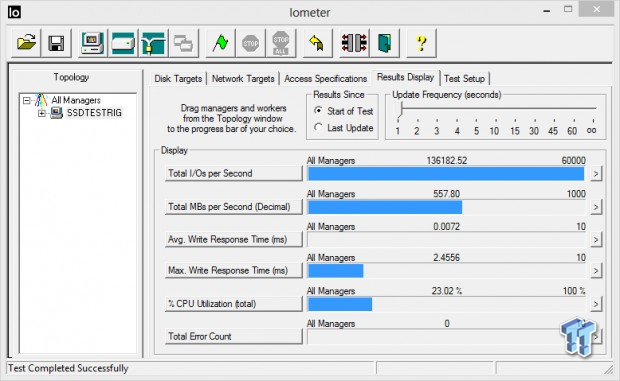
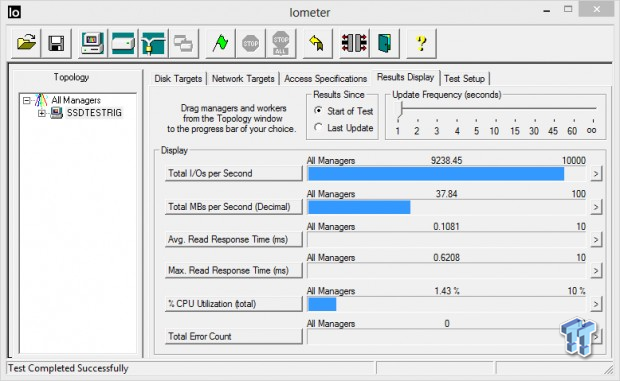
We use Iometer to measure disk response times. Disk response times are measured at an industry accepted standard of 4K QD1 for both write and read. Each test is run twice for 30 seconds consecutively, with a 5 second ramp-up before each test. The drive/array is partitioned and attached as a secondary device for this testing.
Write Response
Read Response
Average Disk Response
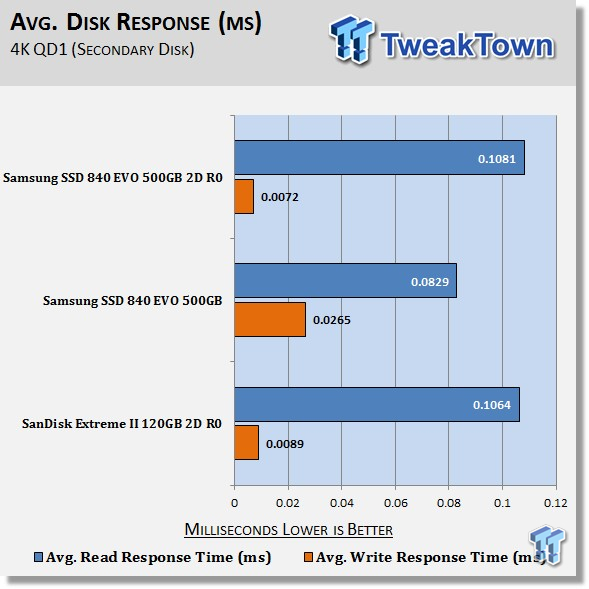
Write response times benefit most from RAID 0. There is a slight latency increase in read response times for an array vs. a single drive.
Maximum Disk Response
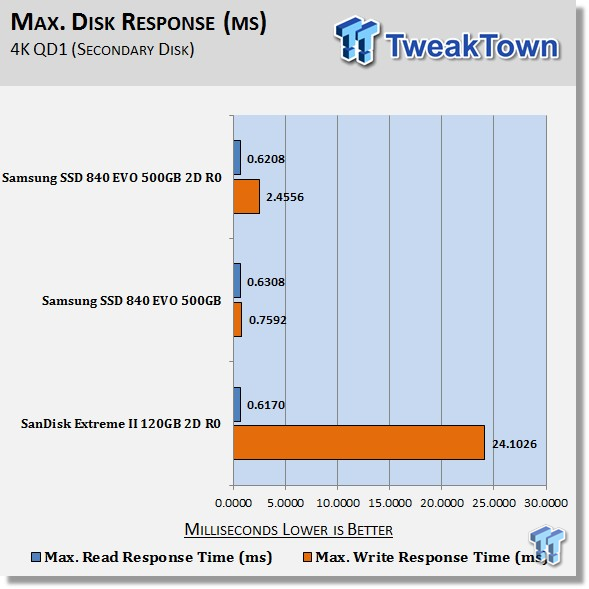
Maximum disk response times are difficult to nail down because they can vary so much from one run to the next, even when running the same drive.
We chart them anyway, because while they may vary from one run to the next, the chart gives us a pretty good overall picture of what to expect from our particular test subject.
Secondary Volume Benchmarks - Blackmagicdesign's Disk Speed Test
Disk Speed Test
Version and / or Patch Used: 2.1.1
Product Homepage: http://www.blackmagicdesign.com
Disk Speed Test is an easy to use tool to quickly measure and certify your disk performance for working with high quality video! Simply click the start button and Disk Speed Test will write test your disk using large blocks of data, and then display the result. Disk Speed Test will continue to test writes and reads from your disk so you can evaluate both performance and readability over time.
We rate a drive/arrays video capabilities by the number of different categories that the device is capable of passing. The maximum number of tests that are possible to pass are 45 write tests and 45 read tests. We chart the number of tests a disk/array is capable of passing for a comparison of one drive/array verses another.
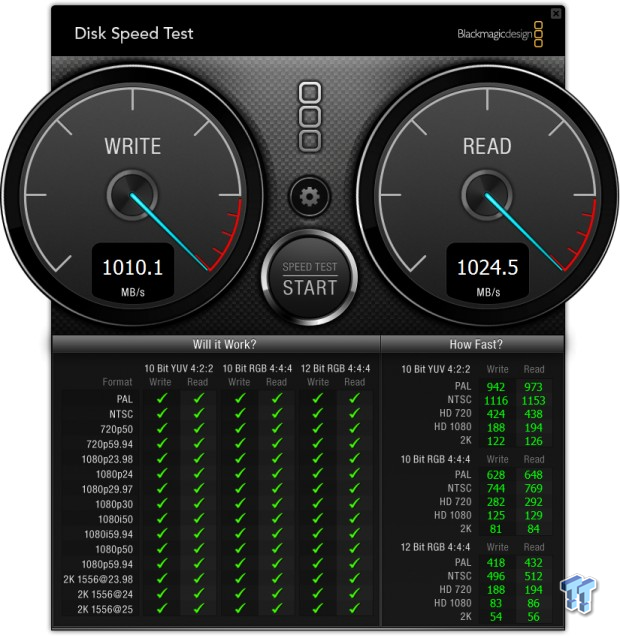
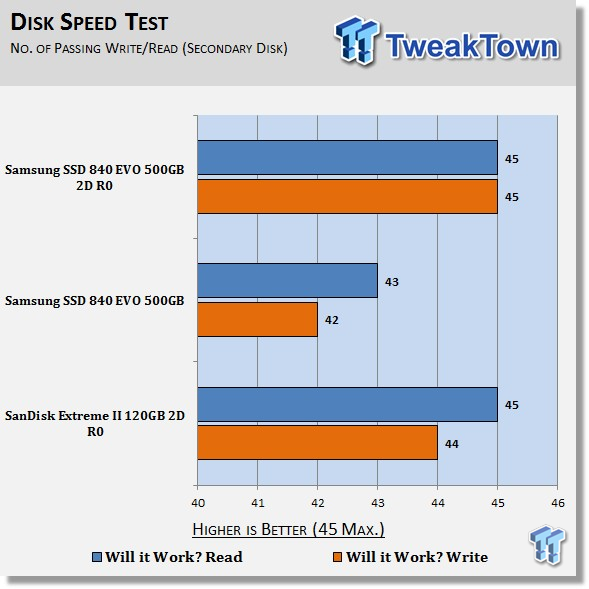
It's very hard for a single drive to be completely HD video capable. This is why serious video processing is almost exclusively done utilizing RAID arrays. A single EVO isn't completely HD video capable and neither is the two-drive Extreme II array, but our two-drive EVO array is.
Secondary Volume Benchmarks - DiskBench
DiskBench - Directory Copy
Version and / or Patch Used: 2.6.2.0
Developer Homepage: Nodesoft
Product Homepage: DiskBench
Download here: http://www.nodesoft.com/diskbench/download
We use DiskBench to time a 28.6GB block (9,882 files in 1,247 folders) of mostly incompressible random data as it's transferred from our OS array to our test drive/array. We then read from a 6GB zip file that's part of our 28.6GB data block to determine the test drive/arrays read transfer rate. The system is restarted prior to the read test to clear any cached data, insuring an accurate test result.
Write Transfer Rate
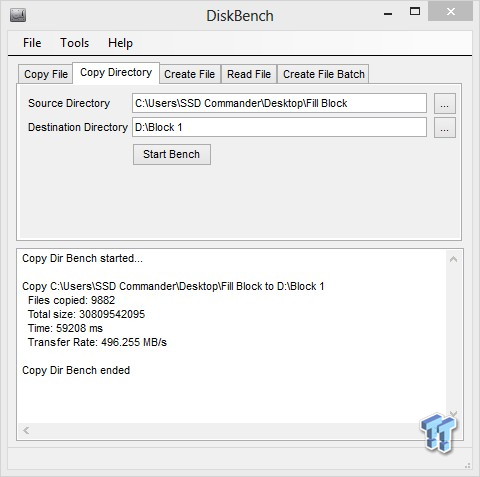
The size of the data block we are using exceeds the EVO's "Turbo Write" capacity. What you are seeing is the transfer capabilities of the TLC NAND outside of the EVO's write acceleration layer.
Read Transfer Rate
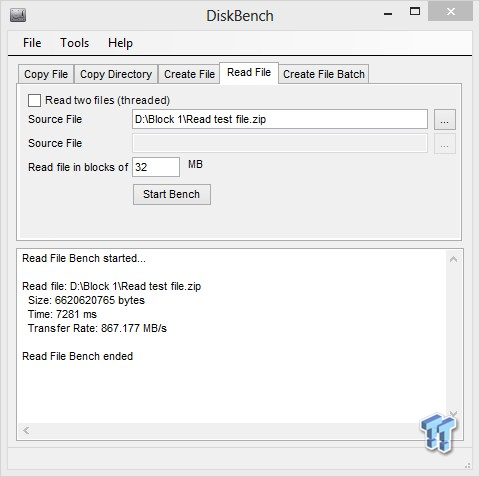
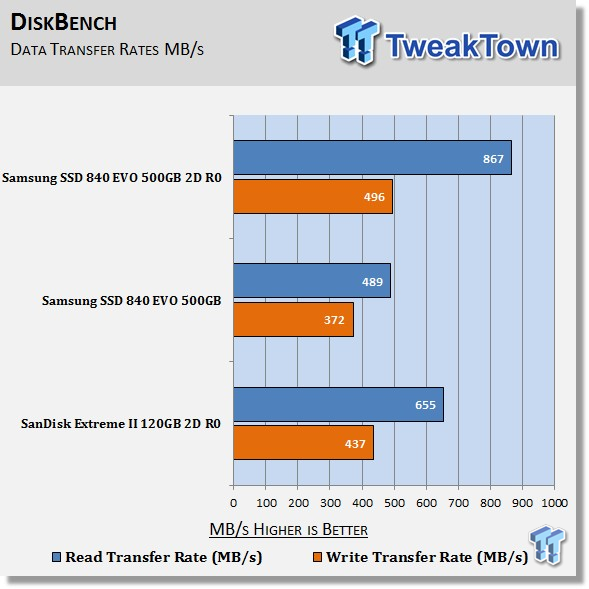
Whatever the real-world scenario may be, an EVO array provides tremendous performance. Synthetic testing like ATTO, CDM etc. show the EVO and Extreme II array having similar sequential read performance. However, real-world read transfers paint a completely different picture.
Final Thoughts
Solid state storage is the most important performance component found in a modern system today. Without it, you do not even have a performance system.
In my opinion, the EVO is truly the next evolution in SSD's. To get class leading performance from TLC NAND is a remarkable achievement. Samsung has raised the bar with its EVO series of drives. Samsung has managed to lay to rest the two primary concerns inherent to TLC NAND; performance and endurance.
The EVO's performance speaks for itself. TLC NAND is capable of providing class leading performance when coupled with an emulated SLC layer. Even TLC NAND's endurance is a non-issue in a typical consumer setting. Endurance testing has shown that a typical consumer/enthusiast will likely never be able to wear out the TLC NAND utilized on the EVO, no matter how long they own it.
Right now there's nothing SATA III based that can outperform Samsung's SSD 840 EVO. Running a pair of 500GB EVO's in RAID is probably the ultimate storage solution for the price available today. For little more than the cost of a 1 terabyte EVO or a 960GB M500, you can have twice the performance to go along with all that luscious capacity.
RAIDing two or more drives together provides you with storage that takes performance to the next level and is something I recommend you try. Once you go RAID, there's no going back.
 Biwin M560 2TB SSD Review - Best Overall Retail-Ready DRAMless SSD
 Samsung 990 2TB SSD Review - Ninth Gen QLC at PCIe Gen4 Speeds
 HighPoint Rocket 1604L Gen5 x16 NVMe Software RAID AIC Review: half the price with full 59 GB/s speed
 UGREEN NASync DXP4800 GT Review: powerful 4-bay NAS with AMD Ryzen and dual 10GbE ports
 Phison E37T SSD Controller Exclusive Preview - The Fastest DRAMless SSD Platform Yet
 Anthropic gives thoughts on open-weights models, especially those from China
 Xbox explains why its massive outage locked players out of games they owned
 Take-Two doubles down on GTA 6 release date, expects net bookings to increase by 22%
 Lenovo's Legion C700 is a thin Android handheld built just for local game streaming
 YouTube Premium subscribers in the US will get Peacock Premium bundled for free starting in 2027
 Redditor turns Steam Deck into a spike-covered, taser-equipped fortress to scare off family
 Apple delays its smart glasses to build privacy features rivals don't have
 Xbox console gamers get free copies of Ubisoft titles on PC
 Xbox outage turns ugly as players use Xbox App glitch to download and play titles for free
 Xbox servers go down just days after PlayStation outage, giving us a glimpse into our digital-only future
 Logitech G512 X 98 Analog Mechanical Gaming Keyboard Review - An Innovative Two-in-One
 Thrustmaster T.Flight HOTAS 5 MSFS Edition Review
 SteelSeries Arctis Nova Pro Omni Wireless Headset Review - One Headset to Rule Them All
 SteelSeries Arctis Nova 7 Wireless Gen 2 Headset Review - New and Improved, But Is It Enough?
 AMD Ryzen 7 7700X3D Review - Days of Future Past
 ASUS ExpertBook Ultra (Panther Lake) 14" Business Laptop Review
 ASUS ROG Raikiri II Xbox Wireless Controller Review - Ready to Take Control
 MOZA FMP18 Panel Bundle Review: authentic F/A-18 Hornet cockpit controls for flight sims
 Printer Not Working in Windows? How to fix detection, print queues and drivers
 The Ultimate Guide to Personalizing Your Windows 11 Taskbar
 How to Turn Your Windows Laptop Into a Second Monitor with Miracast and Wireless Display in Minutes
 6 Mistakes to Avoid When Buying a Windows Laptop
 I capped Windows Update's bandwidth with Delivery Optimization, and my downloads stopped choking
 I use this decade-old free tool that finds files faster than Windows Search does
 I install and update most of my apps with this Windows command now, and I stopped downloading sketchy installers
 Hisense U6SF 65-inch MiniLED TV: High Performance Meets Leisurely Convenience
 I stopped digging through Windows menus after I set up this one folder
 Don't sell your Windows laptop until you do these things