


Our Verdict
Introduction, Drive Specifications, Pricing and Availability
The codename "Polaris" is a hot topic these days. The "Polaris" most people have on their mind is AMD's brand new low-cost high-performance GPU. However, there is another "Polaris" that the storage enthusiast community has been on the edge of their seats waiting for. Well, now it has arrived. Samsung's newest M.2 NVMe SSD, the SM961, is their first client SSD to feature Samsung's Polaris SSD controller. We in the storage community caught wind of Samsung's OEM SM961 at CES back in January of this year. What immediately grabbed our attention was the massive sequential read/write speeds that were given: 3200 MB/s sequential read and 1800 MB/s sequential write. Those sequential speeds are attention grabbing because they are by far the highest ever given for a client SSD, and all that speed is packed onto a tiny M.2 form factor.
Samsung's OEM SM961 NVMe M.2 SSD is full of first's for a Samsung SSD. In addition to a new SSD controller, Samsung's SM961 affords us our first look at Samsung's new 48-layer MLC flash. Samsung's 256Gbit 48-layer flash packs enough density that all capacity points in the SM961 series to come in a single sided 2280 M.2 form factor; including the 1TB model. As notebooks, 2-in-1 systems, and tablets continue to get thinner, the need for high capacity single sided M.2 SSDs has become more pronounced.
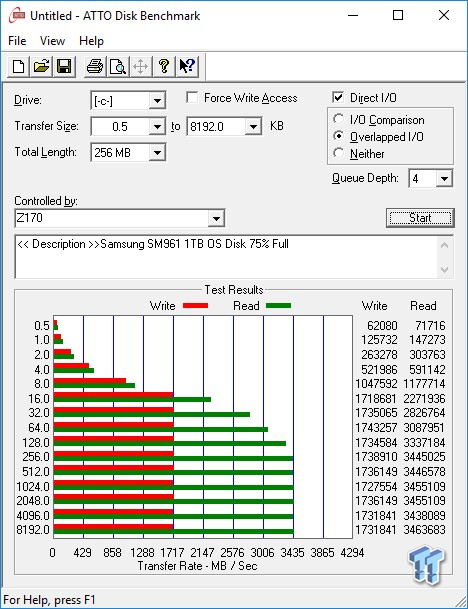
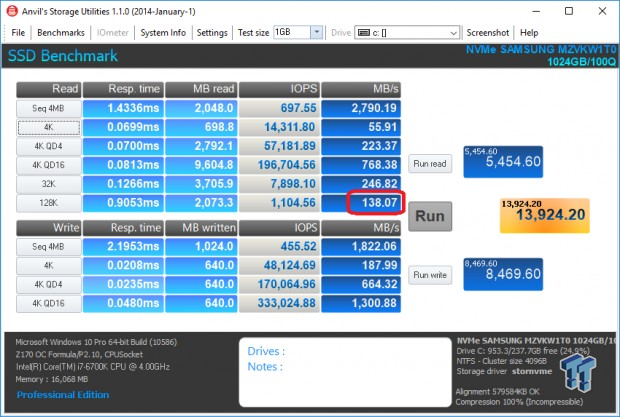
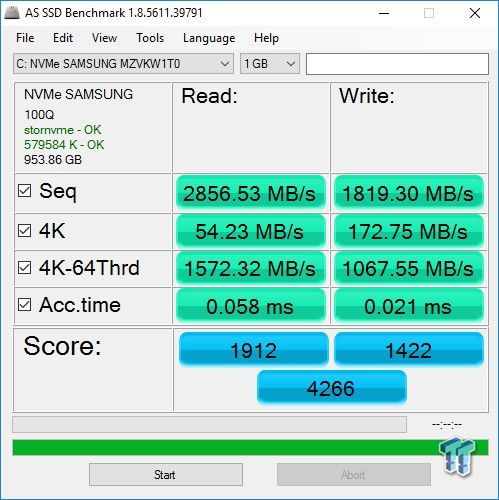
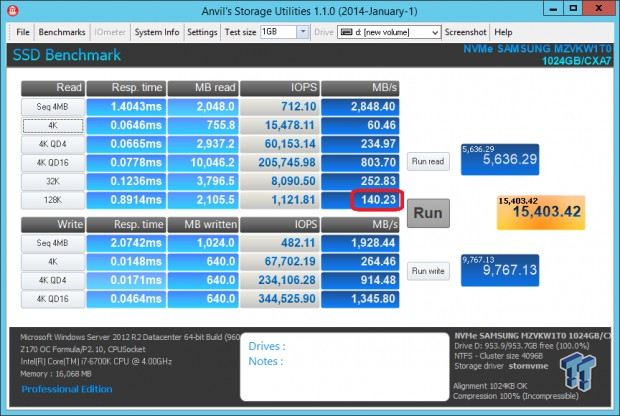
At this time, we know very little about Samsung's Polaris NVMe controller. It is rumored to have a 5-core CPU, but we haven't been able to confirm whether or not this is factual. Five-cores does seem plausible considering the substantial sequential speed increase in comparison to the 3-core Samsung UBX NVMe controller it is replacing. Samsung's given sequential specifications for the SM961 are downright amazing; however, we immediately found out that the 3200/1800 MB/s sequential speeds are actually conservative figures. Here is a screenshot of the first "test hit" we ran after receiving our 1TB SM961 from the Australian memory upgrade specialists RamCity:
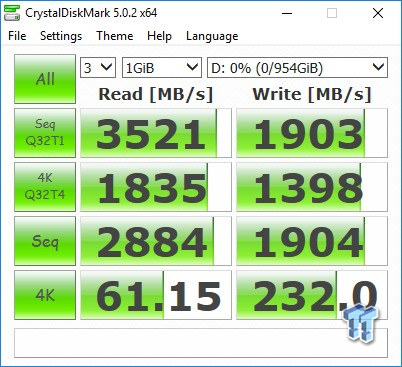
The first thing that jumps out is, of course, the otherworldly sequential read speed of over 3500 MB/s. To put that kind of speed into perspective, it is 800 MB/s faster than any client/consumer SSD we've ever tested. 3500 MB/s sequential read performance is even faster than all but one enterprise SSD we've tested. The 1900 MB/s sequential write speed is nearly as impressive in its own right, a full 100MB/s faster than factory specification and 400 MB/s faster than Samsung's own 950 Pro 512GB. 4K QD1 random read performance is also eye catching at 61 MB/s.
Samsung's SM961 brings with it a new level of sequential performance. Typically, with an increase in performance comes an increase in price. In the case of Samsung's SM961, the opposite is occurring. The SM961 at launch is priced significantly lower than the SM951 it is replacing. As it stands, Samsung's SM961 is by far the lowest cost MLC powered M.2 NVMe SSD on the market. We paid $639.99 AUD for the 1TB SM961, which as of June 30, 2016, converts to just $476.82 USD. As a bonus, there were no taxes to be paid when ordering from the USA.
Our experience ordering from RamCity is as good as it gets. RamCity might be half a world away, but they still manage to deliver a buyer's experience that is a cut above anyone we've ever dealt with. Three-day shipping was a mere $26 AUD ($19.35 USD), we received email updates and tracking info every step of the way. RamCity's upgrade experts even reached out to see if we needed any assistance with upgrading to the SM961. Our order shipped and arrived right on schedule.
So far, we've been unable to get our hands-on an official data sheet, so everything we know about Samsung's SM961 1TB M.2 NVMe SSD is a result of piecing together available information coupled with our own research.
Our Latest SSD Review Coverage
- Phison E37T SSD Controller Exclusive Preview - The Fastest DRAMless SSD Platform Yet
- Seagate FireCuda X1070 4TB SSD Review - A New Mainstream Contender
- Micron 3610 2TB SSD Review - DRAMless QLC at 11,000 MB/s
- SK hynix Platinum P51 2TB SSD Review - A Powerful Gen5 Alternative
- Biwin Black Opal X570 Pro 8TB SSD Review - Massive Capacity with Elite Performance
Specifications
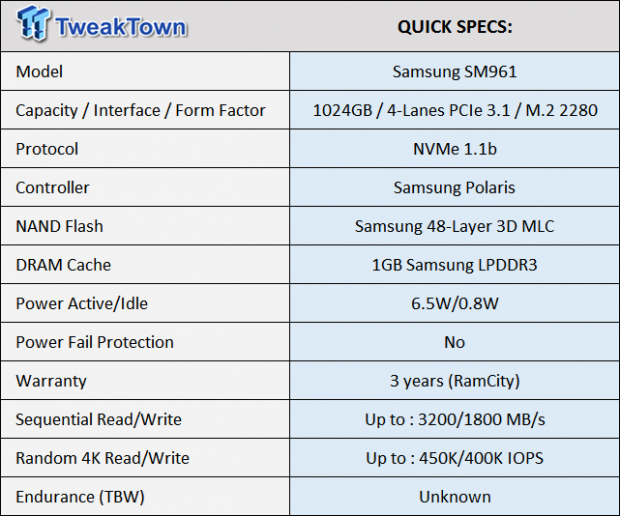
Samsung's OEM SM961 M.2 x 2280 NVMe SSD is available in four capacities: 128GB, 256GB, 512GB, and 1024GB (1-terabyte). We will go over the specifications for the 1TB model we have on hand.
4K Random Read / Write = up to 450K/400K IOPS. Sequential Read / Write = up to 3200 / 1800 MB/s. Typical power consumption = 6.5W Active/ 0.8W idle. Controller = Samsung Polaris NVMe controller. NAND = 2bit Samsung 48-layer VNAND. DRAM Cache = 1GB on the 1TB model. Onboard Power-loss Protection = No.
RamCity warranties the SM961 for three years. TBW = Unknown. We are not absolutely sure of the 400K random write IOPS figure. We did see that figure in several published images, and it is listed on RamCity's spec sheet. However, we were not able to get over 347K IOPS with our configuration, even though we were able to greatly exceeded 450K random read IOPS.
Drive Details
Samsung SM961 1TB M.2 NVMe PCIe SSD
RamCity ships the SM961 in a small brown cardboard flip top box.
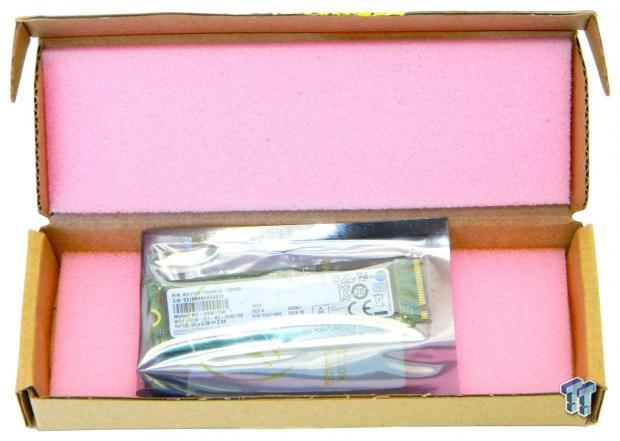
The drive is contained within a sealed anti-static envelope, sandwiched between two layers of foam padding.
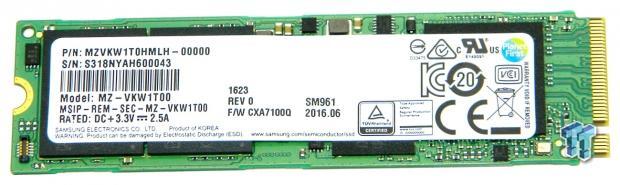
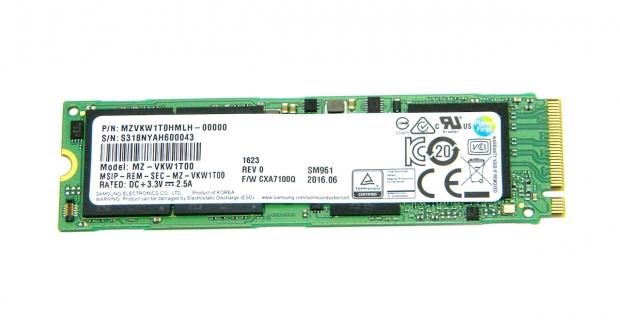
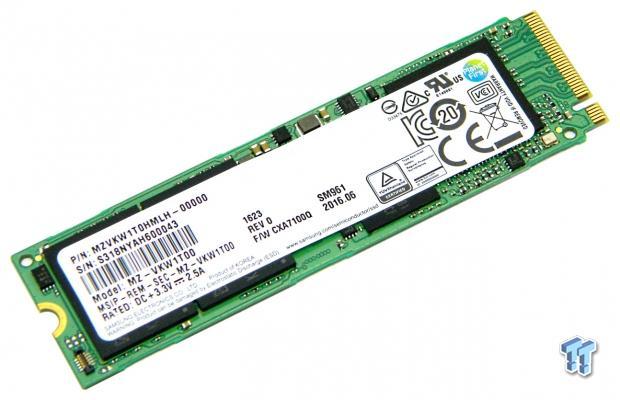
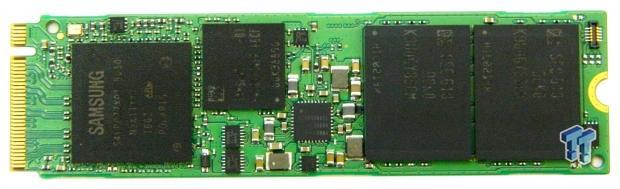
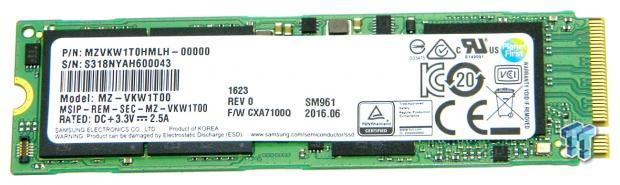
This side of the drive houses all of the drive's components. There is a manufacturer's label that lists the drive's part number, model number, serial number, shipping firmware, and date of manufacture.
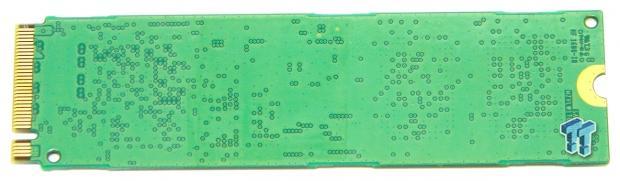
This side of the drive's PCB is completely blank.
A shot of the drive with the manufacturer label removed.
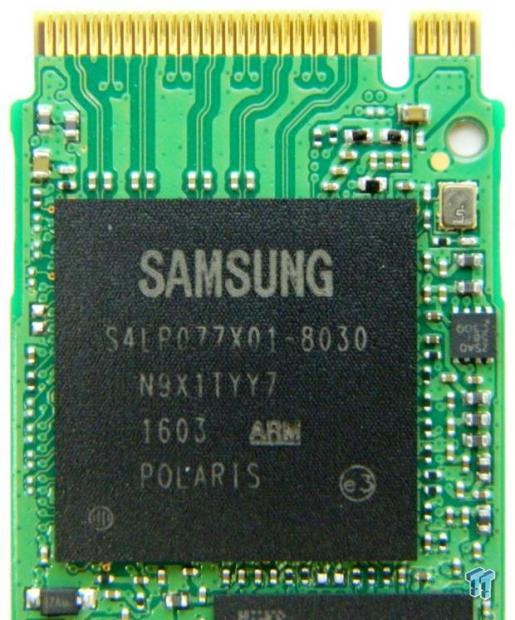
A detailed view of the drive's ARM-based Samsung Polaris controller.

A detailed view of the drive's 1024MB (1GB) LPDDR3 1600MHz DRAM cache package.
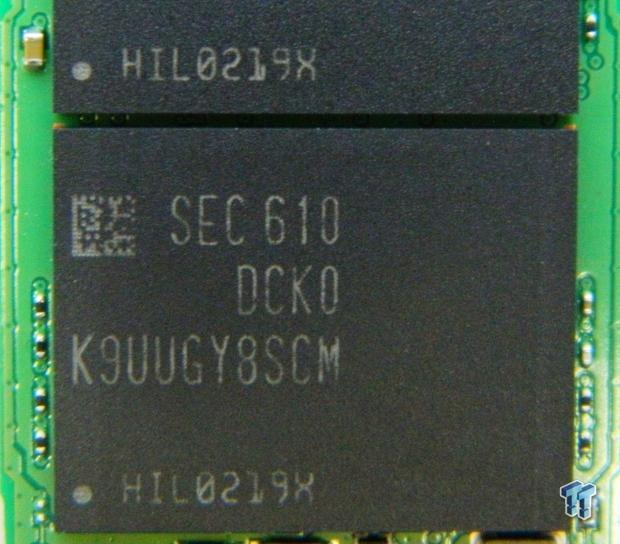
A detailed view of one of the drive's two 512GB Samsung VNAND flash packages.
Test System Setup & Drive Properties
Jon's Consumer PCIe SSD Review Test System Specifications
- Motherboard: ASRock OC Formula Z170 - Buy from Amazon / Read our review
- CPU: Intel Core i7 6700K @ 4.7GHz - Buy from Amazon / Read our review
- Cooler: Swiftech H2O-320 Edge - Buy from Amazon / Read our review
- Memory: Corsair Vengeance LPX DDR4 16GB 3200MHz - Buy from Amazon
- Video Card: Onboard Video
- Case: IN WIN X-Frame - Buy from Amazon / Read our review
- Power Supply: Seasonic Platinum 1000 Watt Modular - Buy from Amazon / Read our review
- OS: Microsoft Windows 10 Professional 64-bit - Buy from Amazon
- Drivers: Intel RAID option ROM version 14.6.0.1029 and OCZ NVMe driver
We would like to thank ASRock, Crucial, Intel, Corsair, RamCity, IN WIN, and Seasonic for making our test system possible.
Drive Properties
Samsung SM961 1TB OS Disk 75% full

The majority of our testing is performed with our test drive as our boot volume. Our boot volume is 75% full for all OS Disk "C" drive testing to replicate a typical consumer OS volume implementation. We feel that most of you will be utilizing your SSDs for your boot volume and that presenting you with results from an OS volume is more relevant than presenting you with empty secondary volume results.
System settings: Cstates and Speed stepping are both disabled in our systems BIOS. Windows High-Performance power plan is enabled. Windows write caching is enabled, and Windows buffer flushing is disabled. We are utilizing Windows 10 Pro 64-bit OS for all of our testing except for our MOP (Maxed-Out Performance) benchmarks where we switch to Windows Server 2012 R2 64-bit.
Synthetic Benchmarks - ATTO & Anvil Storage Utilities
ATTO
Version and / or Patch Used: 2.47
ATTO is a timeless benchmark used to provide manufacturers with data used for marketing storage products.
Sequential read/write transfers max out at an impressive 3,463/1743 MB/s. Keep in mind this is our OS volume, and it is filled to 75% of its total capacity. We note the impressive performance at 4K transfers. The highest sequential read performance is achieved at 8MB transfers. The highest sequential write performance is achieved at 64KB transfers.
Sequential Write

As expected, Samsung's SM961 displays the best sequential write performance of the drives in our test pool. Performance ramps up quickly with the SM961 delivering full performance from 16K transfers on up to 8MB transfers.
Sequential Read

The SM961 represents a paradigm shift in sequential read performance. Nothing else is even close. The SM961 also displays incredible small file performance. The only drive that can hang with the SM961 is Samsung's own 950 Pro 512GB, and even then, it can only hang up to 8KB transfers. After that, the SM961 eviscerates all of the drives in our test pool including the 950 Pro.
Anvil Storage Utilities
Version and / or Patch Used: 1.1.0
Anvil's Storage Utilities is a storage benchmark designed to measure the storage performance of SSDs. The Standard Storage Benchmark performs a series of tests; you can run a full test or just the read or write test, or you can run a single test, i.e. 4k QD16.
Scoring
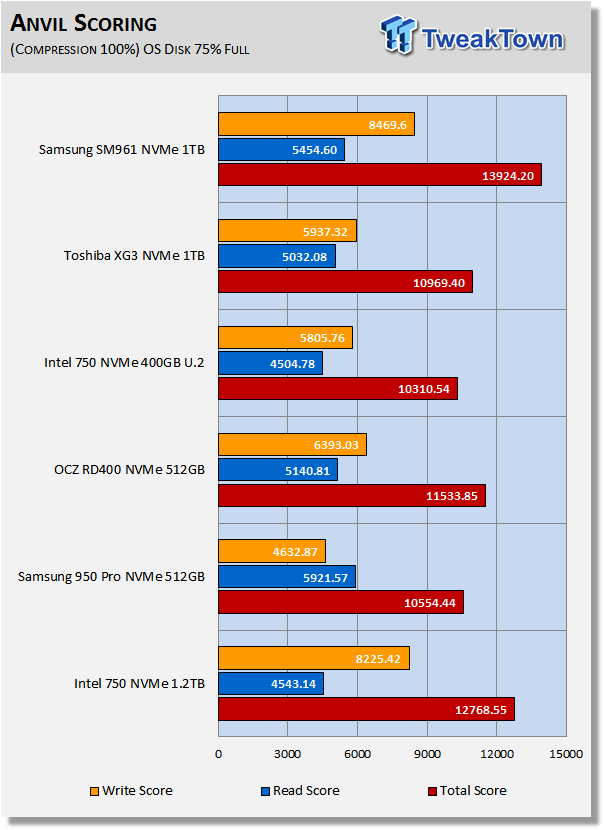
Anvil's scoring gives a good indication of a drive's overall performance. In terms of overall scoring, Samsung's SM961 1TB sets a new lab record for client/consumer SSDs. All of the scoring increase in comparison to the 950 Pro is coming from the write portion of the test. Some from sequential write but the bulk is coming from the much higher 4K random performance at QD4 and QD16.
Read scoring is down significantly in comparison to the 950 Pro. Most of the lower read score stems from the 128K portion of the test. We highlighted the result of 138.07 MB/s as it is far lower than we get from most drives. For example, the 950 Pro cranks out 811.53 MB/s in the same 128K portion of this test. We aren't sure what the cause of this anomaly is; we are just pointing it out.
(Anvil) Read IOPS through Queue Depth Scale

The SM961 dominates this testing up to QD64, displaying a much better performance curve than the rest of the drives in our test pool. The SM961 flattens out at QD64 and finishes the test with 447K IOPS at QD128. Intel's 750 1.2TB finishes the test with 470K IOPS at QD128. However, the SM961 delivers a far better performance curve than Intel's 750 1.2TB and overall easily wins this test.
(Anvil) Write IOPS through Queue Scale

The Intel's 1.2 TB 750 has the best performance up to QD4. At QD8-64, the SM961 leaves the Intel 750 1.2TB behind. OCZ's RD400 maintains a slight lead over the SM961 from QD1-2. The SM961 outperforms the 950 Pro from start to finish. At QD64, the SM961 is cranking out 237K more IOPS than the 950 Pro.
Synthetic Benchmarks - CrystalDiskMark & AS SSD
CrystalDiskMark
Version and / or Patch Used: 3.0 Technical Preview
CrystalDiskMark is disk benchmark software that allows us to benchmark 4k and 4k queue depths with accuracy. Note: Crystal Disk Mark 3.0 Technical Preview was used for these tests since it offers the ability to measure native command queuing at QD4.
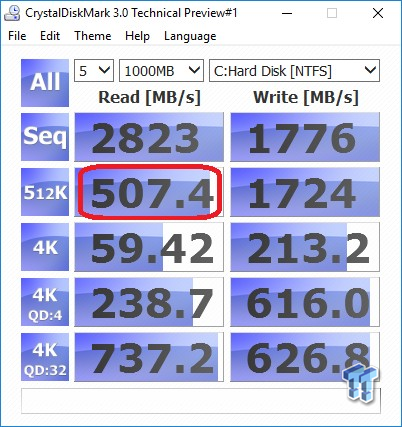
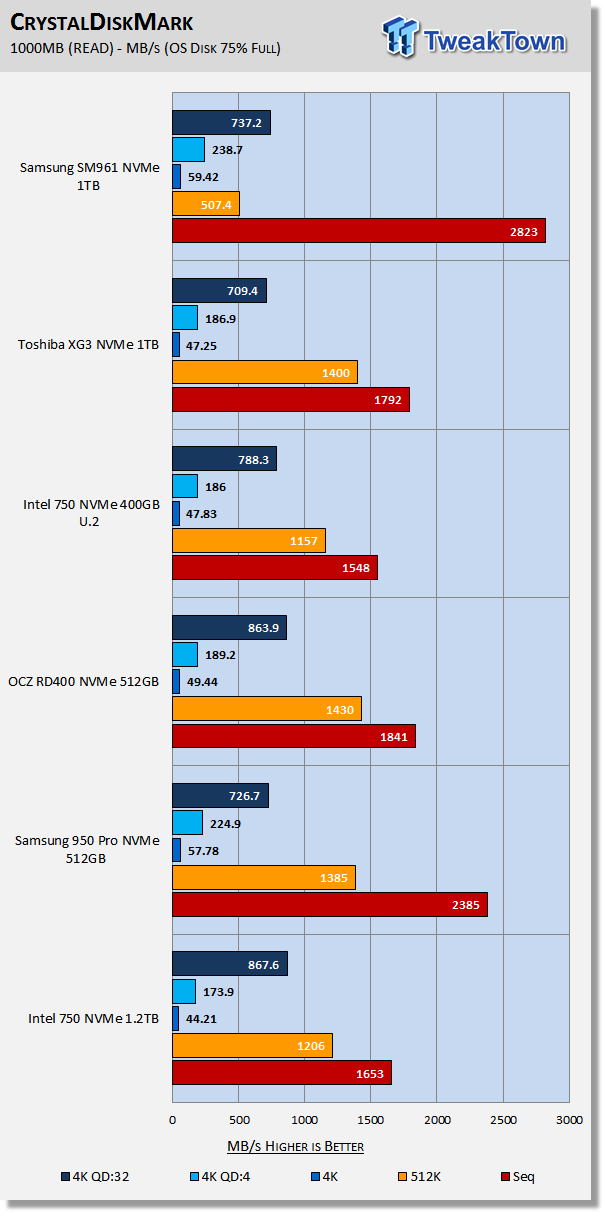
With this version of CDM, sequential performance is measured at QD1, which is the reason sequential rates are so much lower than the CDM we posted in our intro. This version of CDM measures performance at 512K, and again we note an unexplainable anomaly with the SM961. The SM961 is only able to muster 507.4 MB/s with 512K read transfers. This is far below that of the rest of the drives in our test pool. The SM961, as expected, sets a new lab record for sequential read/write performance with a spectacular 2823/1776 MB/s. Additionally, the SM961 another lab record at 4K QD4.

The SM961 sets two more lab records; sequential write and 512K write. The SM961 kicks out decent 4K random performance, much better than the 950 Pro at 4K QD4 and QD32, however, the OCZ RD400 and the Intel 750 deliver superior 4K random write performance.
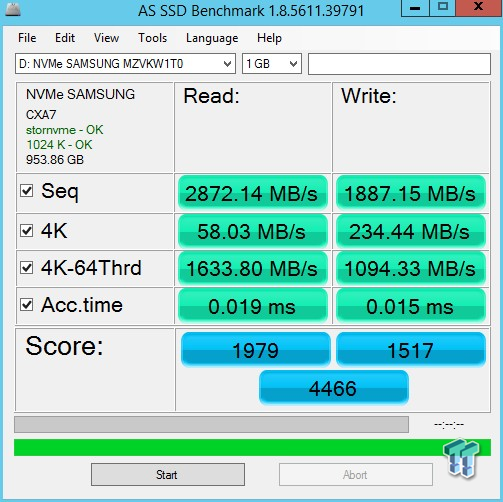
AS SSD
Version and / or Patch Used: 1.7.4739.38088
AS SSD determines the performance of SSDs. The tool contains four synthetic as well as three practice tests. The synthetic tests are to determine the sequential and random read and write performance of the SSD.

AS SSD is a demanding test, and the SM961 dispatches it with ease; setting yet another lab record. We are a bit surprised by this remarkable score and the fact that our long time champion, Intel's 750 1.2TB, is handily outperformed in this particular test by a tiny M.2 SSD with only two flash packages.
Benchmarks (OS) - PCMark Vantage, PCMark 7 & PCMark 8
Moderate Workload Model
We categorize these tests as indicative of a moderate workload environment.
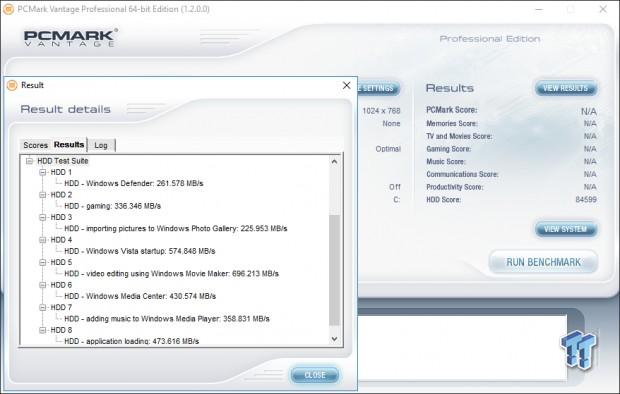
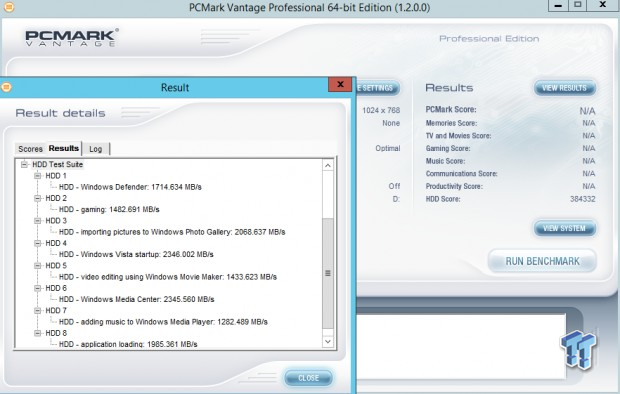
PCMark Vantage - Hard Disk Tests
Version and / or Patch Used: 1.2.0.0
The reason we like PCMark Vantage is because the recorded traces are played back without system stops. What we see is the raw performance of the drive. This allows us to see a marked difference between scoring that other trace-based benchmarks do not exhibit. An example of a marked difference in scoring on the same drive would be empty vs. filled vs. steady state.
We run Vantage three ways. The first run is with the OS drive 75% full to simulate a lightly used OS volume filled with data to an amount we feel is common for most users. The second run is with the OS volume written into a "Steady State" utilizing SNIA's consumer guidelines. Steady state testing simulates a drive's performance similar to that of a drive that been subjected to consumer workloads for extensive amounts of time. The third run is a Vantage HDD test with the test drive attached as an empty, lightly used secondary device.
OS Volume 75% Full - Lightly Used

OS Volume 75% Full - Steady State
Secondary Volume Empty - FOB

There's a big difference between an empty drive, one that's 75% full/used, and one that's in a steady state.
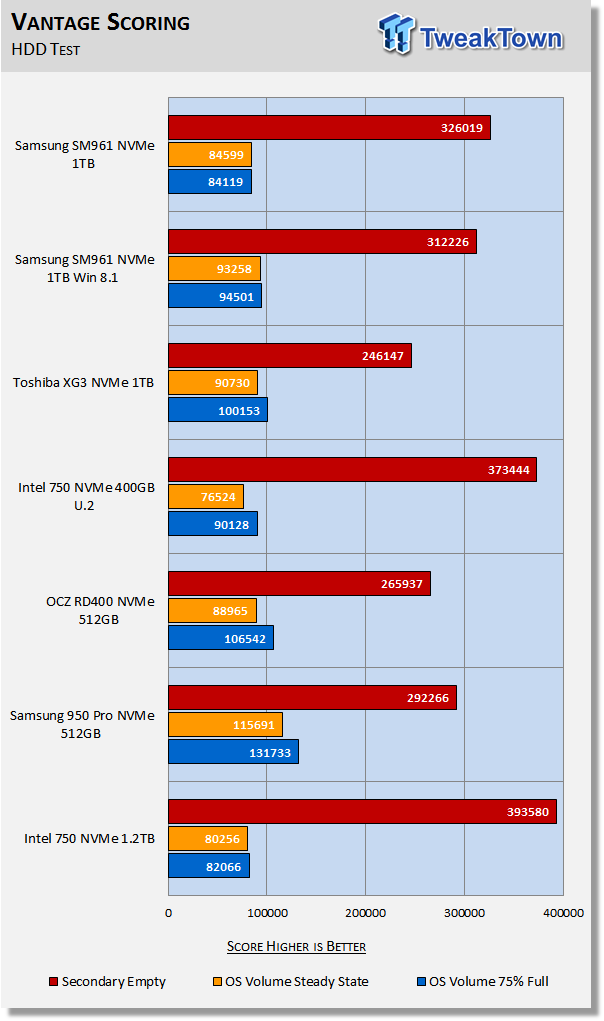
The important scores to pay attention to are "OS Volume Steady State" and "OS Volume 75% full." These two categories are most important because they are indicative of typical of consumer user states. When a drive is in a steady state, it means garbage collection is running at the same time it's reading/writing. This is exactly why we focus on steady state performance.
With the anomalies we saw with Anvil's, CDM, and now an unexpectedly low score with Vantage in a steady-state, we began to wonder if the Windows 10 NVMe driver could be part of the problem.
We had already run our Maxed Out Performance benchmarks with Server 2012, and they are much better than Windows 10 results. So much better in fact that it points to the Windows 10 NVMe driver, or Windows 10 itself, being a potential issue. Windows 10 and Server 2012 have different versions of Microsoft's standard NVMe driver. Server 2012 and Windows 8.1 share a common NVMe driver. Unfortunately, there is not a dedicated Samsung NVMe driver that is compatible with the SM961, at least not yet.
We decided to load up Windows 8.1 to see if steady-state performance would improve. Windows 8.1 yielded much better results, indicating that potentially, the Windows 10 NVMe driver is at least part of the reason the SM961 is not delivering the kind of results we expected to see from the SM961 with moderate workloads.
With Windows 8.1, the SM961 gained 9K in scoring and went from a fourth-place steady-state result to a second place steady-state result, surpassing OCZ's potent RD400 and Toshiba's XG3. We are not fans of using Windows 8.1 for our testing purposes because it is becoming more irrelevant with each passing day, but for investigative purposes, we decided to utilize it as a comparison point with our moderate workload testing.
PCMark 7 - System Storage
Version and / or Patch Used: 1.4.0
We will look to Raw System Storage scoring for evaluation because it's done without system stops and, therefore, allows us to see significant scoring differences between drives.
OS Volume 75% Full - Lightly Used
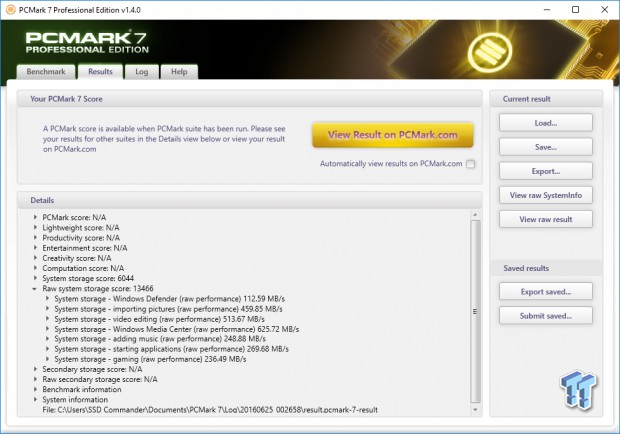

We will admit, we were expecting to see the SM961 outperform the 950 Pro with moderate workloads, but without a dedicated driver, it looks like that is not going to happen. Again, we can see that the Windows 8.1 NVMe driver, or maybe it's just the OS itself, delivering a substantial performance increase over Windows 10.
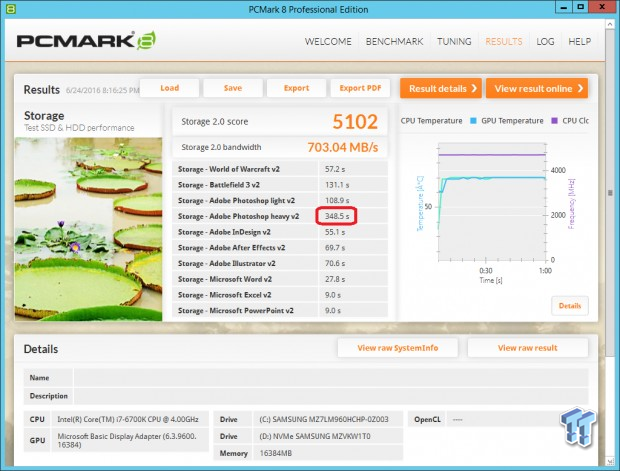
PCMark 8 - Storage Bandwidth
Version and / or Patch Used: 2.4.304
We use PCMark 8 Storage benchmark to test the performance of SSDs, HDDs, and hybrid drives with traces recorded from Adobe Creative Suite, Microsoft Office, and a selection of popular games. You can test the system drive or any other recognized storage device, including local external drives. Unlike synthetic storage tests, the PCMark 8 Storage benchmark highlights real-world performance differences between storage devices.
OS Volume 75% Full - Lightly Used
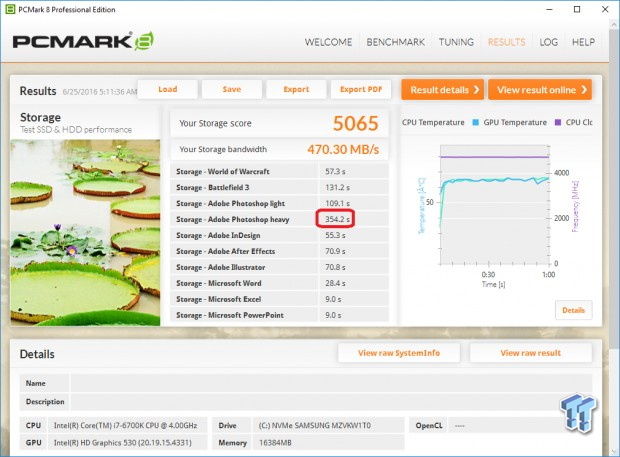

PCMark 8 is the most intensive moderate workload simulation we run. With respect to moderate consumer type workloads, this test is what we consider the best indicator of a drive's performance. Running Windows 8.1 takes the SM961 from last to second best. Windows 8.1 makes a huge difference in this test. We know that this disparity in performance isn't unique to our setup because we know of others who have experienced the same phenomenon with similar SM961/Z170/Win 10 configurations.
We highlighted the performance of "Photoshop Heavy" on our screenshot because it is about six seconds more (worse) than we are getting from Win 8.1 and Server 2012. We feel this is where the majority of the bandwidth disparity we are seeing stems from.
Benchmarks (Secondary) - IOPS, Response & Transfer Rate
Iometer - Maximum IOPS
Version and / or Patch Used: Iometer 2014
We use Iometer to measure high queue depth performance. (No Partition)
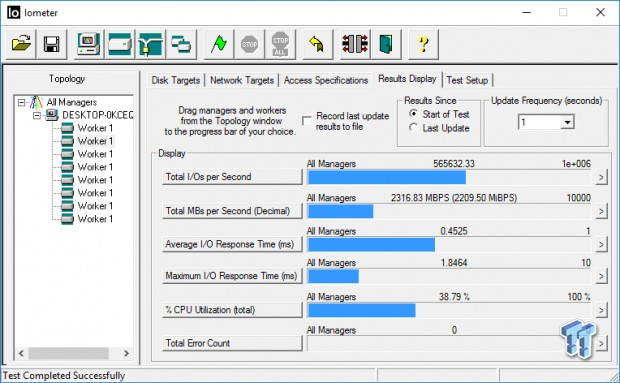
Max IOPS Read
Max IOPS Write
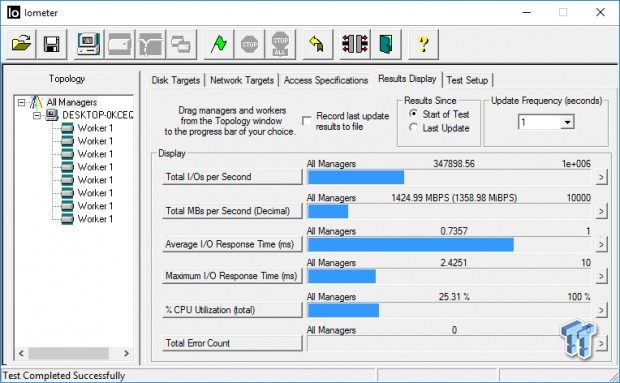
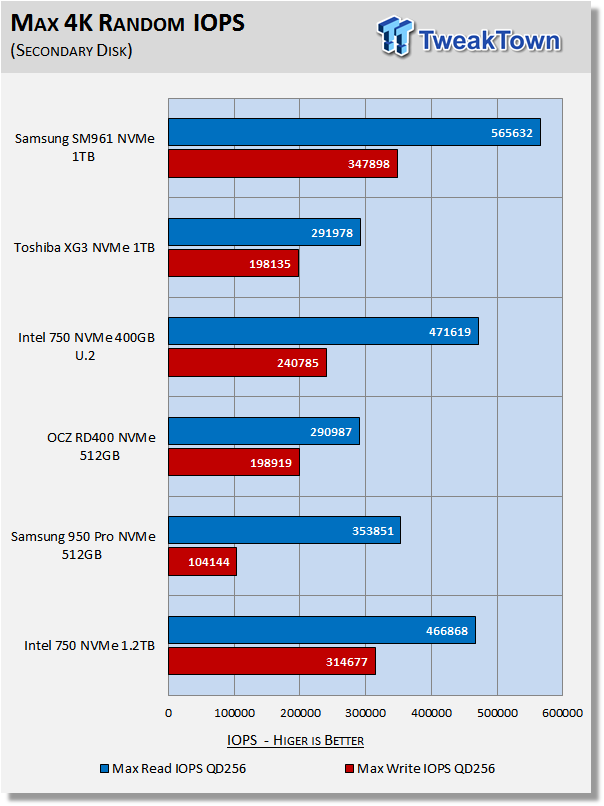
Purported factory specifications list the SM961 1TB as capable of up to 450K/400K 4K random read/write IOPS. At QD256, with our configuration, we are able to greatly exceed the reported maximum 450K read IOPS. We are able to hit a whopping 565K 4K random read IOPS. Maximum write IOPS is reportedly 400K, but the best we could achieve is just under 348K IOPS. We've seen other reports that state 320K as the maximum 4K random write IOPS for the 1TB SM961, which is more in line with our results.
It's been a long run with the 750 Series dominating our 4K random testing and today that has come to an end. Samsung's tiny M.2 form factor SM961 sets two more lab records with its incredible high-QD 4K random performance.
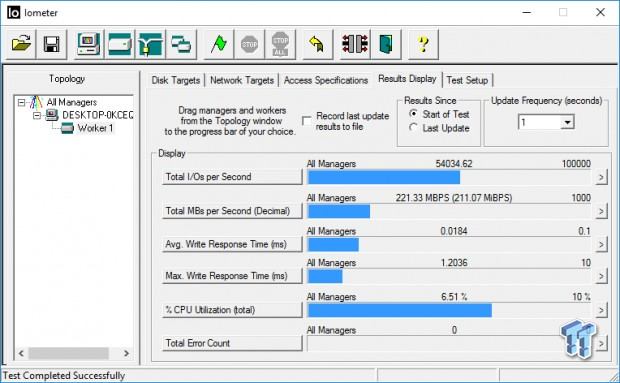
Iometer - Disk Response
Version and / or Patch Used: Iometer 2014
We use Iometer to measure disk response times. Disk response times are measured at an industry accepted standard of 4K QD1 for both write and read. Each test runs twice for 30 seconds consecutively, with a 5-second ramp-up before each test. We partition the drive/array as a secondary device for this testing.
Avg. Write Response
Avg. Read Response
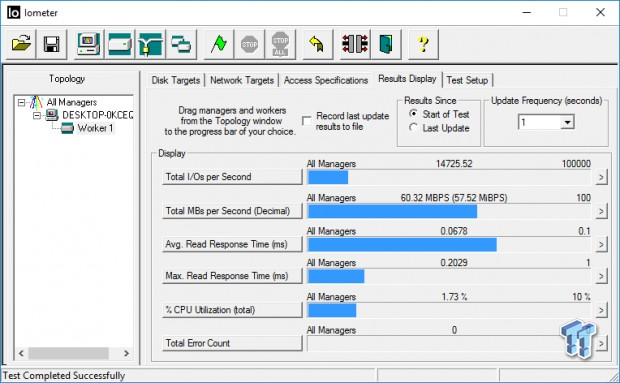
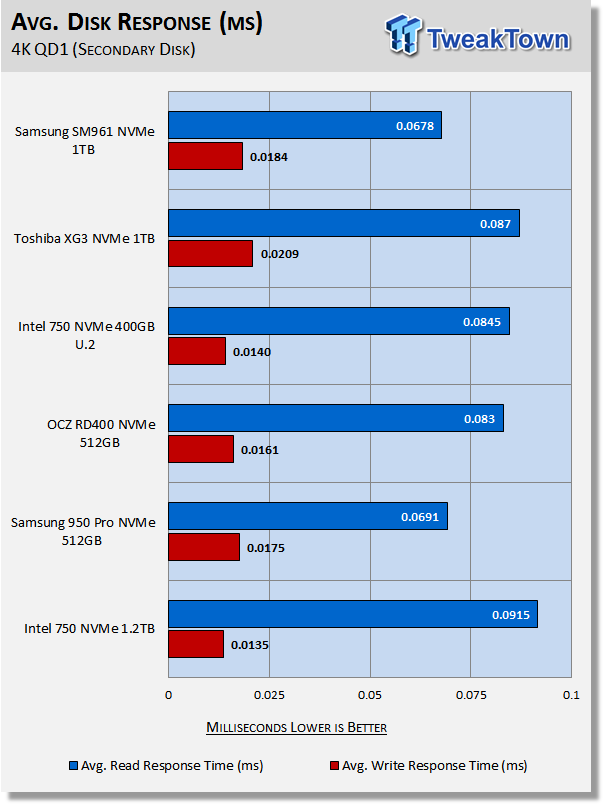
Chalk up another lab record for the SM961. The SM961 delivers the best (lowest) read response of any consumer/client SSD we've tested to date. As expected, Intel's 750 Series 1.2TB remains the lab champion for write response.
DiskBench - Transfer Rate
Version and / or Patch Used: 2.6.2.0
We use DiskBench to time a 28.6GB block (9,882 files in 1,247 folders) composed primarily of incompressible sequential and random data as it's transferred from our DC P3700 PCIe NVME SSD to our test drive. We then read from a 6GB zip file that's part of our 28.6GB data block to determine the test drive's read transfer rate. Our system is restarted prior to the read test to clear any cached data, ensuring an accurate test result.
Write Transfer Rate

Read Transfer Rate


We are a bit surprised that the SM961 does not win outright in both categories of this test. The SM961 does deliver by far the best read transfer rate of the bunch. However, write transfers lag a bit behind the 950 Pro. This is likely because our test data is so random in nature; at least certain parts of it are. There are points where the data is so random in nature that write transfer rates will drop as low to as 60 MB/s even when testing powerful NVMe-based SSDs. Intel's 750 series 1.2TB remains our write transfer champion. Samsung's SM961 1TB SSD sets another lab record for read transfers.
Benchmarks (Secondary Volume) - PCMark 8 Extended
Futuremark PCMark 8 Extended
Heavy Workload Model
PCMark 8's consistency test simulates an extended duration heavy workload environment. PCMark 8 has built-in, command line executed storage testing. The PCMark 8 Consistency test measures the performance consistency and the degradation tendency of a storage system.
The Storage test workloads are repeated. Between each repetition, the storage system is bombarded with a usage that causes degraded drive performance. In the first part of the test, the cycle continues until a steady degraded level of performance has been reached. (Steady State)
In the second part, the recovery of the system is tested by allowing the system to idle and measuring the performance after 5-minute long intervals. (Internal drive maintenance: Garbage Collection (GC)) The test reports the performance level at the start, the degraded steady-state, and the recovered state, as well as the number of iterations required to reach the degraded state and the recovered state.
We feel Futuremark's Consistency Test is the best test ever devised to show the true performance of solid state storage in an extended duration heavy workload environment. This test takes on average 13 to 17 hours to complete and writes somewhere between 450GB and 14,000GB of test data depending on the drive/array. If you want to know what an SSDs steady state performance is going to look like during a heavy workload, this test will show you.
Here's a breakdown of Futuremark's Consistency Test:
Precondition phase:
1. Write to the drive sequentially through up to the reported capacity with random data.
2. Write the drive through a second time (to take care of overprovisioning).
Degradation phase:
1. Run writes of random size between 8*512 and 2048*512 bytes on random offsets for 10 minutes.
2. Run performance test (one pass only).
3. Repeat 1 and 2 for 8 times, and on each pass increase the duration of random writes by 5 minutes.
Steady state phase:
1. Run writes of random size between 8*512 and 2048*512 bytes on random offsets for 50 minutes.
2. Run performance test (one pass only).
3. Repeat 1 and 2 for 5 times.
Recovery phase:
1. Idle for 5 minutes.
2. Run performance test (one pass only).
3. Repeat 1 and 2 for 5 times.
Storage Bandwidth
PCMark 8's Consistency test provides a ton of data output that we use to judge a drive's performance.

We consider steady state bandwidth (the blue bar) our test that carries the most weight in ranking a drive/arrays heavy workload performance. Performance after Garbage Collection (GC) (the orange and red bars) is what we consider the second most important consideration when ranking a drive's performance. Trace-based steady state testing is where true high performing SSDs are separated from the rest of the pack.
Again, we got much lower than expected results with Windows 10, so we ran the test with Windows 8.1 as well. We can clearly see a massive performance difference between the two operating systems. By switching to Windows 8.1, the SM961 went from dead last to third place, from terrible to well above average. We consider these results to be more proof that there is likely some issue going on with the SM961 and Windows 10 that could potentially be remedied with a dedicated Samsung NVMe driver.

We chart our test subject's storage bandwidth as reported at each of the test's 18 trace iterations. This gives us a good visual perspective of how our test subjects perform as testing progresses. This chart sheds more light on how the drives perform as they progress through the testing phases.
Total Access Time (Latency)
We chart the total time the disk is accessed as reported at each of the test's 18 trace iterations.

Windows 8.1 fares considerably better than Windows 10, but the SM961 shows itself to have the highest overall latency of the bunch; at least when it comes to this particular testing. Intel's 750 series SSDs have by far the lowest latency of the drives in our test pool, which is expected because of their enterprise DNA.
Disk Busy Time
Disk Busy Time is how long the disk is busy working. We chart the total time the disk is working as reported at each of the tests 18 trace iterations.

When latency is low, disk busy time is low as well.
Data Written
We measure the total amount of random data that our test drive/array is capable of writing during the degradation phases of the consistency test. Pre-conditioning data is not included in the total. The total combined time that degradation data is written to the drive/array is 470 minutes. This can be very telling. The better a drive/array can process a continuous stream of random data; the more data will be written.
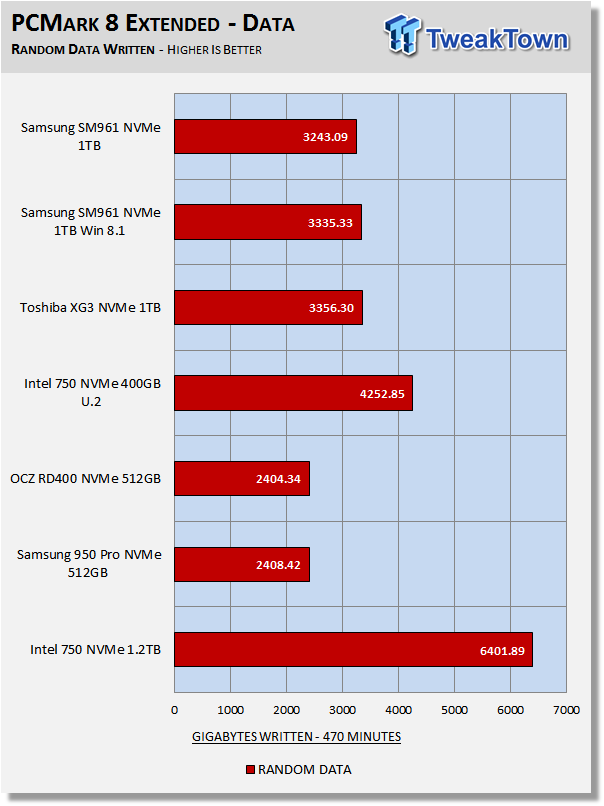
Overprovisioning and write latency are the biggest factors that determine the outcome of this portion of the test. Capacity can also have an impact on the outcome of this test. Capacity wins out for the SM961 in comparison to the 950 Pro and RD400. The SM961 able to write more random data than both the 950 Pro and RD400 in the same time span. We have always felt that Samsung's consumer/client SSDs would greatly benefit from a bit of factory overprovisioning. Not just with this test; with all of our workload testing.
Benchmarks (Secondary Volume) - 70/30 Mixed Workload
70/30 Mixed Workload Test (Sledgehammer)
Version and / or Patch Used: Iometer 2014
Heavy Workload Model
This test hammers a drive so hard we've dubbed it "Sledgehammer". Our 70/30 Mixed Workload test is designed to simulate a heavy-duty enthusiast/workstation steady-state environment. We feel that a mix of 70% read/30% write, full random 4K transfers best represents this type of user environment. Our test allows us to see the drive enter into and reach a steady state as the test progresses.
Phase one of the test preconditions the drive for 1 hour with 128K sequential writes. Phase two of the test runs a 70% read/30% write, full random 4K transfer workload on the drive for 1 hour. We log and chart (phase two) IOPS data at 5-second intervals for 1 hour (720 data points). 60 data points = 5 minutes.
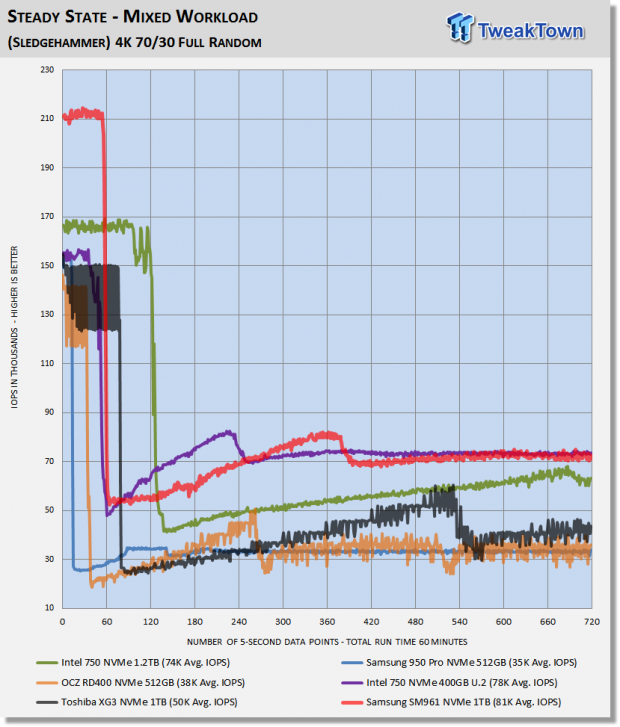
What we like about this test is that it reflects reality. Everything lines up, as it should. Consumer drives don't outperform Enterprise-Class SSDs that were designed for enterprise workloads. Consumer drives based on old technology are not outperforming modern Performance-Class SSDs, etc.
The results of this test come as a bit of a surprise. The SM961 possesses massive performance at higher queue depths, and we see that pay off with this testing. We run this test with one worker at QD32. Once again, the SM961 sets a new lab record for a consumer/client SSD; edging out our former champion the 400GB Intel 750 by an average of 3K IOPS.
Maxed-Out Performance (MOP)
This testing is just to see what the drive is capable of in an FOB (Fresh Out of Box) state under optimal conditions. We are utilizing Windows Server 2012 R2 64-bit OS for this testing. Same Hardware, just an OS change.

By far the best CDM results we've ever seen from a consumer/client SSD.
This is by far the best score we've ever seen from a consumer/client SSD. However, we still see an issue with 128K read. We have narrowed this issue down to something particular to Z170, as it does not happen with Z97. With Z97, however, sequential read speeds are substantially lower, so it is a trade-off that we feel still favors Z170.
Massive performance, by far the best we've ever seen from a consumer/client SSD. This is Intel DC P3700 level performance on a gum-stick.
This score isn't higher than Intel's 750 series, but it's getting close.
This score trails the 950 Pro considerably (512GB 950 Pro = 800 MB/s). However, it is the third best we've seen to date. The highlighted "Photoshop Heavy" elapsed test time is six seconds lower (better) than we got from Windows 10.
Final Thoughts
Polaris is a hot topic these days, and it doesn't just refer to GPUs. Samsung's Polaris SSD controller is a marvelous piece of engineering. Polaris takes sequential and random performance to a whole new level. Samsung's 48 layer VNAND is just as exciting because with it comes a much lower price per gigabyte, better endurance, and less heat.
Samsung's SM961 is an OEM SSD; the precursor to the upcoming 960 Pro. We fully expect that the 960 Pro will have a dedicated driver which will solve the problems we experienced with Windows 10 and moderate workload performance with the SM961. We hope Samsung will offer a proprietary NVMe driver that's compatible with the SM961 at some point because we believe we would see a massive increase in moderate workload performance with a well-tuned NVMe driver. Maybe we will even see RAPID mode enabled at some point?
Right now, if you want an NVMe 1TB M.2 SSD, you have just attainable two choices. OCZ's RD400 1TB and Samsung's SM961 OEM SSD. The RD400 is readily available; good luck getting your hands-on an SM961. Securing your your own SM961 at this time is hit and miss, because stock is very limited. The best source for obtaining an SM961 is RamCity, but you will likely have to back order. OCZ's RD400 has the advantage of a proprietary NVMe driver which expands compatibility to Windows 7 users and at the same time eliminates moderate workload performance issues with Windows 10. Both the RD400 and SM961 deliver excellent performance, however, the RD400 1TB is far more expensive than Samsung's SM961. Also, the SM961 is a much more powerful solution than OCZ's RD400 if you are running Windows 8.1. We expect to see Samsung's 960 Pro in the near future. When that happens, it (960 Pro) will have broader compatibility than the OEM SM961 and the Windows 10 moderate workload performance issues we experienced will be fully remedied.
Many lab records fell today while testing the Polaris-powered SM961 1TB NVMe SSD - twelve lab records to be exact. Samsung's Polaris controller is easily the most powerful client-based SSD controller, and yet we believe the SM961 is only scratching the surface of the performance potential that the Polaris controller has to offer.
Our user experience while running the Samsung's SM961 1TB M.2 NVMe SSD as our OS disk was as outstanding as you can imagine. Every task we threw at the drive was handled almost instantaneously. Our system booted like lightning and multi-tasking was the best we've experienced to date.
Samsung's SM961 1TB M.2 NVMe PCIe SSD is TweakTown recommended.
Pros:
- Performance
- Capacity
- Build Quality
- Most Appealing Form Factor
Cons:
- Moderate Workloads with Windows 10
 HighPoint Rocket 1604L Gen5 x16 NVMe SoftRAID AIC Review: half the price with full 59 GB/s speed
 UGREEN NASync DXP4800 GT Review: powerful 4-bay NAS with AMD Ryzen and dual 10GbE ports
 Phison E37T SSD Controller Exclusive Preview - The Fastest DRAMless SSD Platform Yet
 Seagate FireCuda X1070 4TB SSD Review - A New Mainstream Contender
 ASUSTOR Lockerstor 2 Gen2+ AS6702T v2 NAS Review - Fast Performance
 Sony declares AI as core part of future game development at PlayStation
 Security researchers trick AI browsers into revealing passwords using BioShock-inspired prompt injection
 Cyberpunk 2077 sells over 40 million copies, 10 million more than The Witcher 3 in the same time
 PlayStation games out before 2028 can still get disc reprints
 Nintendo may raise Switch 2 prices a second time, company plotting Fiscal Year 2028 with assumption that costs will rise
 Sony limiting PS5 disc drives to 1 per person following decision to kill PlayStation physical media
 Intel confirms new price hike for Core Ultra 200S Plus CPUs, blames rising supply chain costs
 Microsoft fires shots at Sony over PlayStation disc phase out by offering free CDs through GitHub
 Sony stock up 7% following decision to terminate game disc production
 Elon Musk's SpaceX showcases Grok-powered smartphone built to reshape AI interaction
 KTC H49S66 5K2K (5120x1440) 49-inch 180Hz Gaming Monitor Review
 Next Level Racing ERS3 Haptic Seat Review: immersive sim racing comfort with integrated haptics
 ASUS TUF Gaming X870-Pro WiFi7 W NEO Review - Tuffed up
 GIGABYTE GO27Q24G Gaming Monitor Review: Glossy OLED Gaming at 240Hz
 Lian Li B4-mATX Review: a compact mATX SFF case with excellent airflow and premium features
 MSI MPG 322UR QD-OLED X24 Review: A Brighter, Tougher 4K 240Hz QD-OLED for $1099
 Dell XPS 14 (2026) Laptop Review - Premium Quality, Impressive Performance
 Ocypus Sigma F36 BK ARGB Cooling Fan Review: high airflow and unified design in one frame
 7 tips to organize your Windows files for faster, easier access
 Intel Arc G3 Extreme first impressions with MSI's Claw 8 EX AI+ - Incredible power for an extreme price
 How to fix Wi-Fi Adapter Not Working on Windows laptops: troubleshooting tips
 Hisense U7SG 4K TV: Modern Entertainment for the New Age
 6 underrated Microsoft Word features worth using to boost your productivity
 Level Up Your PC Gaming with these Fantastic ASUS Prime Day Deals on GPUs, Motherboards, and More
 GIGABYTE Wants to Kickstart Your New Gaming PC or Upgrade with These Limited-Time Deals
 7 Windows settings to change right after installation for better privacy, security, and performance
 I stopped Windows 11 notifications from interrupting me with Do Not Disturb, Focus, and a priority list